| Param | Original file | Final file |
|---|---|---|
| Filename | modeM0/AS1A05_205T01_9000002824_18962cztM0_level2.evt | modeM0/AS1A05_205T01_9000002824_18962cztM0_level2_quad_clean.evt |
| Size (bytes) | 527,644,800 | 101,557,440 |
| Size | 503.2 MB | 96.9 MB |
| Events in quadrant A | 3,266,126 | 671,019 |
| Events in quadrant B | 4,516,925 | 672,025 |
| Events in quadrant C | 3,336,437 | 664,014 |
| Events in quadrant D | 4,438,845 | 634,675 |
| Mode M9 | |||
|---|---|---|---|
| Quadrant | BADHDUFLAG | Total packets | Discarded packets |
| A | 0 | 16 | 0 |
| B | 0 | 17 | 0 |
| C | 0 | 17 | 0 |
| D | 0 | 17 | 0 |
| Mode SS | |||
|---|---|---|---|
| Quadrant | BADHDUFLAG | Total packets | Discarded packets |
| A | 0 | 126 | 0 |
| B | 0 | 126 | 0 |
| C | 0 | 126 | 0 |
| D | 0 | 126 | 0 |
| Mode M0 | |||
|---|---|---|---|
| Quadrant | BADHDUFLAG | Total packets | Discarded packets |
| A | 0 | 13253 | 2 |
| B | 0 | 17566 | 2 |
| C | 0 | 13512 | 2 |
| D | 0 | 17003 | 2 |
| Quadrant | Total seconds | Saturated seconds | Saturation percentage |
|---|---|---|---|
| A | 6216 | 43 | 0.691763% |
| B | 6216 | 310 | 4.987130% |
| C | 6216 | 94 | 1.512227% |
| D | 6216 | 332 | 5.341055% |
Noise dominated data is calculated using 1-second bins in cleaned event files. If a bin has >2000 counts, and if more than 50% of those come from <1% of pixels, then it is considered to be noise-dominated and hence unusable.
| Quadrant | # 1 sec bins | Bins with >0 counts | Bins with >2000 counts | High rate bins dominated by noise | Noise dominated (total time) | Noise dominated (detector-on time) | Marked lightcurve |
|---|---|---|---|---|---|---|---|
| A | 7556 | 6217 | 3 | 3 | 0.04% | 0.05% | 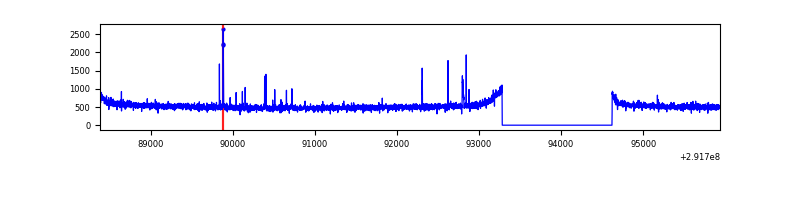 |
| B | 7556 | 6217 | 185 | 185 | 2.45% | 2.98% | 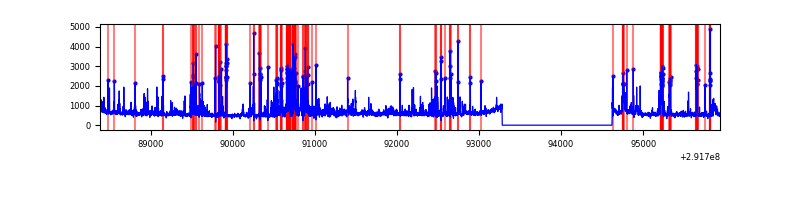 |
| C | 7556 | 6217 | 0 | 0 | 0.00% | 0.00% | 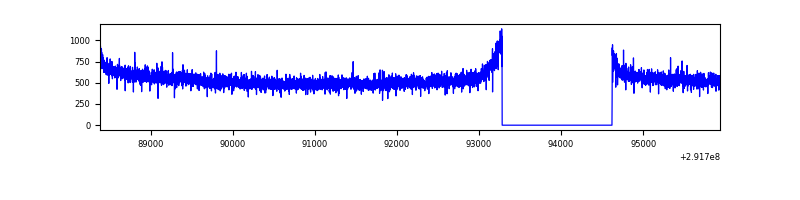 |
| D | 7556 | 6217 | 228 | 228 | 3.02% | 3.67% | 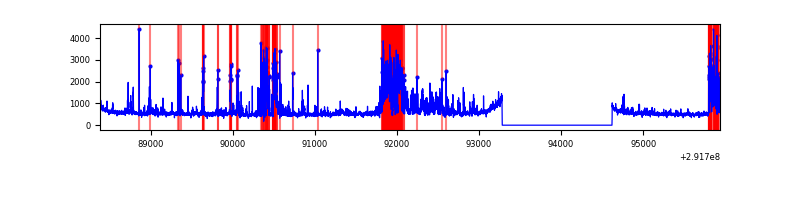 |
Top three noisy pixels from each quadrant. If the there are fewer than three noisy pixels in the level2.evt file, extra rows are filled as -1
| Pixel properties | Quadrant properties | ||||||
|---|---|---|---|---|---|---|---|
| Quadrant | DetID | PixID | Counts | Sigma | Mean | Median | Sigma |
| A | 14 | 235 | 37572 | 220.72 | 835 | 820 | 166.5 |
| A | 15 | 174 | 15765 | 89.75 | 835 | 820 | 166.5 |
| A | 13 | 254 | 7573 | 40.56 | 835 | 820 | 166.5 |
| B | 3 | 112 | 1032315 | 6768.27 | 817 | 798 | 152.4 |
| B | 0 | 189 | 243004 | 1589.23 | 817 | 798 | 152.4 |
| B | 7 | 220 | 23186 | 146.9 | 817 | 798 | 152.4 |
| C | 14 | 238 | 128713 | 667.77 | 821 | 831 | 191.5 |
| C | 6 | 96 | 7510 | 34.88 | 821 | 831 | 191.5 |
| C | 13 | 61 | 5643 | 25.13 | 821 | 831 | 191.5 |
| D | 7 | 238 | 608895 | 3071.54 | 815 | 792 | 198.0 |
| D | 12 | 218 | 517342 | 2609.11 | 815 | 792 | 198.0 |
| D | 1 | 52 | 106259 | 532.72 | 815 | 792 | 198.0 |
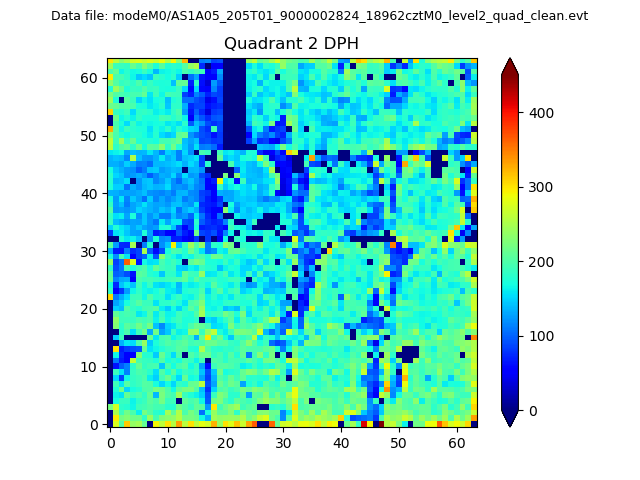
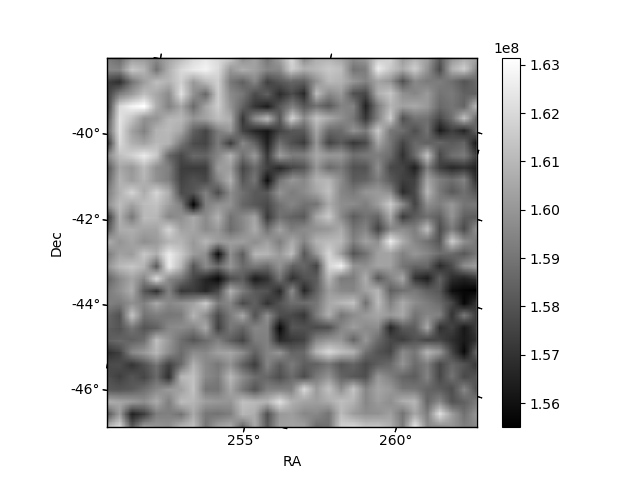
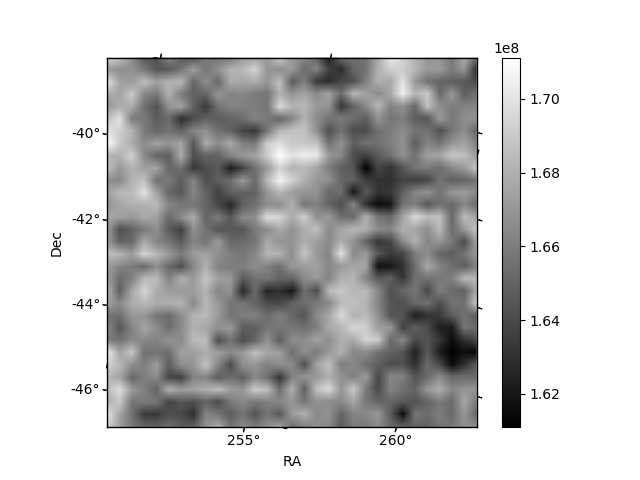
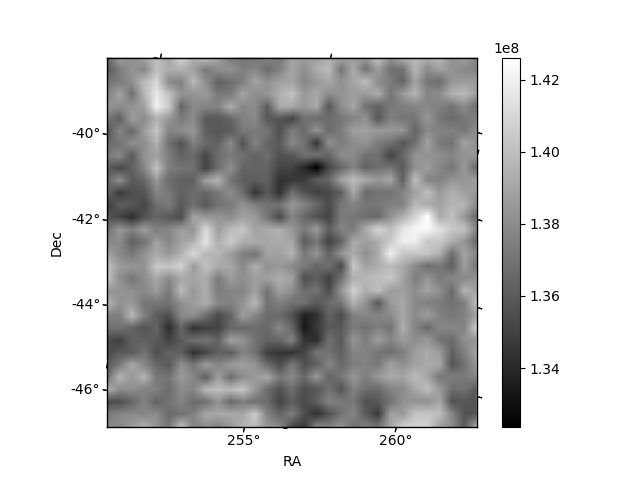
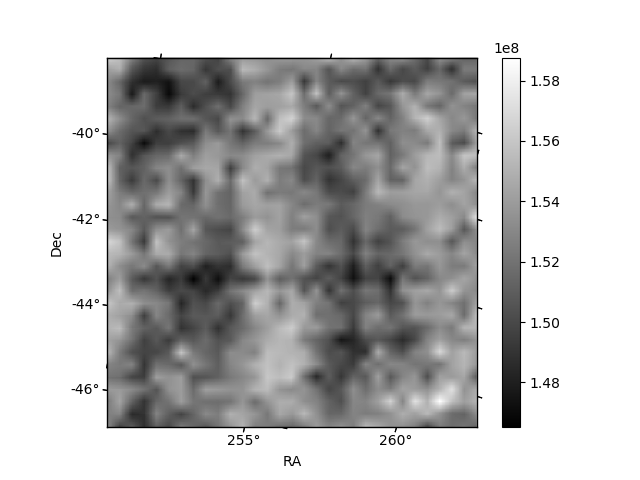
Histogram calculated using DETX and DETY for each event in the final _common_clean file
| Quadrant A |  |
 |
Quadrant B |
|---|---|---|---|
| Quadrant D | 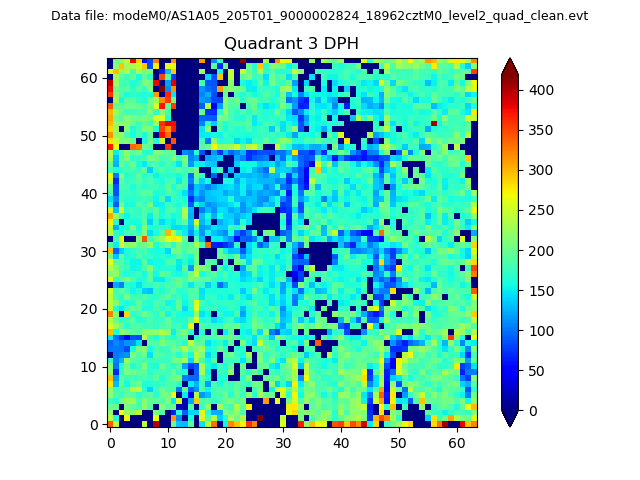 |
 |
Quadrant C |
| Plot type | Count rate plots | Images |
|---|---|---|
| Comparison with Poisson distribution Blue bars denote a histogram of data divided into 1 sec bins. Red curve is a Poisson curve with rate = median count rate of data. |
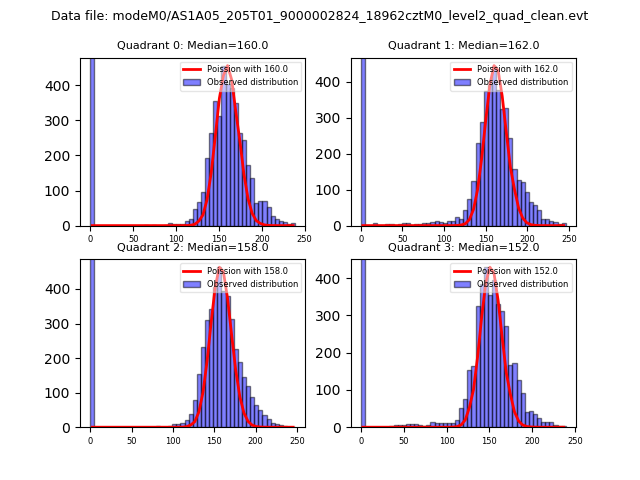 |
 |
| Quadrant-wise count rates Data is divided into 100 sec bins |
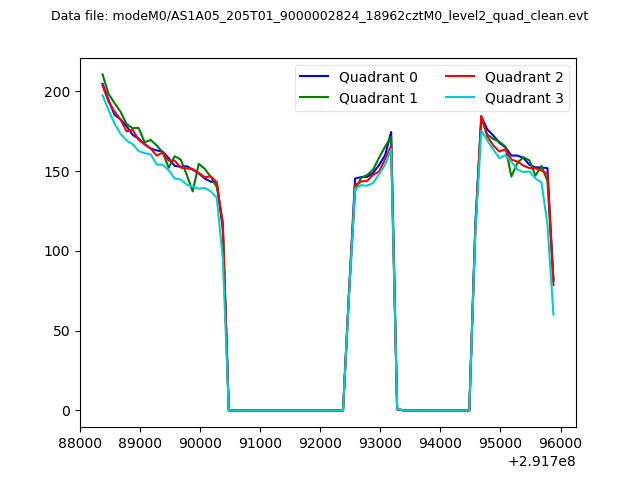 |
|
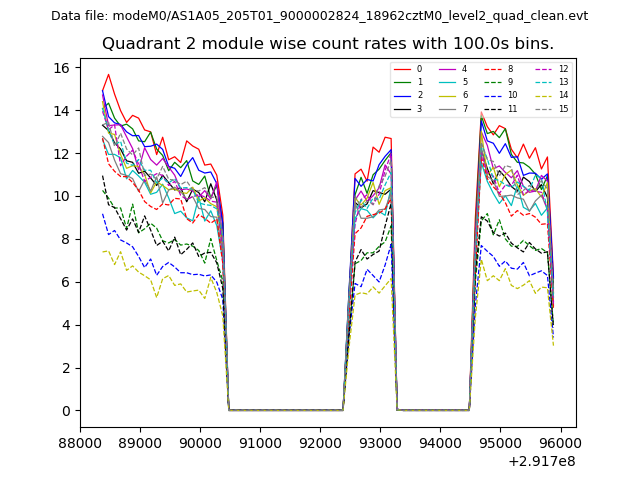
| Module-wise count rates for Quadrant A Data is divided into 100 sec bins |
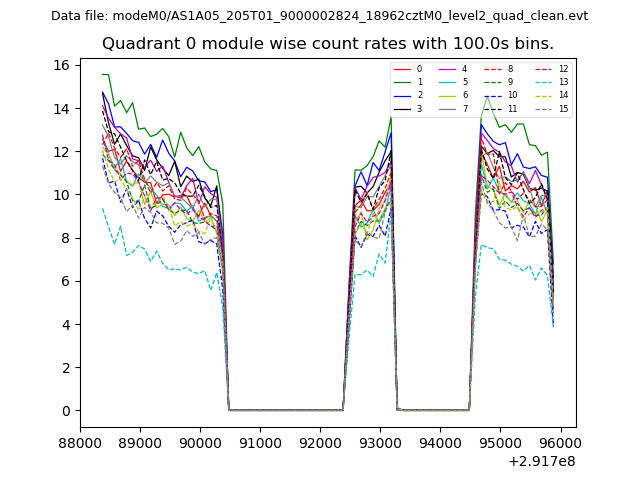 |
 |
| Module-wise count rates for Quadrant B Data is divided into 100 sec bins |
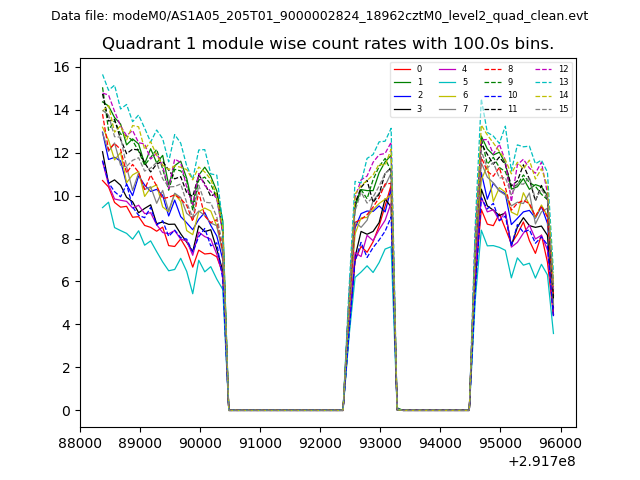 |
 |
| Module-wise count rates for Quadrant C Data is divided into 100 sec bins |
 |
 |
| Module-wise count rates for Quadrant D Data is divided into 100 sec bins |
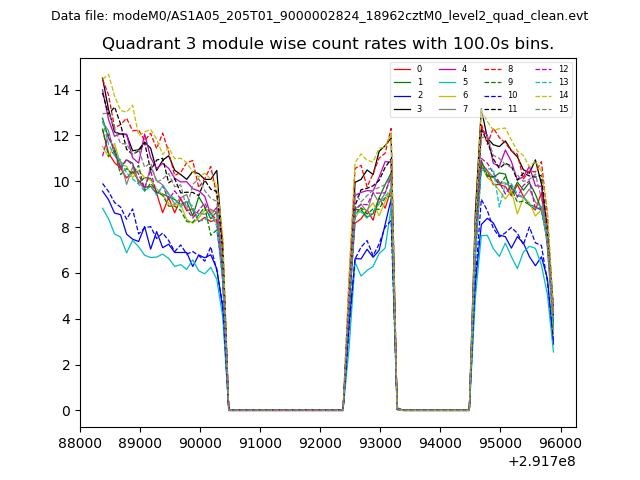 |
 |
| Parameter | Plot |
|---|---|
| CZT HV Monitor | 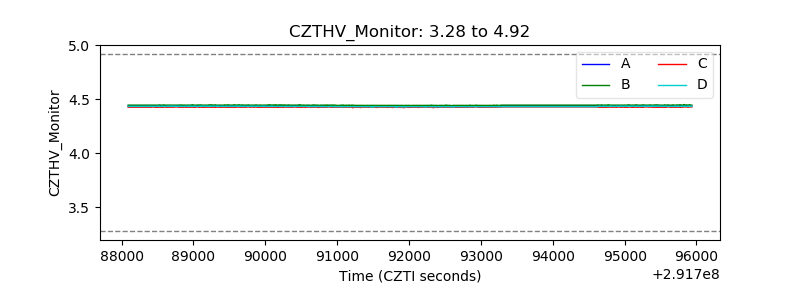 |
| D_VDD | 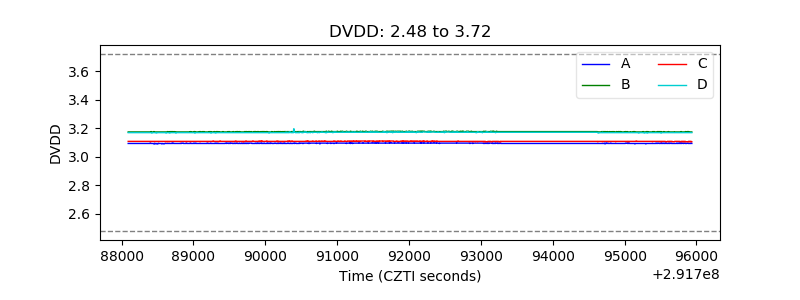 |
| Temperature 1 | 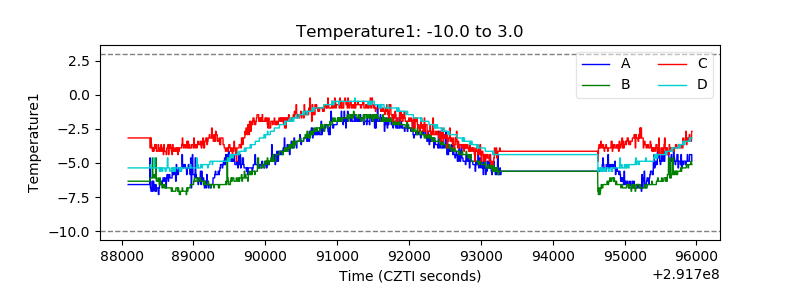 |
| Veto HV Monitor | 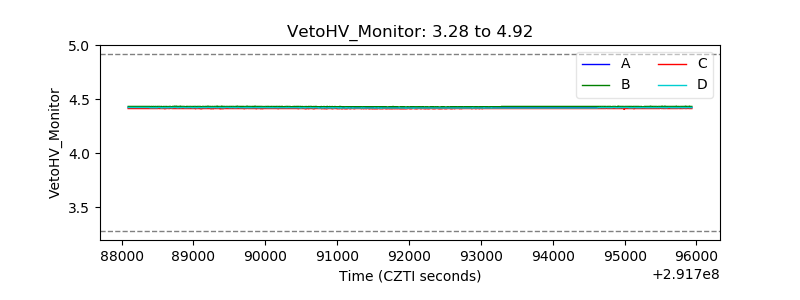 |
| Veto LLD |  |
| Alpha Counter | 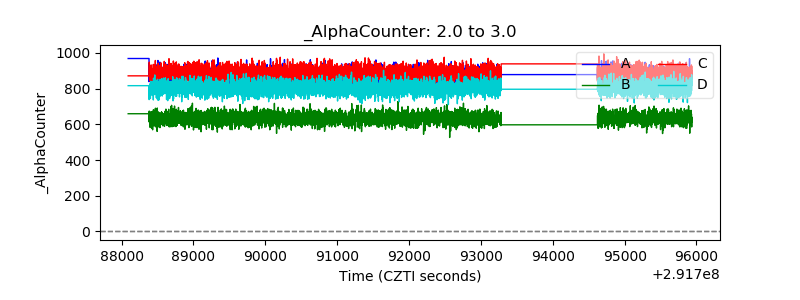 |
| _CPM_Rate | 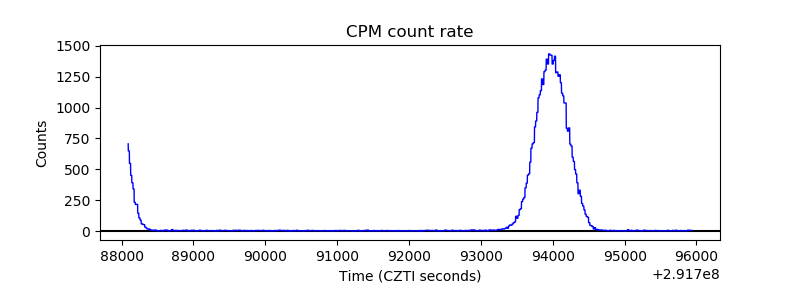 |
| CZT Counter | 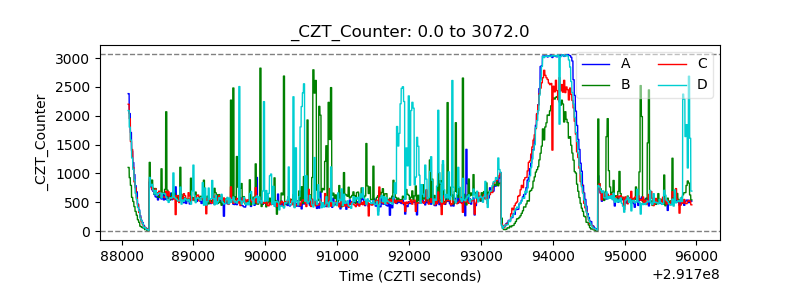 |
| +2.5 Volts monitor |  |
| +5 Volts monitor | 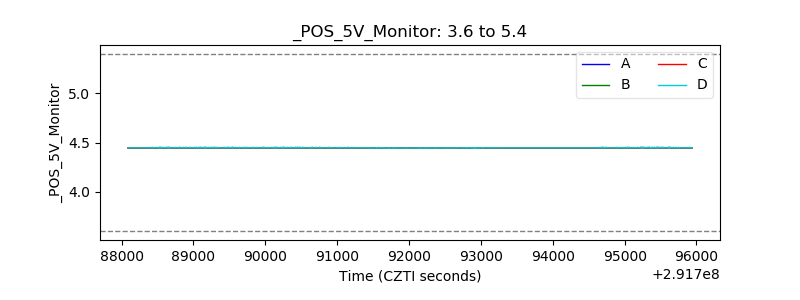 |
| _ROLL_ROT | 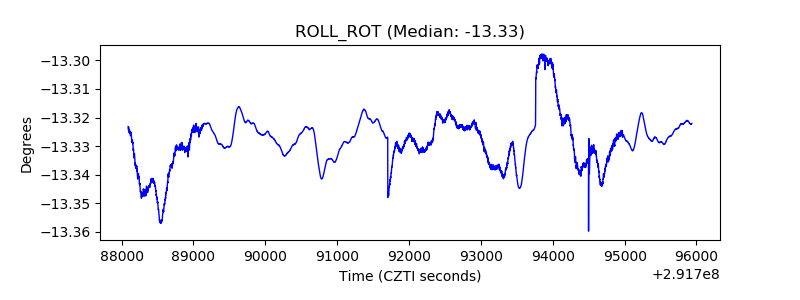 |
| _Roll_DEC | 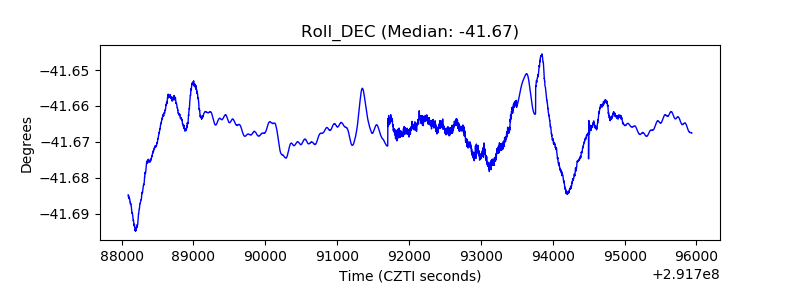 |
| _Roll_RA | 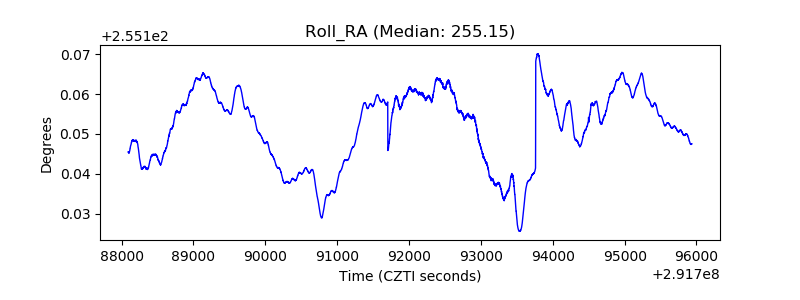 |
| Veto Counter | 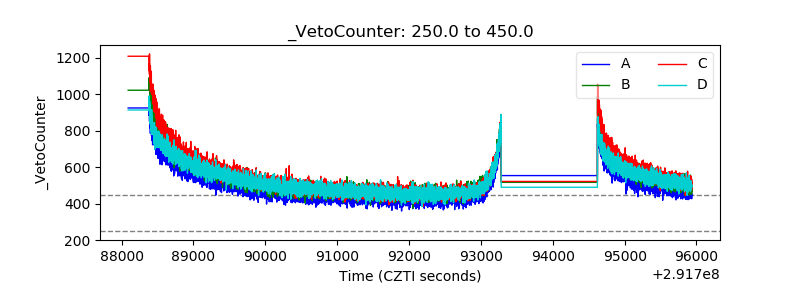 |