| Param | Original file | Final file |
|---|---|---|
| Filename | modeM0/AS1A05_205T01_9000002824_18964cztM0_level2.evt | modeM0/AS1A05_205T01_9000002824_18964cztM0_level2_quad_clean.evt |
| Size (bytes) | 534,003,840 | 88,594,560 |
| Size | 509.3 MB | 84.5 MB |
| Events in quadrant A | 3,151,841 | 566,886 |
| Events in quadrant B | 4,049,445 | 571,498 |
| Events in quadrant C | 3,155,930 | 555,460 |
| Events in quadrant D | 5,375,417 | 536,941 |
| Mode M9 | |||
|---|---|---|---|
| Quadrant | BADHDUFLAG | Total packets | Discarded packets |
| A | 0 | 8 | 0 |
| B | 0 | 8 | 0 |
| C | 0 | 8 | 0 |
| D | 0 | 8 | 0 |
| Mode SS | |||
|---|---|---|---|
| Quadrant | BADHDUFLAG | Total packets | Discarded packets |
| A | 0 | 132 | 0 |
| B | 0 | 132 | 0 |
| C | 0 | 132 | 0 |
| D | 0 | 132 | 0 |
| Mode M0 | |||
|---|---|---|---|
| Quadrant | BADHDUFLAG | Total packets | Discarded packets |
| A | 0 | 13360 | 1 |
| B | 0 | 15985 | 1 |
| C | 0 | 13244 | 1 |
| D | 0 | 20193 | 1 |
| Quadrant | Total seconds | Saturated seconds | Saturation percentage |
|---|---|---|---|
| A | 6480 | 64 | 0.987654% |
| B | 6481 | 224 | 3.456257% |
| C | 6481 | 84 | 1.296096% |
| D | 6480 | 756 | 11.666667% |
Noise dominated data is calculated using 1-second bins in cleaned event files. If a bin has >2000 counts, and if more than 50% of those come from <1% of pixels, then it is considered to be noise-dominated and hence unusable.
| Quadrant | # 1 sec bins | Bins with >0 counts | Bins with >2000 counts | High rate bins dominated by noise | Noise dominated (total time) | Noise dominated (detector-on time) | Marked lightcurve |
|---|---|---|---|---|---|---|---|
| A | 7345 | 6481 | 12 | 12 | 0.16% | 0.19% | 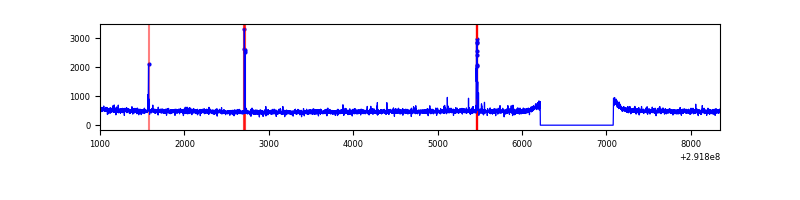 |
| B | 7346 | 6482 | 108 | 108 | 1.47% | 1.67% |  |
| C | 7346 | 6482 | 0 | 0 | 0.00% | 0.00% | 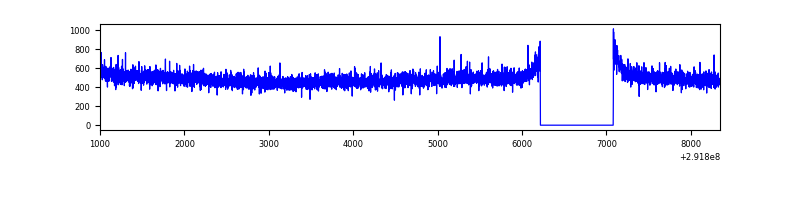 |
| D | 7345 | 6481 | 474 | 474 | 6.45% | 7.31% | 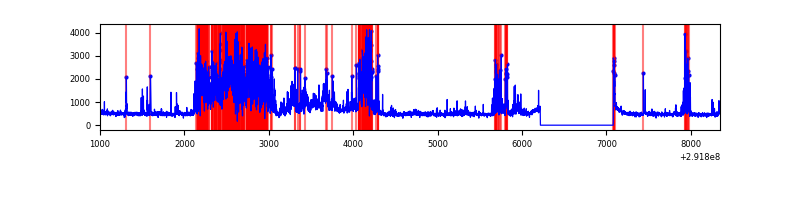 |
Top three noisy pixels from each quadrant. If the there are fewer than three noisy pixels in the level2.evt file, extra rows are filled as -1
| Pixel properties | Quadrant properties | ||||||
|---|---|---|---|---|---|---|---|
| Quadrant | DetID | PixID | Counts | Sigma | Mean | Median | Sigma |
| A | 14 | 235 | 46197 | 281.35 | 803 | 787 | 161.4 |
| A | 15 | 191 | 12833 | 74.64 | 803 | 787 | 161.4 |
| A | 13 | 254 | 7321 | 40.48 | 803 | 787 | 161.4 |
| B | 3 | 112 | 712233 | 4735.0 | 792 | 772 | 150.3 |
| B | 7 | 220 | 129944 | 859.68 | 792 | 772 | 150.3 |
| B | 0 | 189 | 71842 | 472.99 | 792 | 772 | 150.3 |
| C | 14 | 238 | 119577 | 652.3 | 778 | 783 | 182.1 |
| C | 13 | 61 | 5536 | 26.1 | 778 | 783 | 182.1 |
| C | 7 | 220 | 1996 | 6.66 | 778 | 783 | 182.1 |
| D | 7 | 238 | 1846743 | 9870.81 | 757 | 736 | 187.0 |
| D | 12 | 218 | 307381 | 1639.67 | 757 | 736 | 187.0 |
| D | 12 | 17 | 189911 | 1011.54 | 757 | 736 | 187.0 |
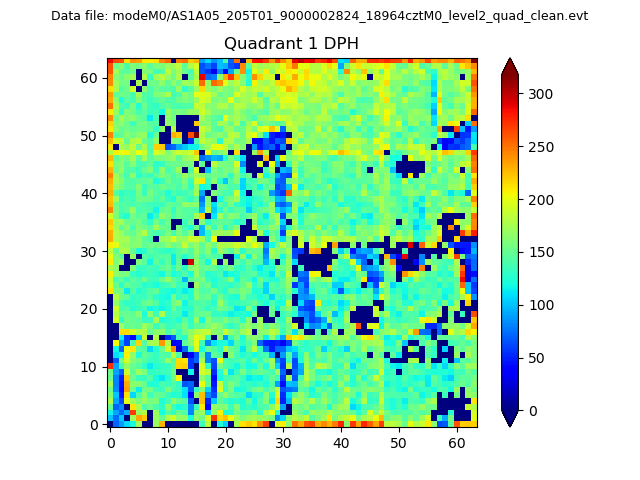
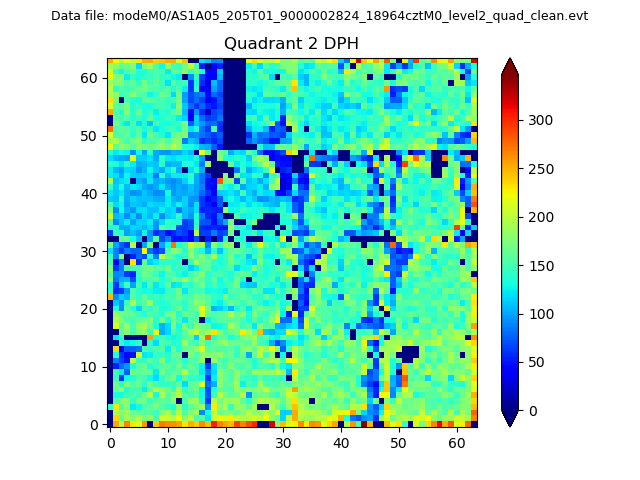
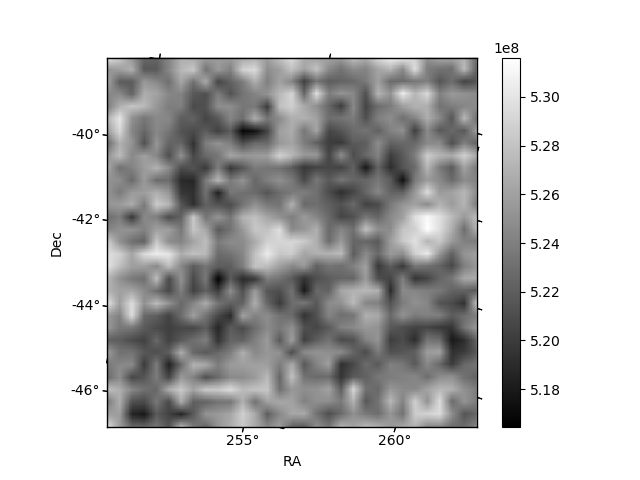
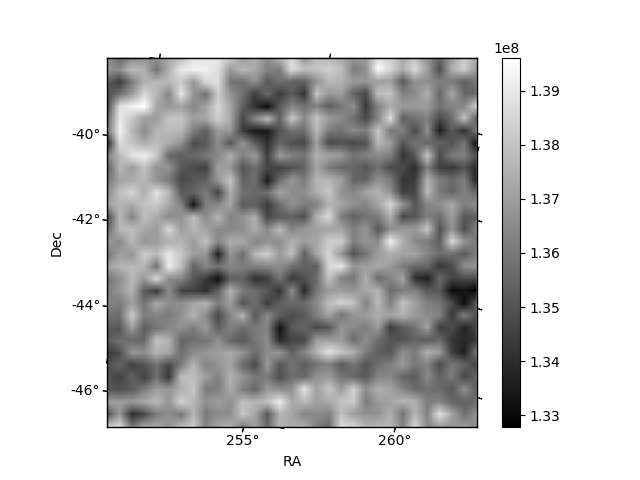
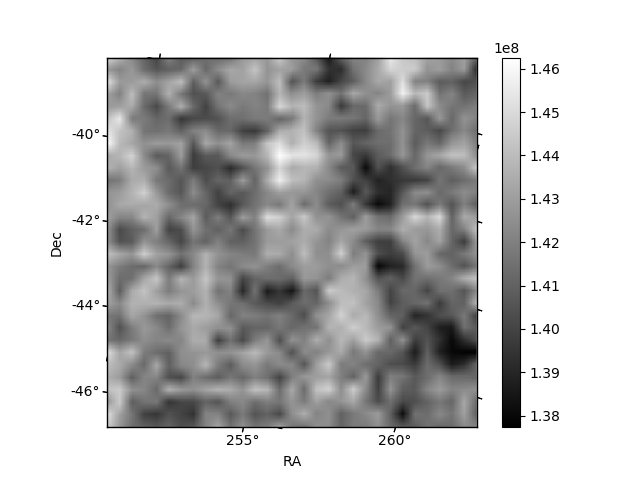
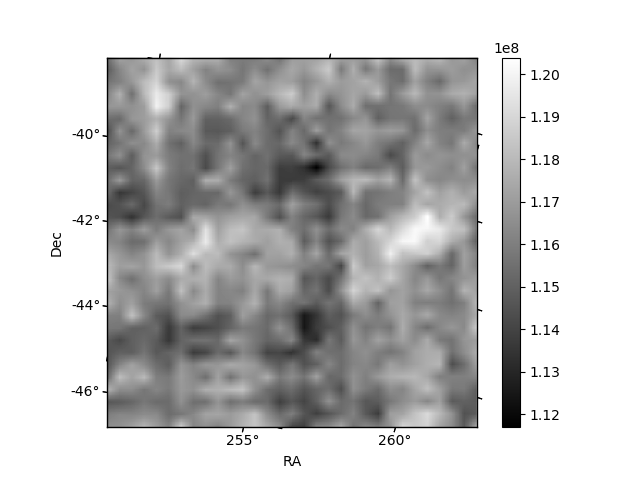
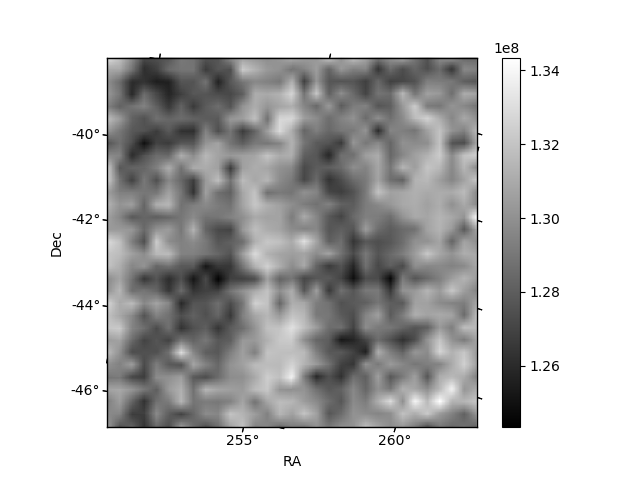
Histogram calculated using DETX and DETY for each event in the final _common_clean file
| Quadrant A | 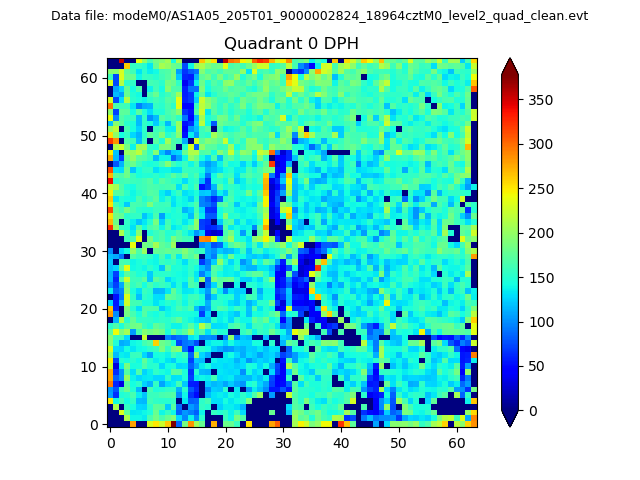 |
 |
Quadrant B |
|---|---|---|---|
| Quadrant D | 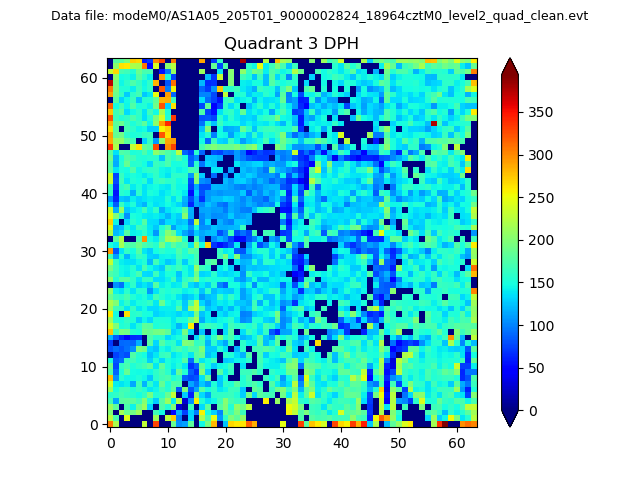 |
 |
Quadrant C |
| Plot type | Count rate plots | Images |
|---|---|---|
| Comparison with Poisson distribution Blue bars denote a histogram of data divided into 1 sec bins. Red curve is a Poisson curve with rate = median count rate of data. |
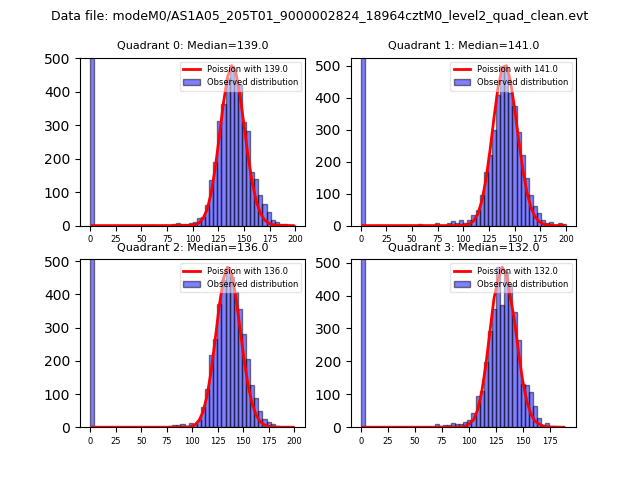 |
 |
| Quadrant-wise count rates Data is divided into 100 sec bins |
 |
|
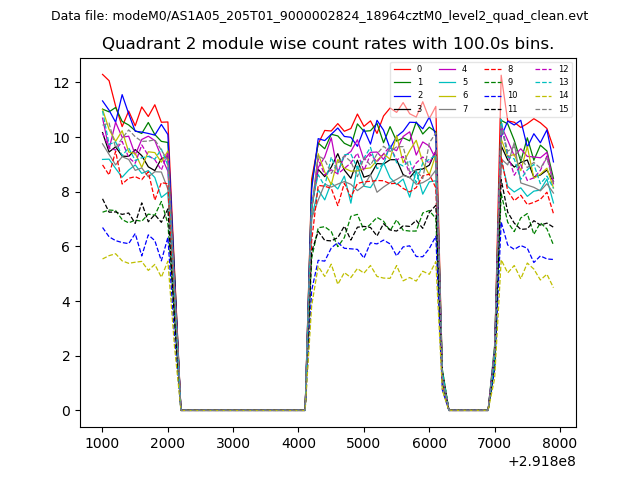
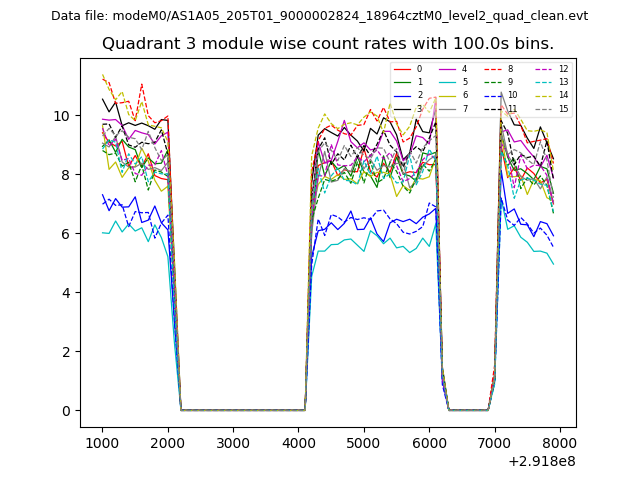
| Module-wise count rates for Quadrant A Data is divided into 100 sec bins |
 |
 |
| Module-wise count rates for Quadrant B Data is divided into 100 sec bins |
 |
 |
| Module-wise count rates for Quadrant C Data is divided into 100 sec bins |
 |
 |
| Module-wise count rates for Quadrant D Data is divided into 100 sec bins |
 |
 |
| Parameter | Plot |
|---|---|
| CZT HV Monitor | 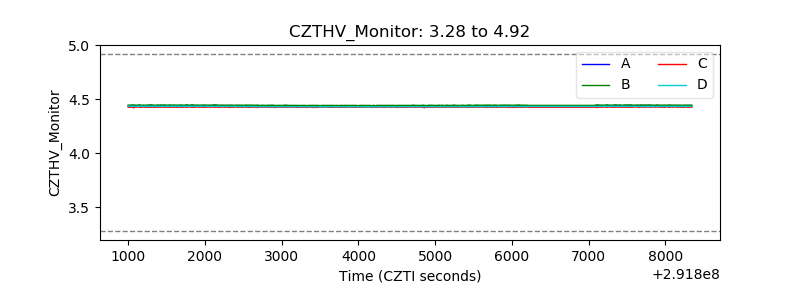 |
| D_VDD | 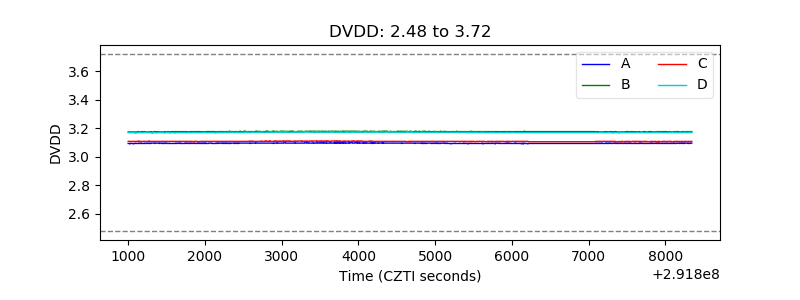 |
| Temperature 1 | 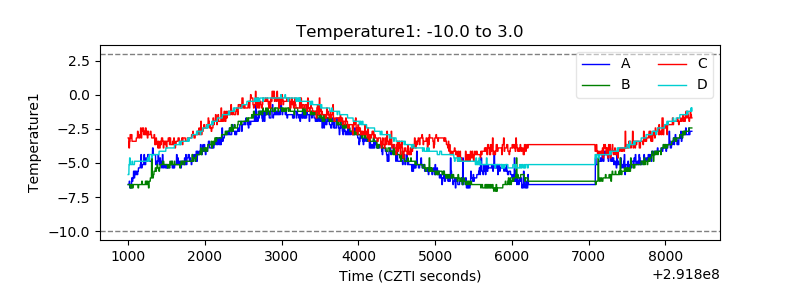 |
| Veto HV Monitor | 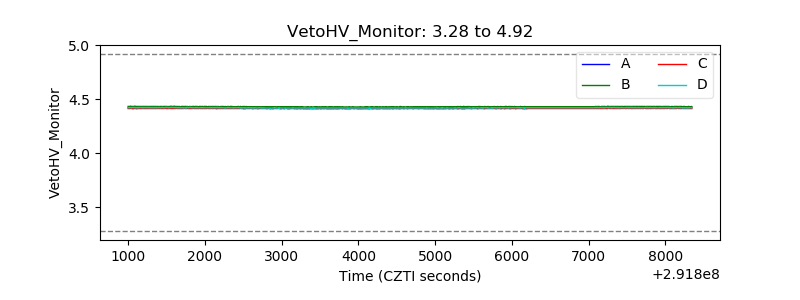 |
| Veto LLD | 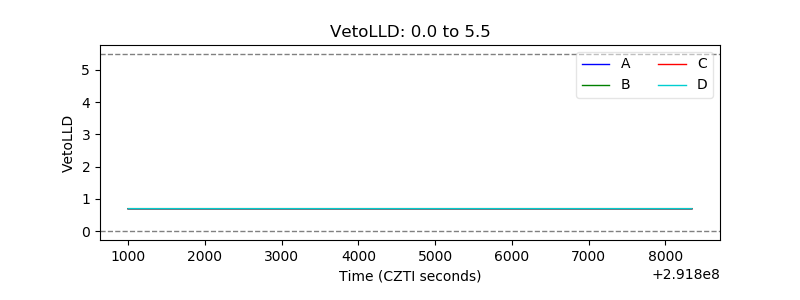 |
| Alpha Counter | 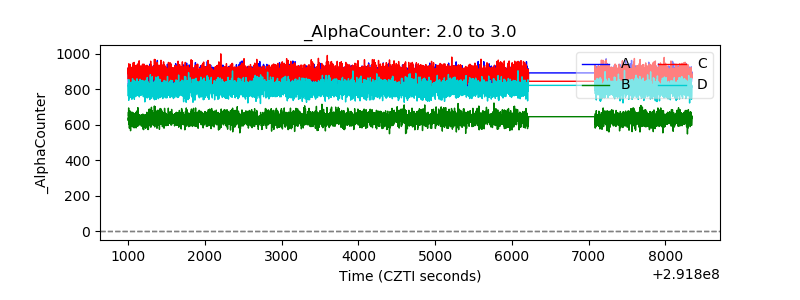 |
| _CPM_Rate | 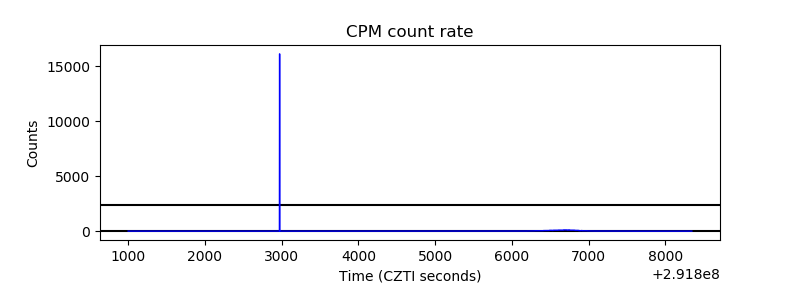 |
| CZT Counter | 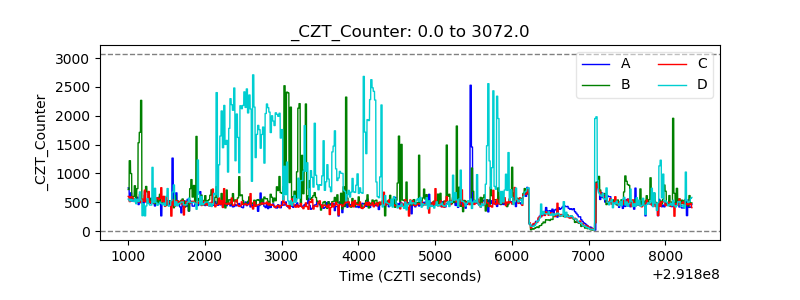 |
| +2.5 Volts monitor |  |
| +5 Volts monitor |  |
| _ROLL_ROT |  |
| _Roll_DEC | 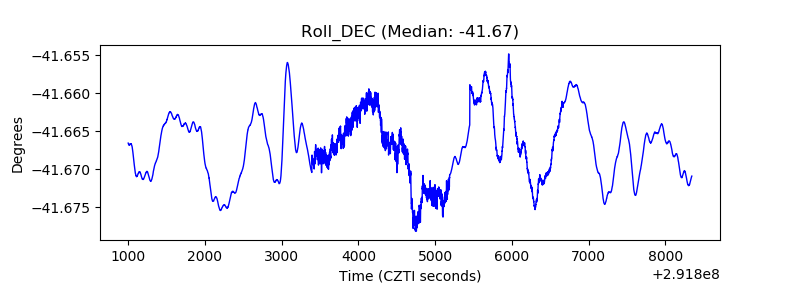 |
| _Roll_RA | 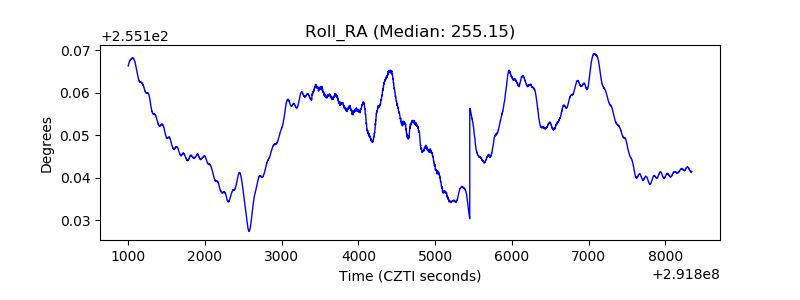 |
| Veto Counter |  |