| Param | Original file | Final file |
|---|---|---|
| Filename | modeM0/AS1A05_205T01_9000002824_18966cztM0_level2.evt | modeM0/AS1A05_205T01_9000002824_18966cztM0_level2_quad_clean.evt |
| Size (bytes) | 701,496,000 | 81,947,520 |
| Size | 669.0 MB | 78.2 MB |
| Events in quadrant A | 3,643,642 | 508,809 |
| Events in quadrant B | 4,260,475 | 514,521 |
| Events in quadrant C | 3,702,344 | 501,787 |
| Events in quadrant D | 9,121,417 | 424,559 |
| Mode SS | |||
|---|---|---|---|
| Quadrant | BADHDUFLAG | Total packets | Discarded packets |
| A | 0 | 154 | 0 |
| B | 0 | 154 | 0 |
| C | 0 | 154 | 0 |
| D | 0 | 154 | 0 |
| Mode M0 | |||
|---|---|---|---|
| Quadrant | BADHDUFLAG | Total packets | Discarded packets |
| A | 0 | 15901 | 3 |
| B | 0 | 17523 | 2 |
| C | 0 | 15884 | 2 |
| D | 0 | 32271 | 2 |
| Quadrant | Total seconds | Saturated seconds | Saturation percentage |
|---|---|---|---|
| A | 7627 | 230 | 3.015602% |
| B | 7628 | 343 | 4.496592% |
| C | 7628 | 212 | 2.779234% |
| D | 7628 | 1873 | 24.554274% |
Noise dominated data is calculated using 1-second bins in cleaned event files. If a bin has >2000 counts, and if more than 50% of those come from <1% of pixels, then it is considered to be noise-dominated and hence unusable.
| Quadrant | # 1 sec bins | Bins with >0 counts | Bins with >2000 counts | High rate bins dominated by noise | Noise dominated (total time) | Noise dominated (detector-on time) | Marked lightcurve |
|---|---|---|---|---|---|---|---|
| A | 7692 | 7630 | 0 | 0 | 0.00% | 0.00% | 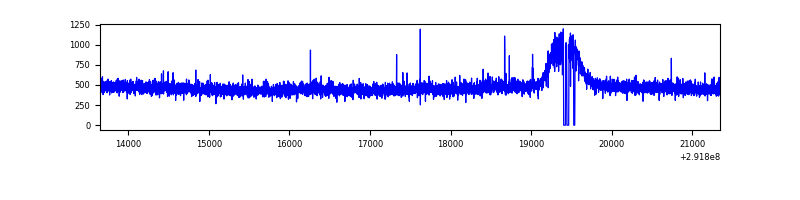 |
| B | 7693 | 7631 | 62 | 62 | 0.81% | 0.81% | 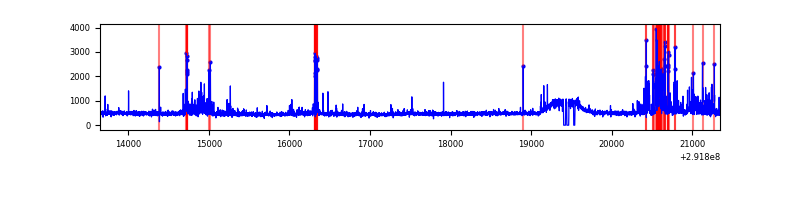 |
| C | 7693 | 7631 | 0 | 0 | 0.00% | 0.00% | 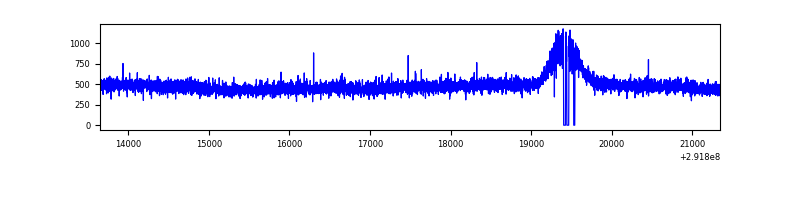 |
| D | 7693 | 7631 | 1376 | 1376 | 17.89% | 18.03% | 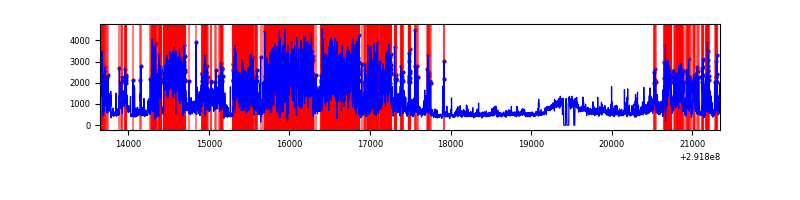 |
Top three noisy pixels from each quadrant. If the there are fewer than three noisy pixels in the level2.evt file, extra rows are filled as -1
| Pixel properties | Quadrant properties | ||||||
|---|---|---|---|---|---|---|---|
| Quadrant | DetID | PixID | Counts | Sigma | Mean | Median | Sigma |
| A | 13 | 254 | 10677 | 50.8 | 944 | 922 | 192.0 |
| A | 0 | 226 | 8172 | 37.75 | 944 | 922 | 192.0 |
| A | 3 | 137 | 7405 | 33.76 | 944 | 922 | 192.0 |
| B | 7 | 220 | 280456 | 1548.34 | 932 | 906 | 180.5 |
| B | 3 | 112 | 236992 | 1307.6 | 932 | 906 | 180.5 |
| B | 0 | 189 | 40074 | 216.94 | 932 | 906 | 180.5 |
| C | 14 | 238 | 138757 | 638.85 | 907 | 912 | 215.8 |
| C | 7 | 220 | 14841 | 64.55 | 907 | 912 | 215.8 |
| C | 3 | 233 | 7451 | 30.31 | 907 | 912 | 215.8 |
| D | 12 | 218 | 3178923 | 15199.96 | 846 | 822 | 209.1 |
| D | 7 | 238 | 2358313 | 11275.22 | 846 | 822 | 209.1 |
| D | 1 | 52 | 247612 | 1180.33 | 846 | 822 | 209.1 |
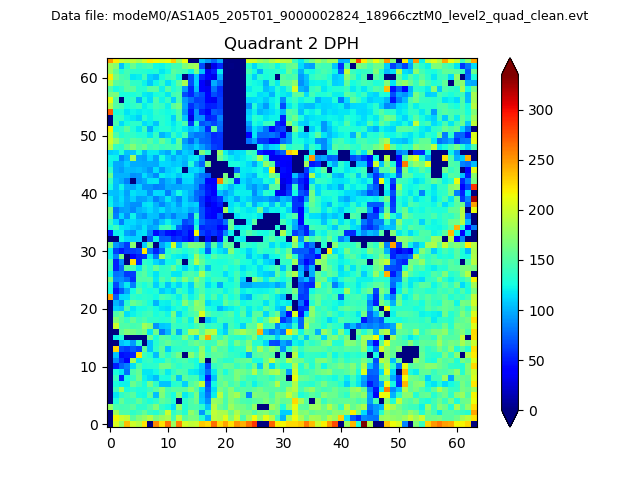
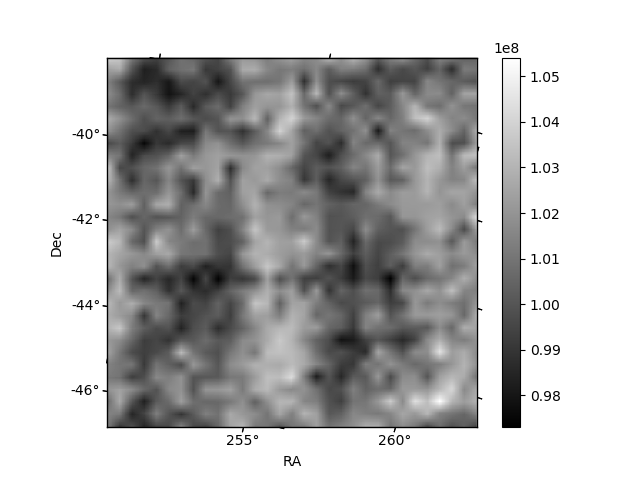
Histogram calculated using DETX and DETY for each event in the final _common_clean file
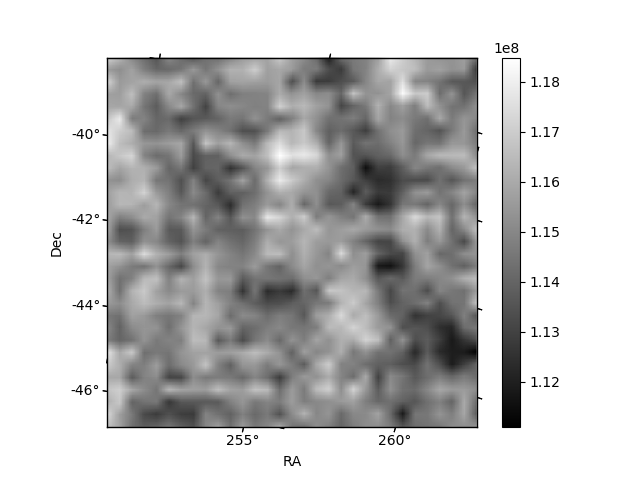
| Quadrant A | 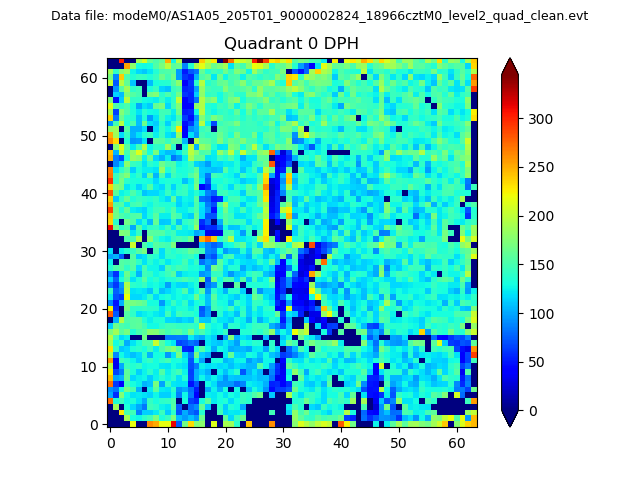 |
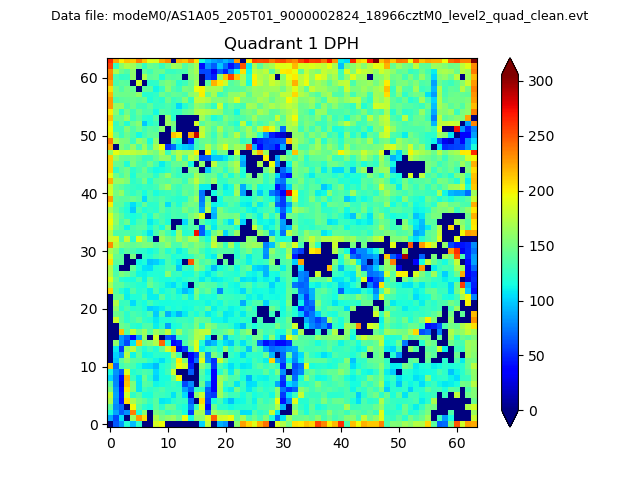 |
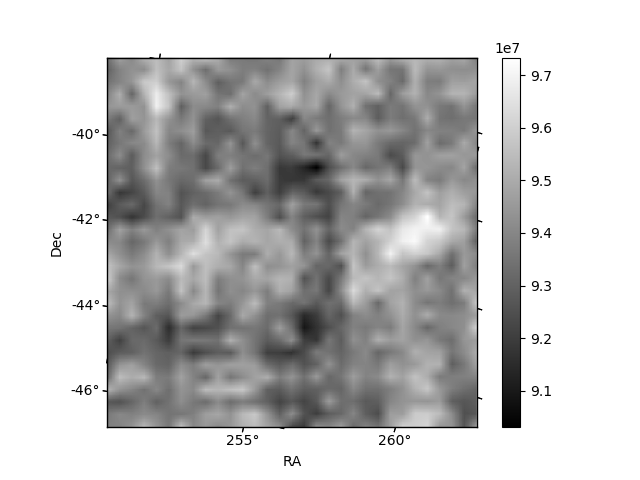
Quadrant B |
|---|---|---|---|
| Quadrant D | 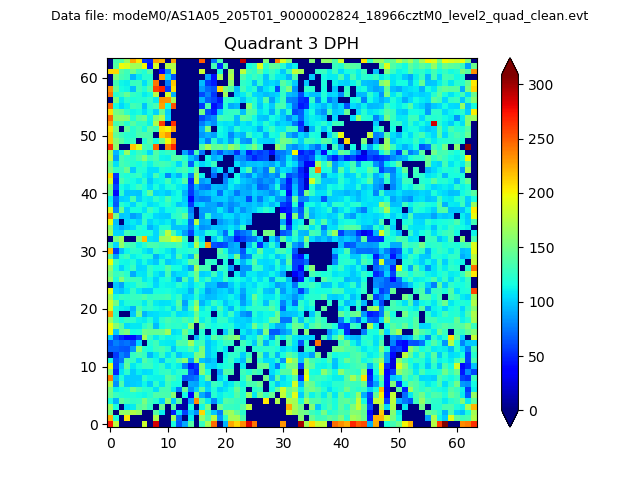 |
 |
Quadrant C |
| Plot type | Count rate plots | Images |
|---|---|---|
| Comparison with Poisson distribution Blue bars denote a histogram of data divided into 1 sec bins. Red curve is a Poisson curve with rate = median count rate of data. |
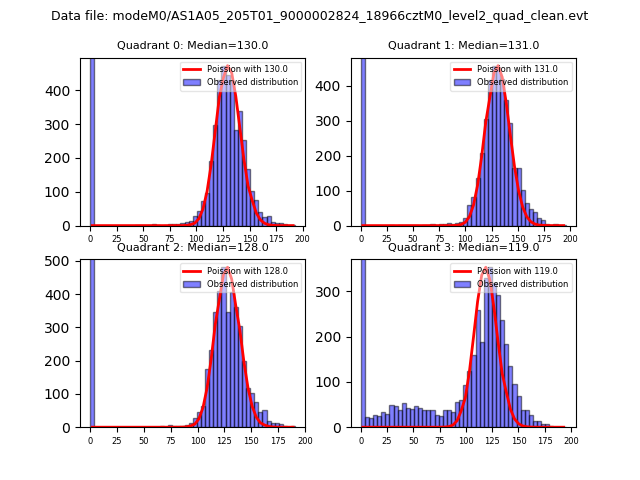 |
 |
| Quadrant-wise count rates Data is divided into 100 sec bins |
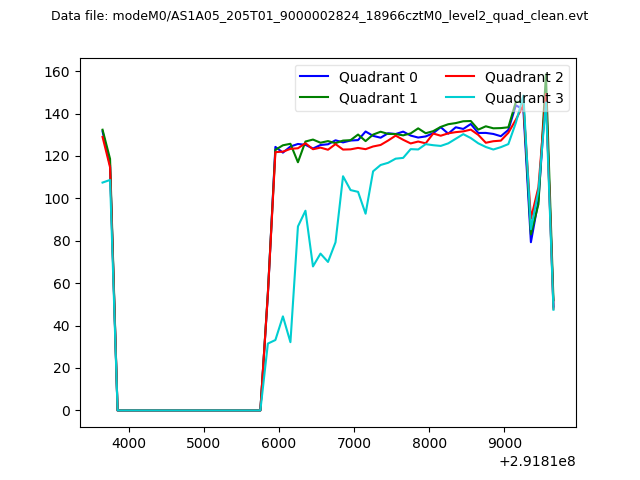 |
|
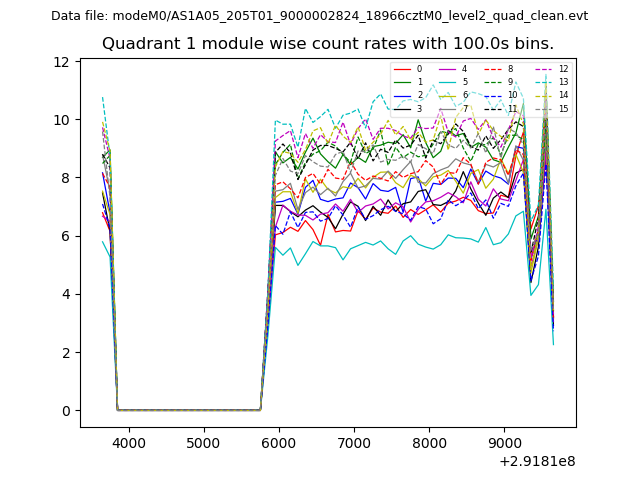
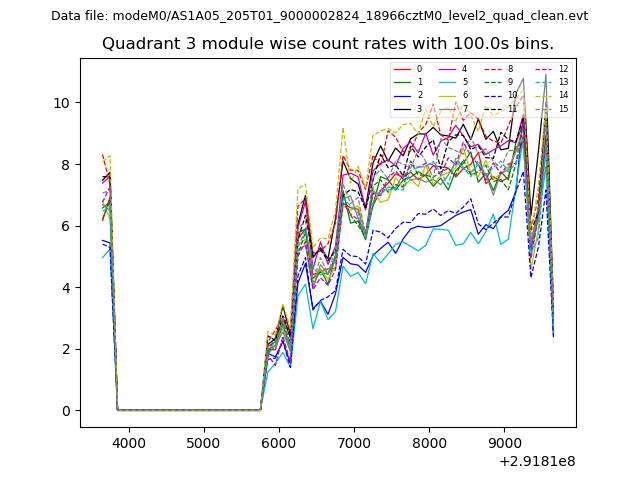
| Module-wise count rates for Quadrant A Data is divided into 100 sec bins |
 |
 |
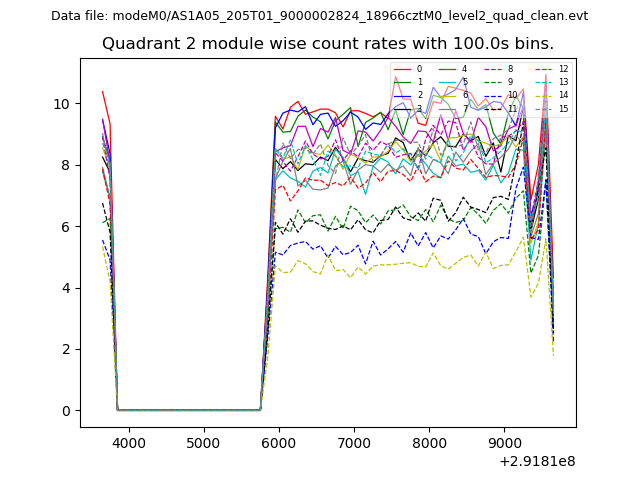
| Module-wise count rates for Quadrant B Data is divided into 100 sec bins |
 |
 |
| Module-wise count rates for Quadrant C Data is divided into 100 sec bins |
 |
 |
| Module-wise count rates for Quadrant D Data is divided into 100 sec bins |
 |
 |
| Parameter | Plot |
|---|---|
| CZT HV Monitor | 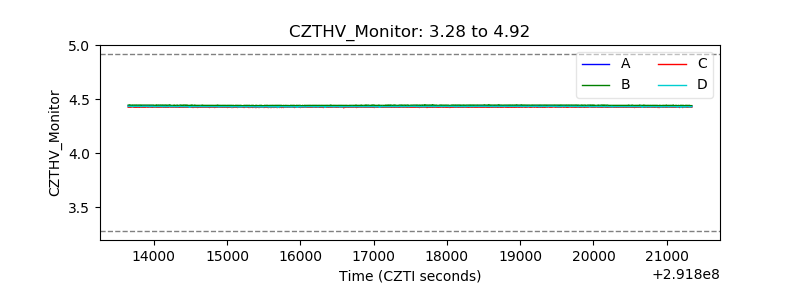 |
| D_VDD | 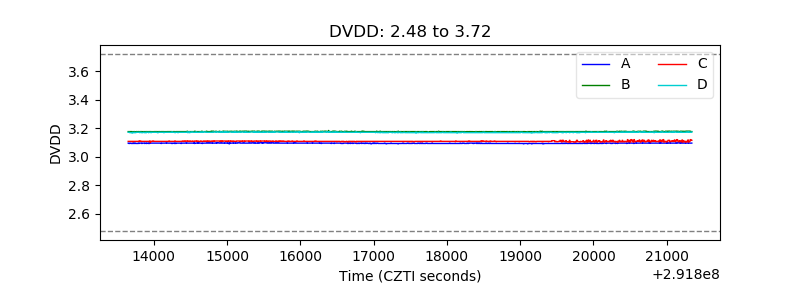 |
| Temperature 1 | 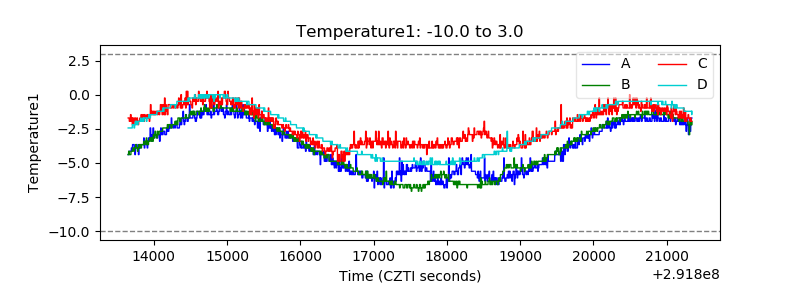 |
| Veto HV Monitor | 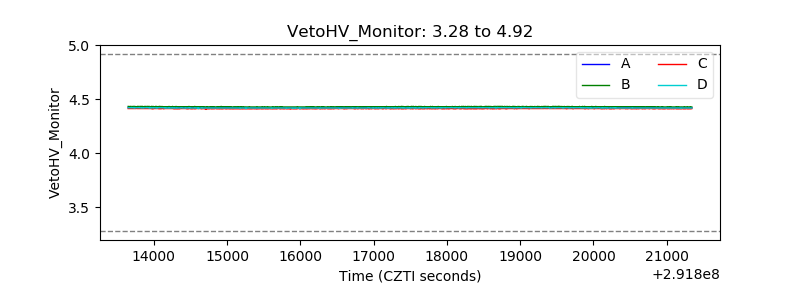 |
| Veto LLD |  |
| Alpha Counter | 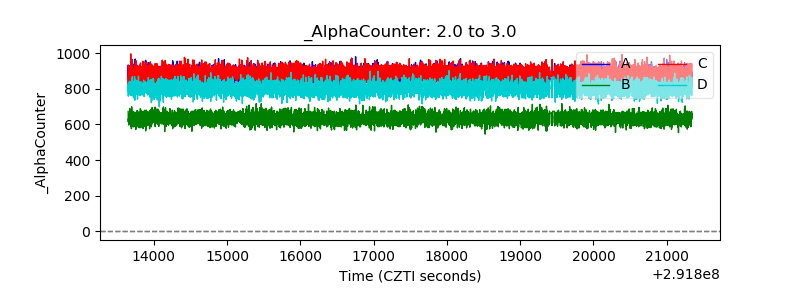 |
| _CPM_Rate |  |
| CZT Counter | 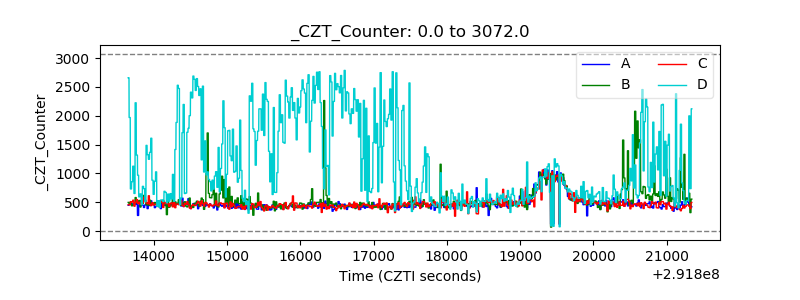 |
| +2.5 Volts monitor |  |
| +5 Volts monitor |  |
| _ROLL_ROT | 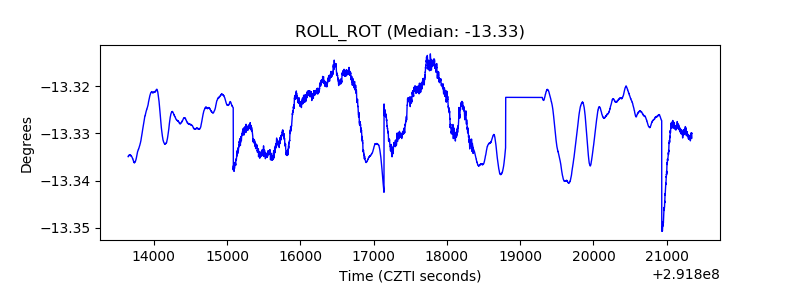 |
| _Roll_DEC | 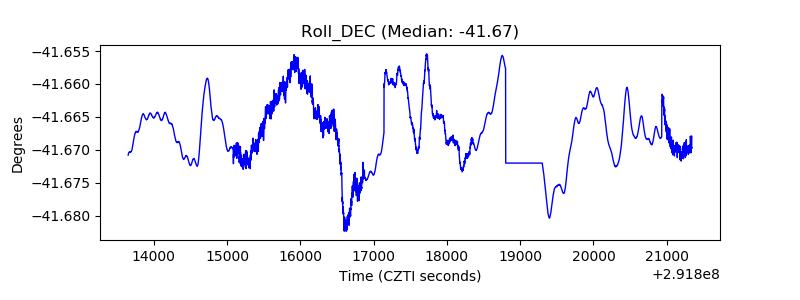 |
| _Roll_RA | 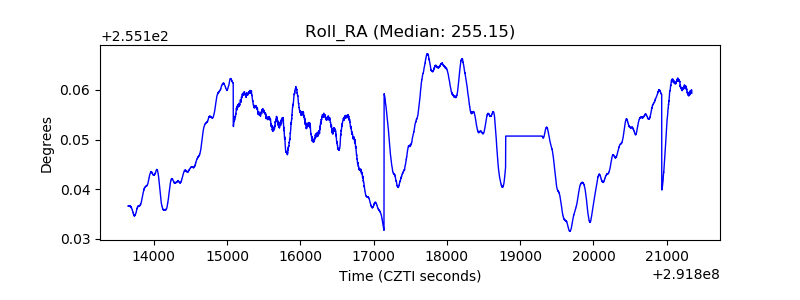 |
| Veto Counter |  |