| Param | Original file | Final file |
|---|---|---|
| Filename | modeM0/AS1A05_205T01_9000002824_18969cztM0_level2.evt | modeM0/AS1A05_205T01_9000002824_18969cztM0_level2_quad_clean.evt |
| Size (bytes) | 1,099,160,640 | 163,788,480 |
| Size | 1.0 GB | 156.2 MB |
| Events in quadrant A | 5,908,424 | 1,051,973 |
| Events in quadrant B | 6,552,622 | 1,063,280 |
| Events in quadrant C | 5,965,051 | 1,030,393 |
| Events in quadrant D | 13,999,468 | 932,000 |
| Mode M9 | |||
|---|---|---|---|
| Quadrant | BADHDUFLAG | Total packets | Discarded packets |
| A | 0 | 12 | 0 |
| B | 0 | 12 | 0 |
| C | 0 | 12 | 0 |
| D | 0 | 12 | 0 |
| Mode SS | |||
|---|---|---|---|
| Quadrant | BADHDUFLAG | Total packets | Discarded packets |
| A | 0 | 260 | 0 |
| B | 0 | 260 | 0 |
| C | 0 | 260 | 0 |
| D | 0 | 260 | 0 |
| Mode M0 | |||
|---|---|---|---|
| Quadrant | BADHDUFLAG | Total packets | Discarded packets |
| A | 0 | 26051 | 2 |
| B | 0 | 27658 | 2 |
| C | 0 | 25938 | 2 |
| D | 0 | 50442 | 2 |
| Quadrant | Total seconds | Saturated seconds | Saturation percentage |
|---|---|---|---|
| A | 12767 | 66 | 0.516958% |
| B | 12768 | 173 | 1.354950% |
| C | 12768 | 103 | 0.806704% |
| D | 12768 | 2292 | 17.951128% |
Noise dominated data is calculated using 1-second bins in cleaned event files. If a bin has >2000 counts, and if more than 50% of those come from <1% of pixels, then it is considered to be noise-dominated and hence unusable.
| Quadrant | # 1 sec bins | Bins with >0 counts | Bins with >2000 counts | High rate bins dominated by noise | Noise dominated (total time) | Noise dominated (detector-on time) | Marked lightcurve |
|---|---|---|---|---|---|---|---|
| A | 13947 | 12769 | 0 | 0 | 0.00% | 0.00% | 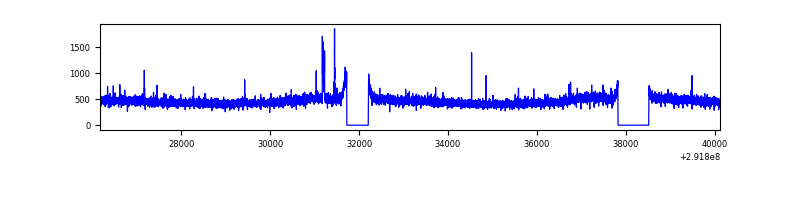 |
| B | 13948 | 12770 | 47 | 47 | 0.34% | 0.37% | 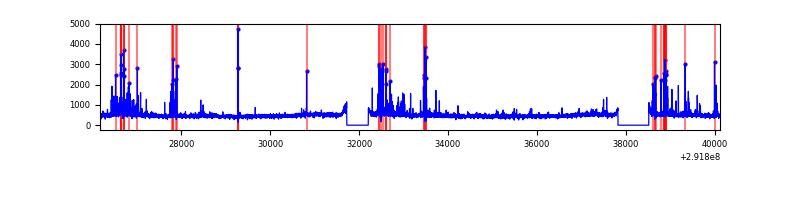 |
| C | 13948 | 12770 | 0 | 0 | 0.00% | 0.00% | 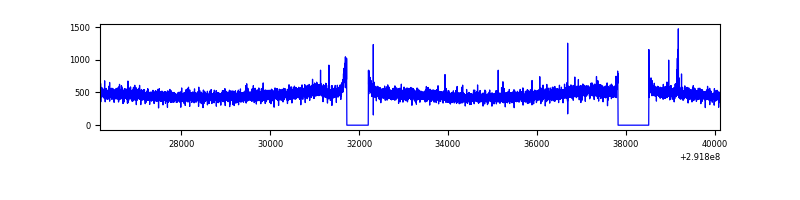 |
| D | 13948 | 12770 | 1847 | 1847 | 13.24% | 14.46% | 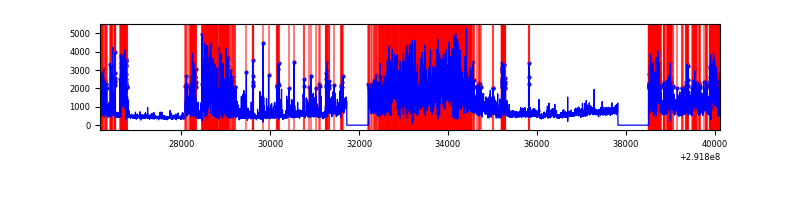 |
Top three noisy pixels from each quadrant. If the there are fewer than three noisy pixels in the level2.evt file, extra rows are filled as -1
| Pixel properties | Quadrant properties | ||||||
|---|---|---|---|---|---|---|---|
| Quadrant | DetID | PixID | Counts | Sigma | Mean | Median | Sigma |
| A | 14 | 235 | 48626 | 153.08 | 1520 | 1484 | 308.0 |
| A | 13 | 254 | 16107 | 47.48 | 1520 | 1484 | 308.0 |
| A | 0 | 226 | 13199 | 38.04 | 1520 | 1484 | 308.0 |
| B | 7 | 220 | 377025 | 1318.19 | 1509 | 1473 | 284.9 |
| B | 3 | 112 | 100022 | 345.91 | 1509 | 1473 | 284.9 |
| B | 0 | 197 | 38307 | 129.29 | 1509 | 1473 | 284.9 |
| C | 14 | 238 | 225503 | 652.75 | 1461 | 1470 | 343.2 |
| C | 3 | 233 | 21954 | 59.68 | 1461 | 1470 | 343.2 |
| C | 9 | 54 | 16685 | 44.33 | 1461 | 1470 | 343.2 |
| D | 12 | 218 | 2977757 | 8907.46 | 1362 | 1322 | 334.2 |
| D | 7 | 238 | 2937804 | 8787.9 | 1362 | 1322 | 334.2 |
| D | 1 | 52 | 1900293 | 5682.98 | 1362 | 1322 | 334.2 |
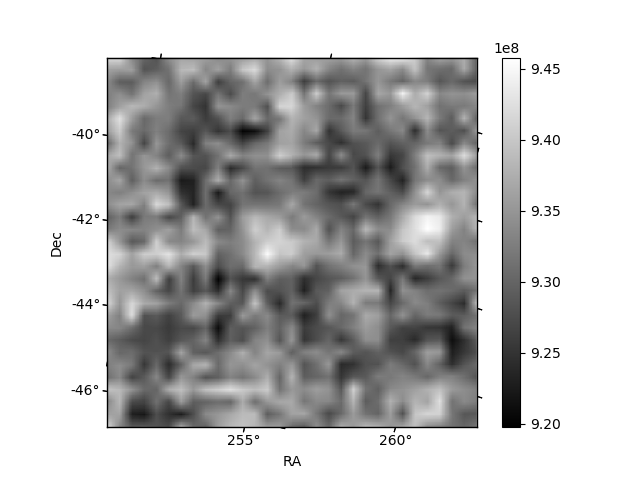
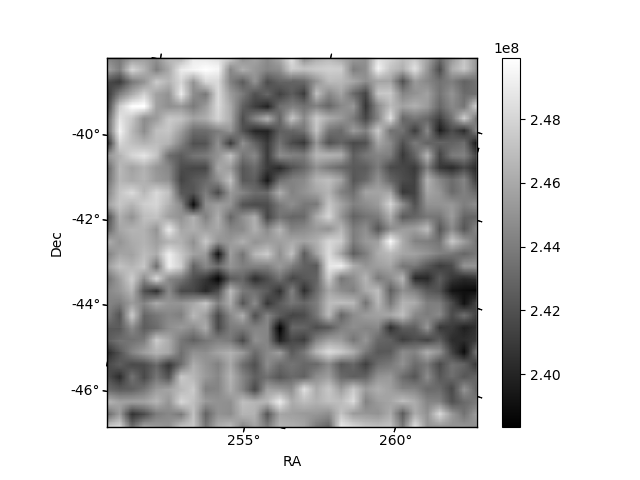
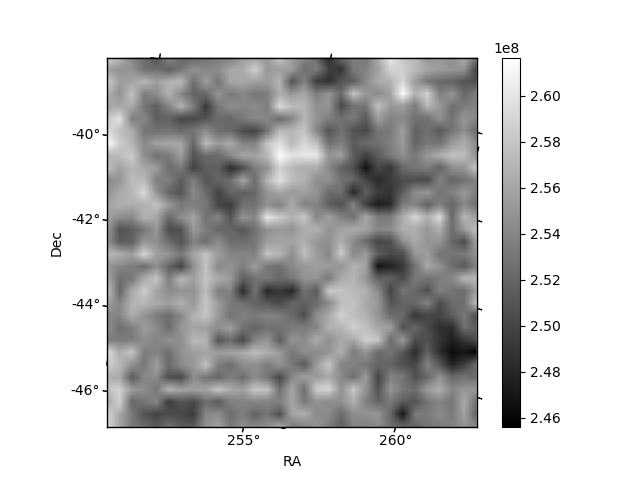
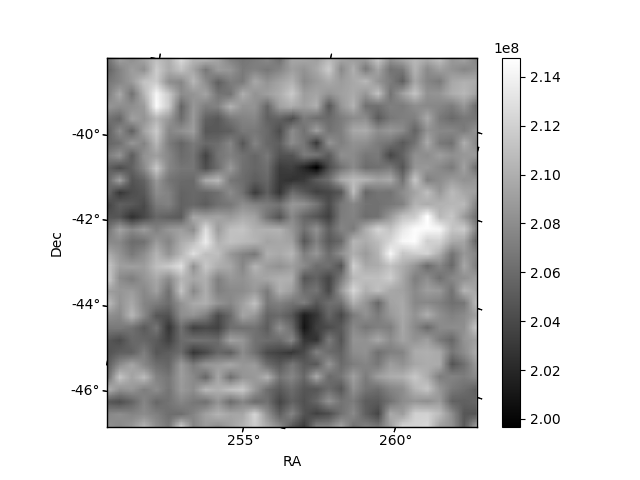
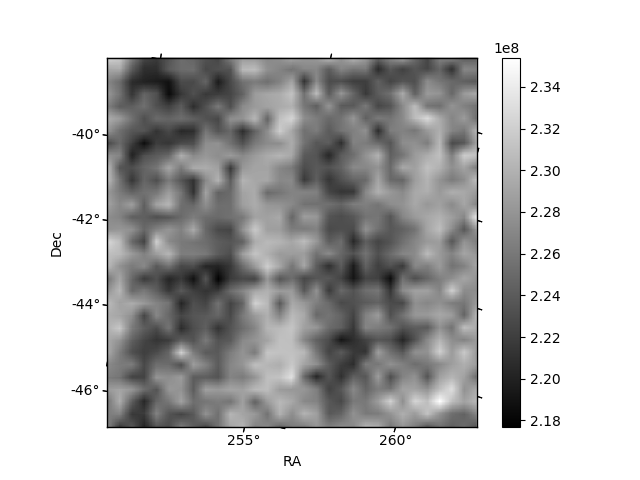
Histogram calculated using DETX and DETY for each event in the final _common_clean file
| Quadrant A | 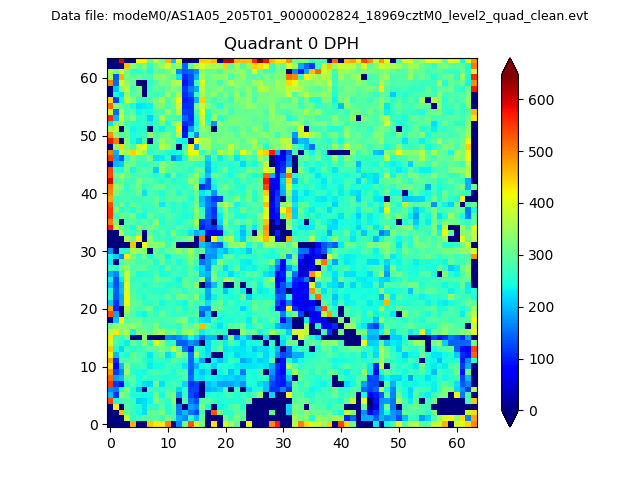 |
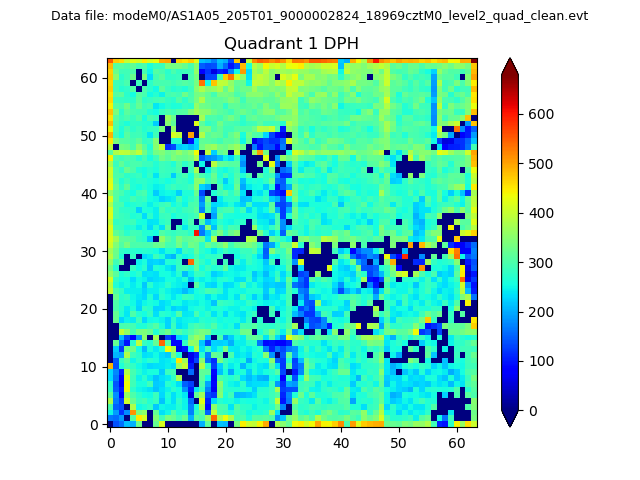 |
Quadrant B |
|---|---|---|---|
| Quadrant D | 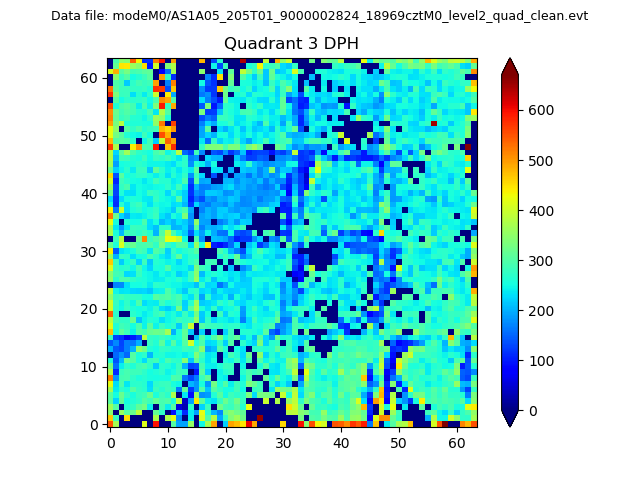 |
 |
Quadrant C |
| Plot type | Count rate plots | Images |
|---|---|---|
| Comparison with Poisson distribution Blue bars denote a histogram of data divided into 1 sec bins. Red curve is a Poisson curve with rate = median count rate of data. |
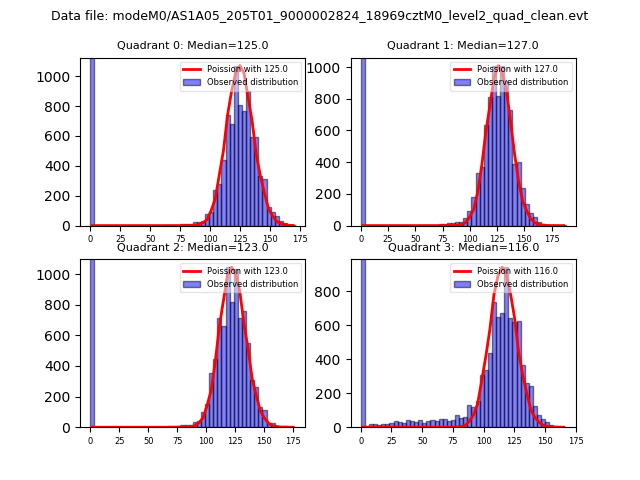 |
 |
| Quadrant-wise count rates Data is divided into 100 sec bins |
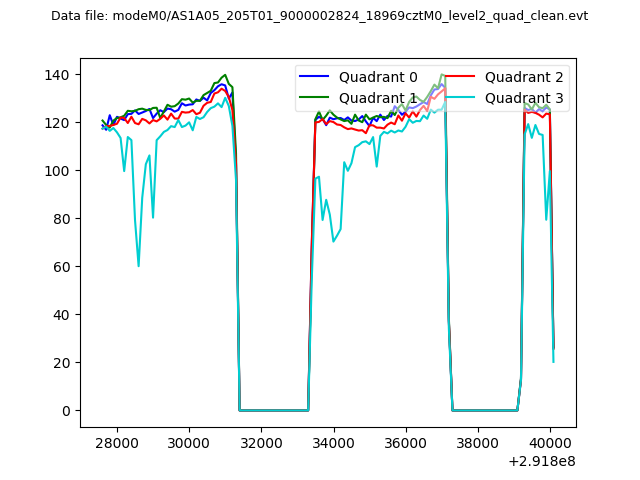 |
|
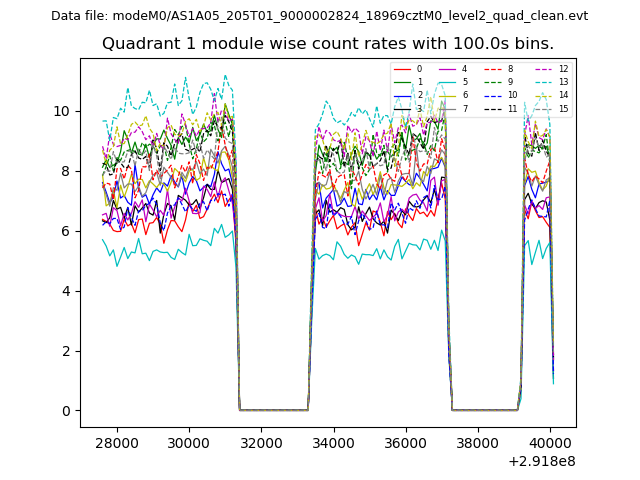
| Module-wise count rates for Quadrant A Data is divided into 100 sec bins |
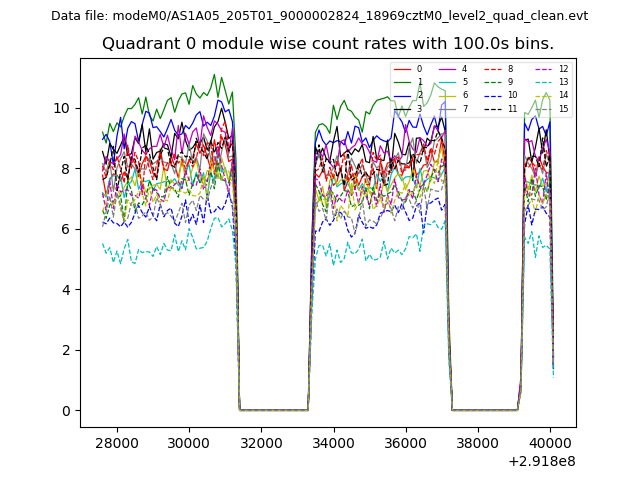 |
 |
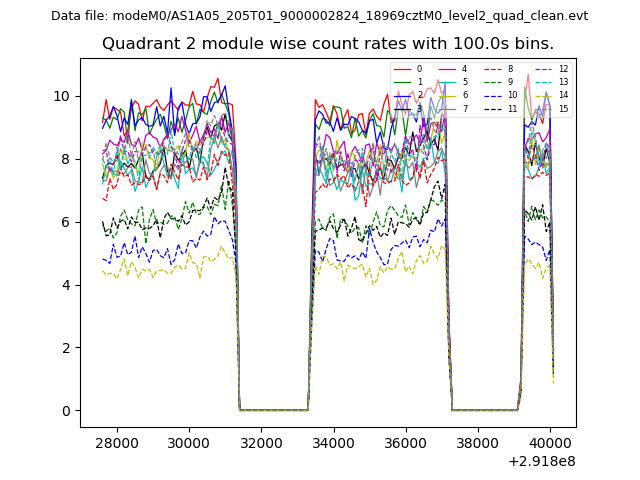
| Module-wise count rates for Quadrant B Data is divided into 100 sec bins |
 |
 |
| Module-wise count rates for Quadrant C Data is divided into 100 sec bins |
 |
 |
| Module-wise count rates for Quadrant D Data is divided into 100 sec bins |
 |
 |
| Parameter | Plot |
|---|---|
| CZT HV Monitor | 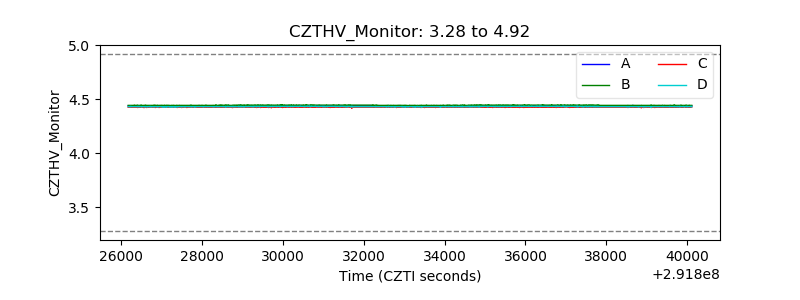 |
| D_VDD | 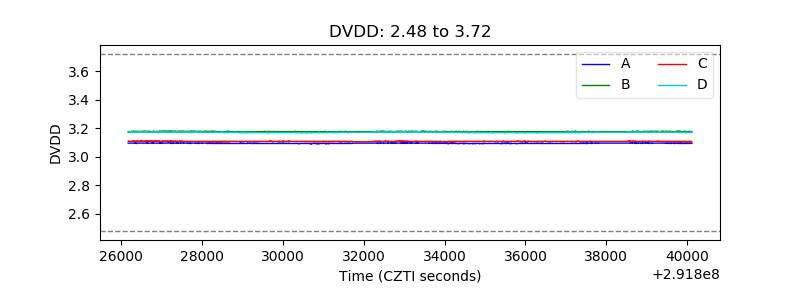 |
| Temperature 1 | 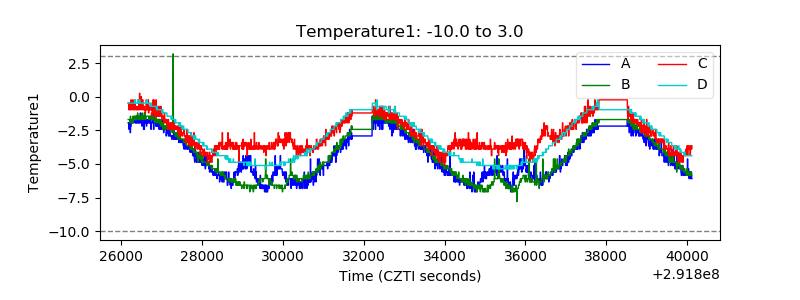 |
| Veto HV Monitor | 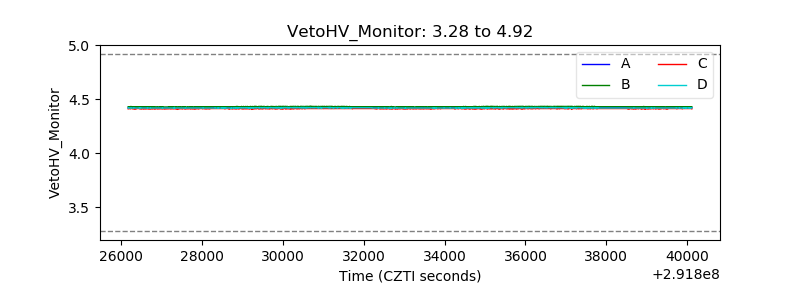 |
| Veto LLD | 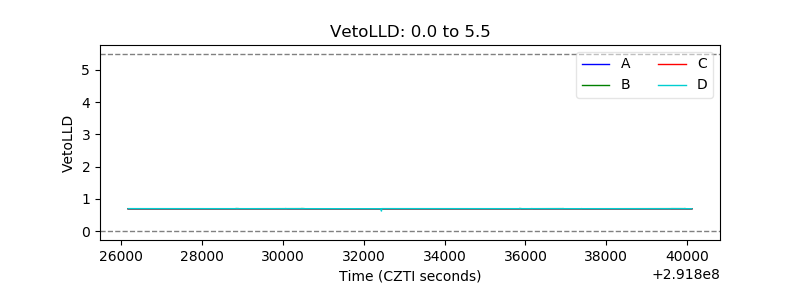 |
| Alpha Counter | 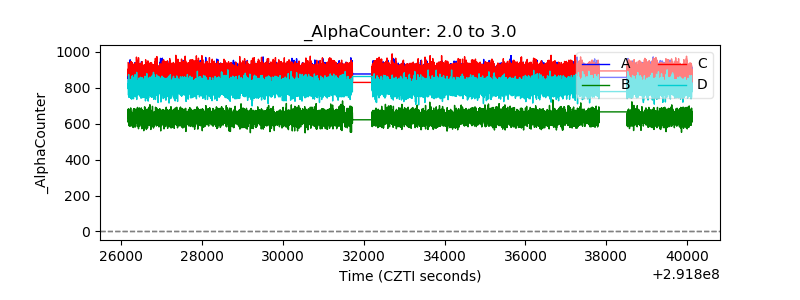 |
| _CPM_Rate | 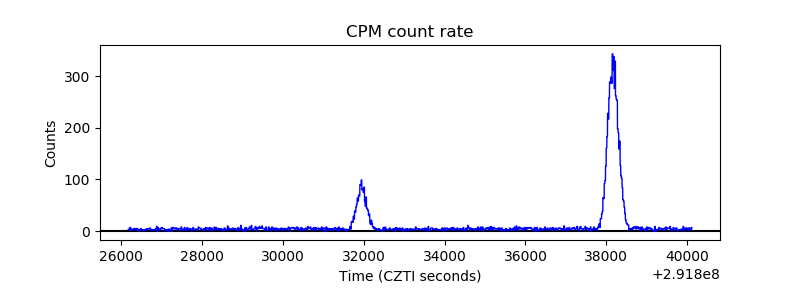 |
| CZT Counter |  |
| +2.5 Volts monitor |  |
| +5 Volts monitor | 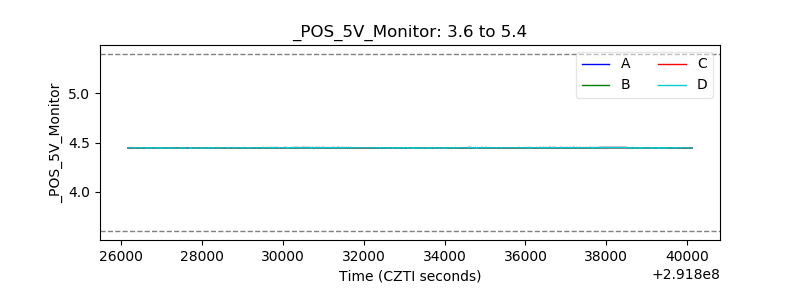 |
| _ROLL_ROT | 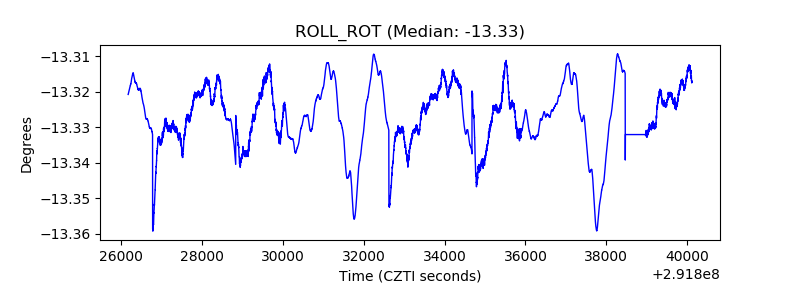 |
| _Roll_DEC | 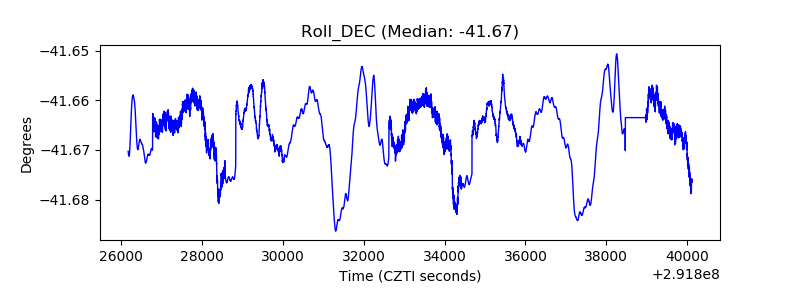 |
| _Roll_RA | 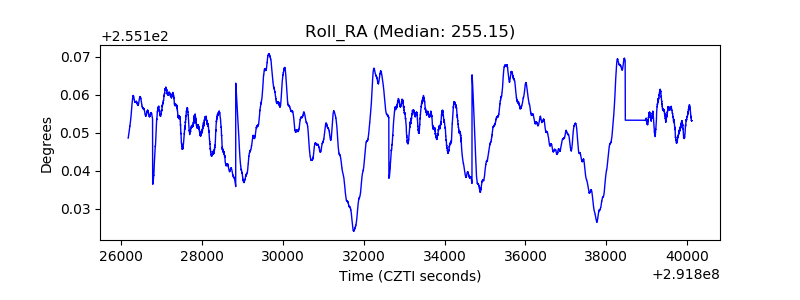 |
| Veto Counter | 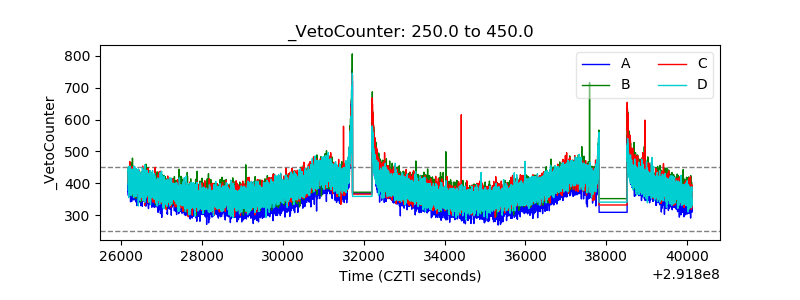 |