| Param | Original file | Final file |
|---|---|---|
| Filename | modeM0/AS1A05_205T01_9000002824_18970cztM0_level2.evt | modeM0/AS1A05_205T01_9000002824_18970cztM0_level2_quad_clean.evt |
| Size (bytes) | 583,416,000 | 94,792,320 |
| Size | 556.4 MB | 90.4 MB |
| Events in quadrant A | 3,249,040 | 615,558 |
| Events in quadrant B | 3,515,177 | 619,958 |
| Events in quadrant C | 3,292,339 | 600,450 |
| Events in quadrant D | 7,145,085 | 554,213 |
| Mode M9 | |||
|---|---|---|---|
| Quadrant | BADHDUFLAG | Total packets | Discarded packets |
| A | 0 | 11 | 0 |
| B | 0 | 12 | 0 |
| C | 0 | 12 | 0 |
| D | 0 | 12 | 0 |
| Mode SS | |||
|---|---|---|---|
| Quadrant | BADHDUFLAG | Total packets | Discarded packets |
| A | 0 | 140 | 0 |
| B | 0 | 140 | 0 |
| C | 0 | 140 | 0 |
| D | 0 | 140 | 0 |
| Mode M0 | |||
|---|---|---|---|
| Quadrant | BADHDUFLAG | Total packets | Discarded packets |
| A | 0 | 14081 | 3 |
| B | 0 | 14852 | 2 |
| C | 0 | 14142 | 2 |
| D | 0 | 25972 | 2 |
| Quadrant | Total seconds | Saturated seconds | Saturation percentage |
|---|---|---|---|
| A | 6893 | 49 | 0.710866% |
| B | 6893 | 106 | 1.537792% |
| C | 6893 | 76 | 1.102568% |
| D | 6893 | 1015 | 14.725083% |
Noise dominated data is calculated using 1-second bins in cleaned event files. If a bin has >2000 counts, and if more than 50% of those come from <1% of pixels, then it is considered to be noise-dominated and hence unusable.
| Quadrant | # 1 sec bins | Bins with >0 counts | Bins with >2000 counts | High rate bins dominated by noise | Noise dominated (total time) | Noise dominated (detector-on time) | Marked lightcurve |
|---|---|---|---|---|---|---|---|
| A | 7728 | 6894 | 0 | 0 | 0.00% | 0.00% |  |
| B | 7728 | 6894 | 22 | 22 | 0.28% | 0.32% | 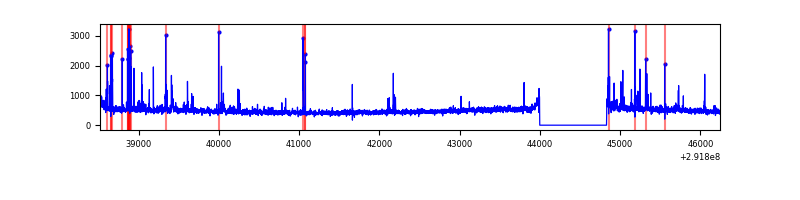 |
| C | 7728 | 6894 | 8 | 8 | 0.10% | 0.12% | 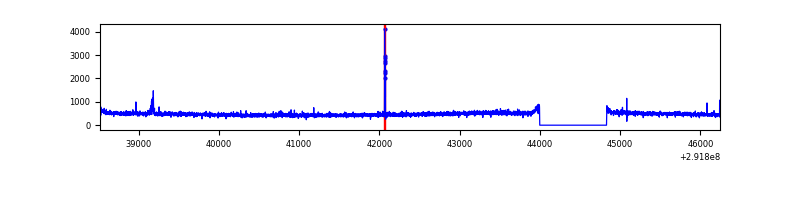 |
| D | 7728 | 6894 | 775 | 775 | 10.03% | 11.24% | 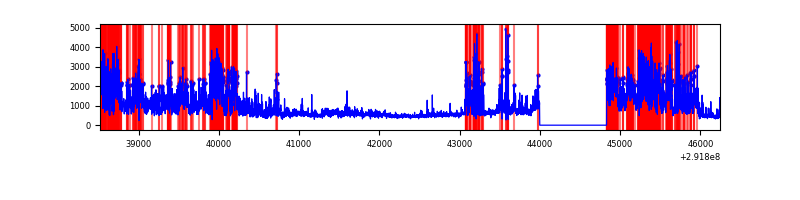 |
Top three noisy pixels from each quadrant. If the there are fewer than three noisy pixels in the level2.evt file, extra rows are filled as -1
| Pixel properties | Quadrant properties | ||||||
|---|---|---|---|---|---|---|---|
| Quadrant | DetID | PixID | Counts | Sigma | Mean | Median | Sigma |
| A | 6 | 16 | 47536 | 275.68 | 831 | 812 | 169.5 |
| A | 13 | 254 | 7433 | 39.07 | 831 | 812 | 169.5 |
| A | 0 | 226 | 7319 | 38.39 | 831 | 812 | 169.5 |
| B | 7 | 220 | 103940 | 647.32 | 828 | 807 | 159.3 |
| B | 3 | 112 | 37999 | 233.44 | 828 | 807 | 159.3 |
| B | 3 | 64 | 33060 | 202.44 | 828 | 807 | 159.3 |
| C | 14 | 238 | 122757 | 651.12 | 797 | 803 | 187.3 |
| C | 0 | 207 | 27548 | 142.79 | 797 | 803 | 187.3 |
| C | 9 | 54 | 15518 | 78.56 | 797 | 803 | 187.3 |
| D | 12 | 218 | 2495089 | 13371.27 | 759 | 738 | 186.5 |
| D | 7 | 238 | 1156773 | 6197.06 | 759 | 738 | 186.5 |
| D | 1 | 52 | 582890 | 3120.7 | 759 | 738 | 186.5 |
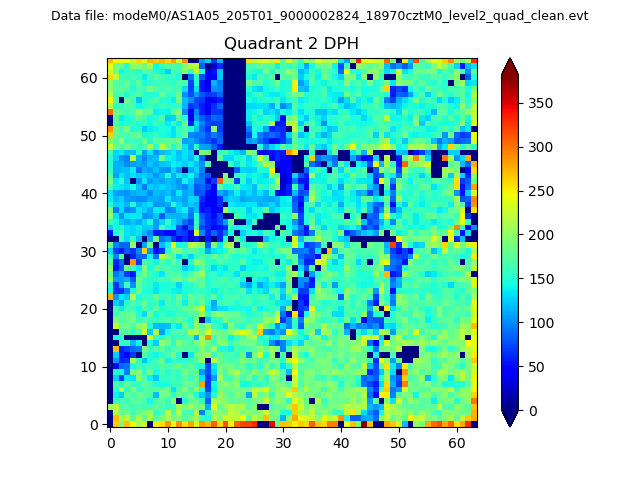
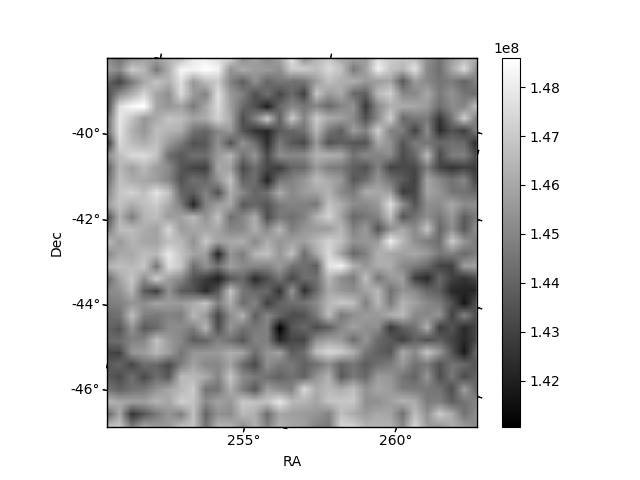
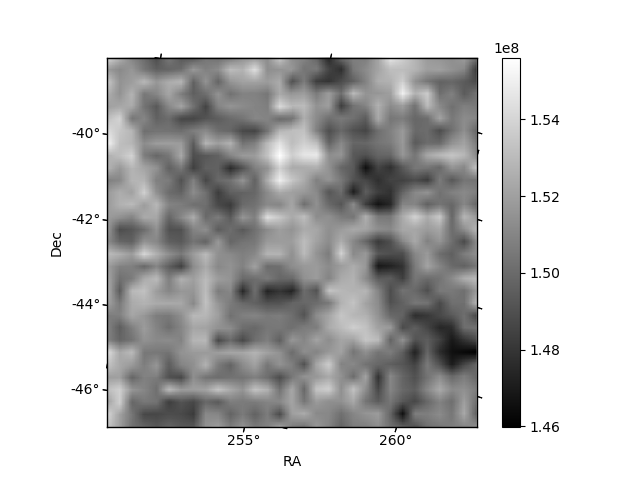
Histogram calculated using DETX and DETY for each event in the final _common_clean file
| Quadrant A | 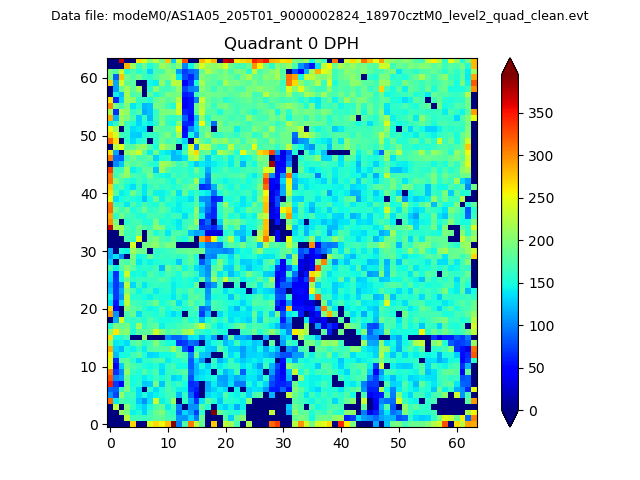 |
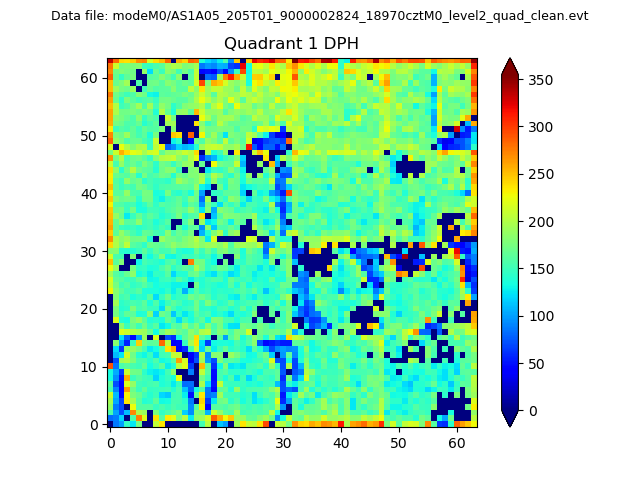 |
Quadrant B |
|---|---|---|---|
| Quadrant D | 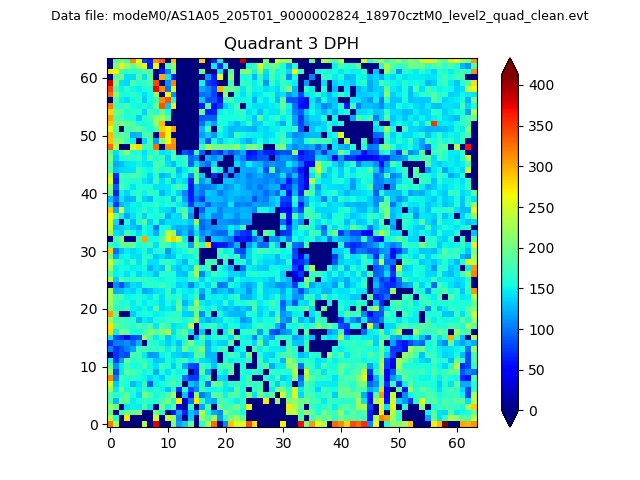 |
 |
Quadrant C |
| Plot type | Count rate plots | Images |
|---|---|---|
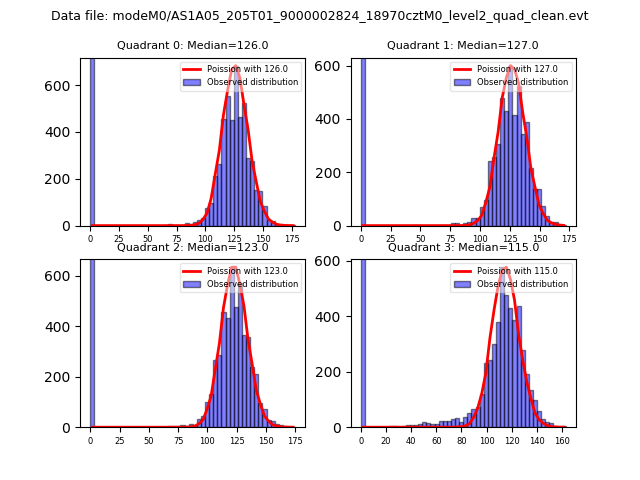
| Comparison with Poisson distribution Blue bars denote a histogram of data divided into 1 sec bins. Red curve is a Poisson curve with rate = median count rate of data. |
 |
 |
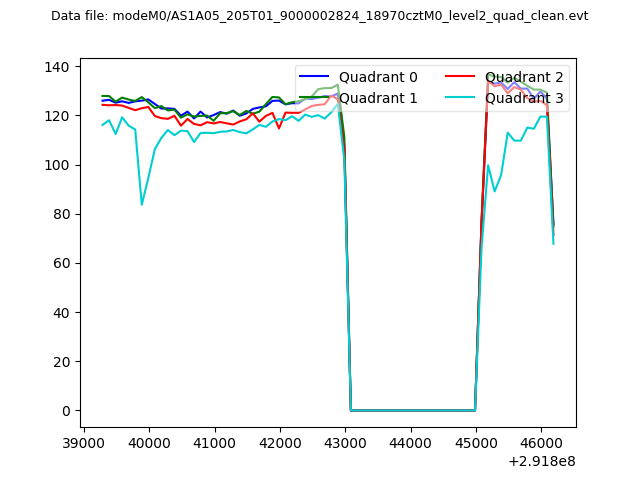
| Quadrant-wise count rates Data is divided into 100 sec bins |
 |
|
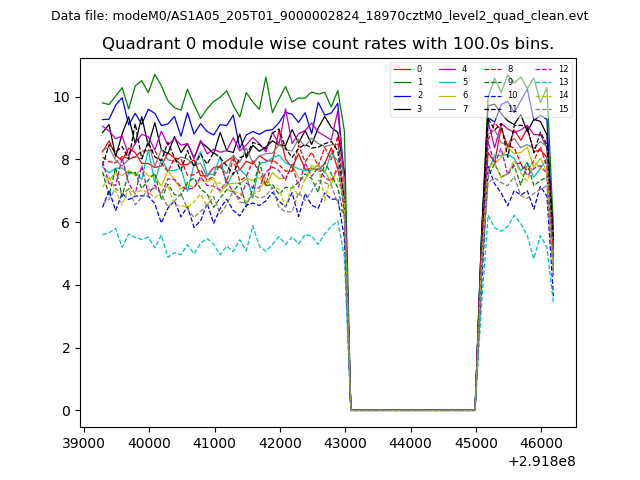
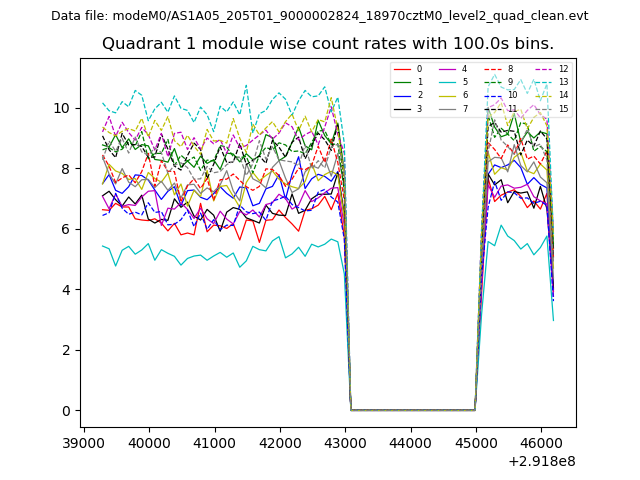
| Module-wise count rates for Quadrant A Data is divided into 100 sec bins |
 |
 |
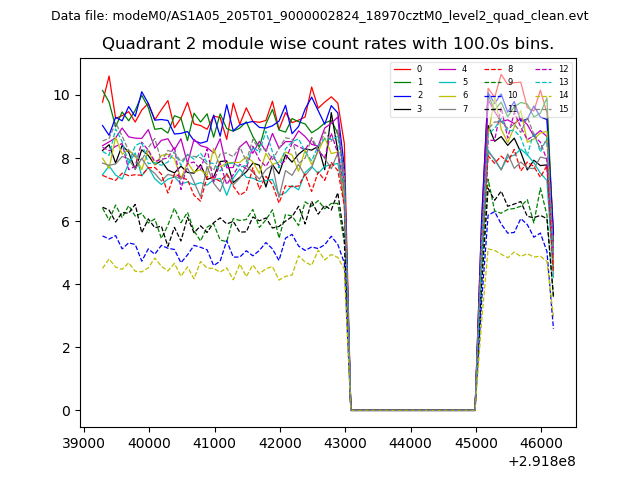
| Module-wise count rates for Quadrant B Data is divided into 100 sec bins |
 |
 |
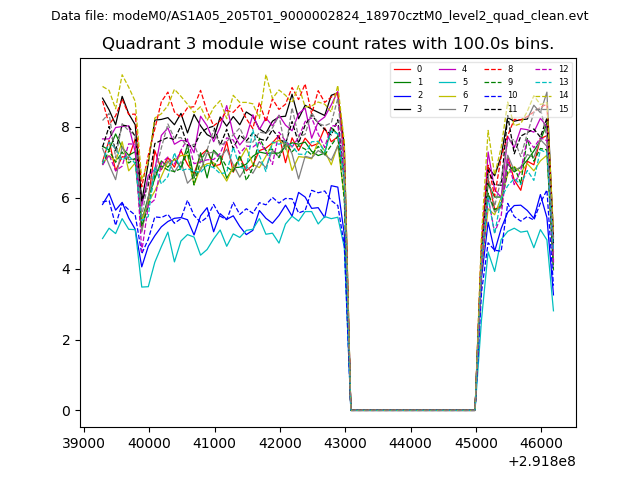
| Module-wise count rates for Quadrant C Data is divided into 100 sec bins |
 |
 |
| Module-wise count rates for Quadrant D Data is divided into 100 sec bins |
 |
 |
| Parameter | Plot |
|---|---|
| CZT HV Monitor | 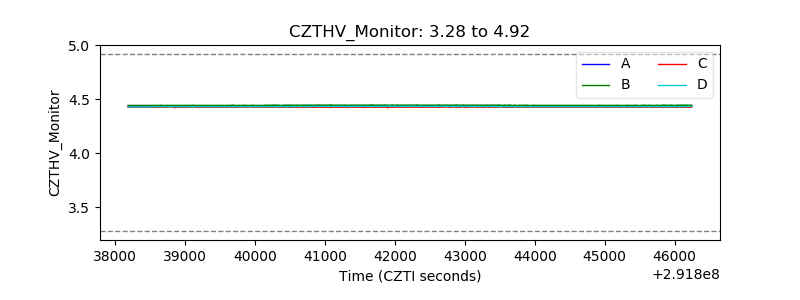 |
| D_VDD | 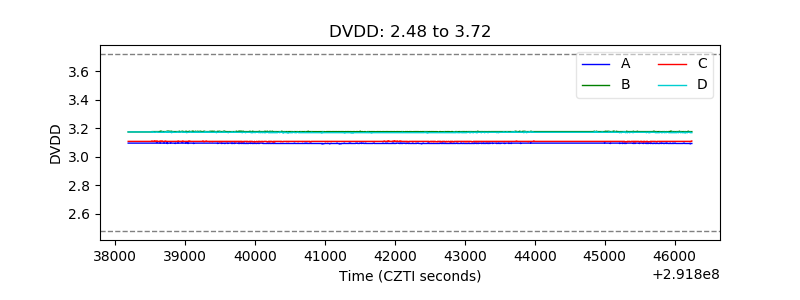 |
| Temperature 1 | 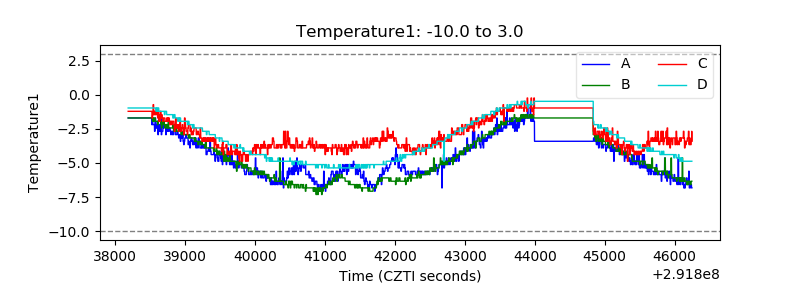 |
| Veto HV Monitor | 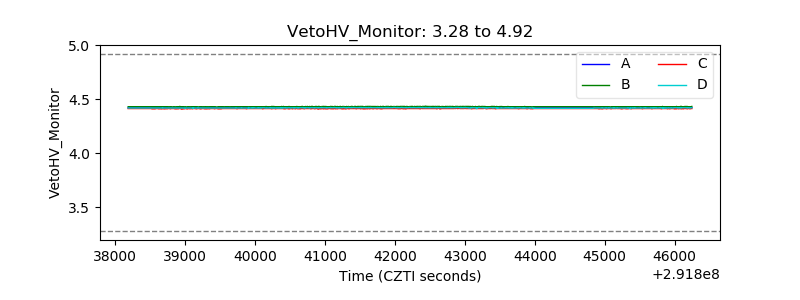 |
| Veto LLD | 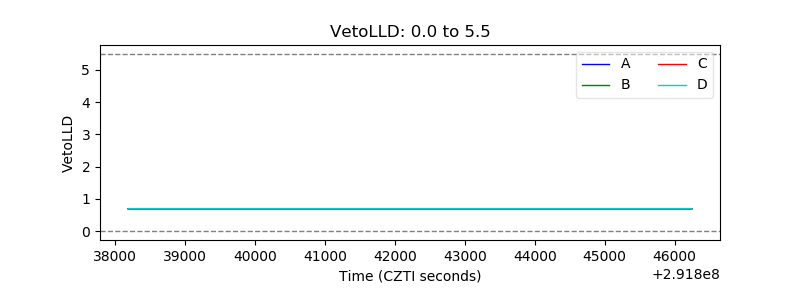 |
| Alpha Counter | 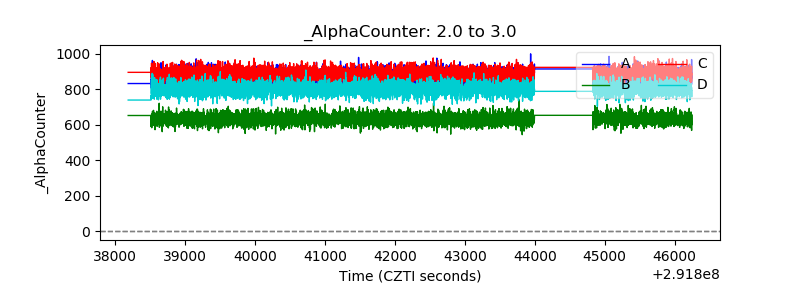 |
| _CPM_Rate | 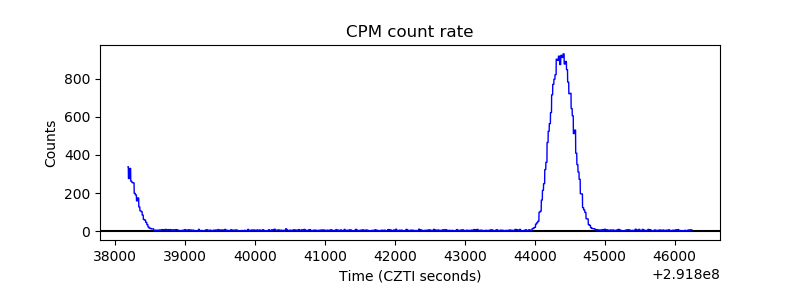 |
| CZT Counter | 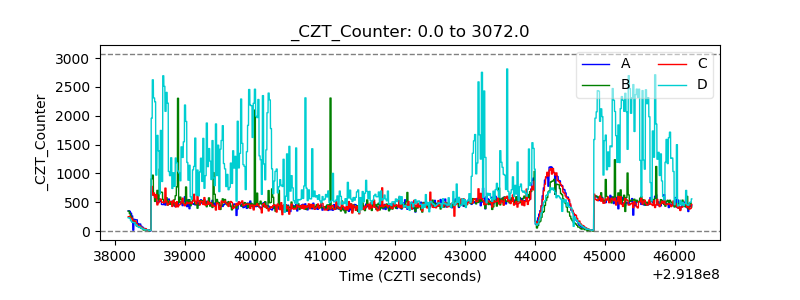 |
| +2.5 Volts monitor |  |
| +5 Volts monitor |  |
| _ROLL_ROT | 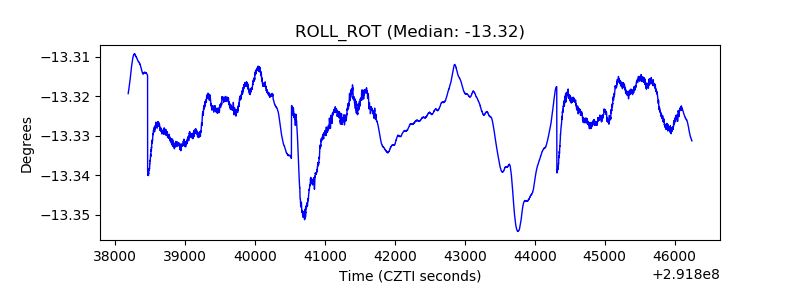 |
| _Roll_DEC |  |
| _Roll_RA | 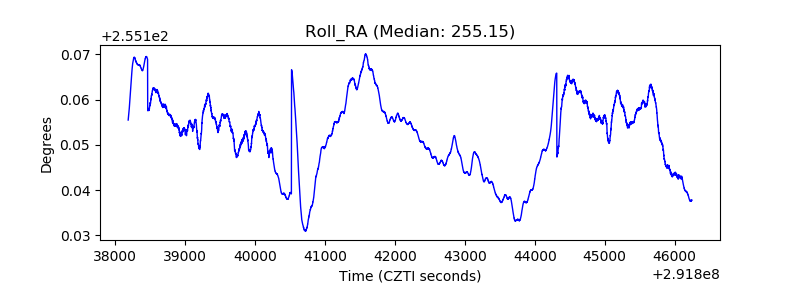 |
| Veto Counter | 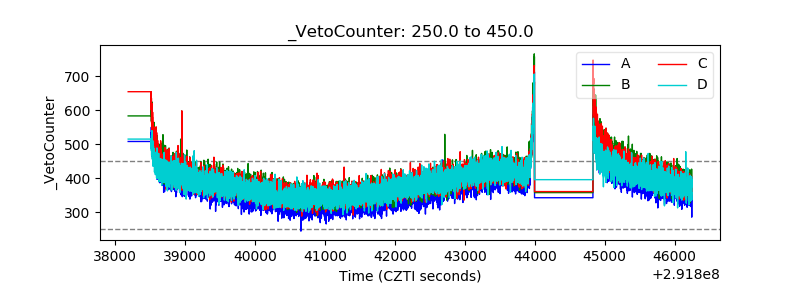 |