| Param | Original file | Final file |
|---|---|---|
| Filename | modeM0/AS1A05_166T04_9000002826cztM0_level2.fits | modeM0/AS1A05_166T04_9000002826cztM0_level2_quad_clean.evt |
| Size (bytes) | 584,455,680 | 417,058,560 |
| Size | 557.4 MB | 397.7 MB |
| Events in quadrant A | 3,654,506 | 2,252,815 |
| Events in quadrant B | 3,425,114 | 2,241,837 |
| Events in quadrant C | 3,568,236 | 2,174,447 |
| Events in quadrant D | 2,997,102 | 1,907,274 |
| Mode SS | |||
|---|---|---|---|
| Quadrant | BADHDUFLAG | Total packets | Discarded packets |
| A | 0 | 1204 | 0 |
| B | 0 | 1204 | 0 |
| C | 0 | 1204 | 0 |
| D | 0 | 1204 | 0 |
| Mode M9 | |||
|---|---|---|---|
| Quadrant | BADHDUFLAG | Total packets | Discarded packets |
| A | 0 | 92 | 0 |
| B | 0 | 92 | 0 |
| C | 0 | 92 | 0 |
| D | 0 | 92 | 0 |
| Mode M0 | |||
|---|---|---|---|
| Quadrant | BADHDUFLAG | Total packets | Discarded packets |
| A | 0 | 122977 | 0 |
| B | 0 | 150206 | 0 |
| C | 0 | 127616 | 0 |
| D | 0 | 204917 | 0 |
| Quadrant | Total seconds | Saturated seconds | Saturation percentage |
|---|---|---|---|
| A | 59065 | 900 | 1.523745% |
| B | 59065 | 3149 | 5.331415% |
| C | 59065 | 1287 | 2.178955% |
| D | 59064 | 5773 | 9.774143% |
Noise dominated data is calculated using 1-second bins in cleaned event files. If a bin has >2000 counts, and if more than 50% of those come from <1% of pixels, then it is considered to be noise-dominated and hence unusable.
| Quadrant | # 1 sec bins | Bins with >0 counts | Bins with >2000 counts | High rate bins dominated by noise | Noise dominated (total time) | Noise dominated (detector-on time) | Marked lightcurve |
|---|---|---|---|---|---|---|---|
| A | 68310 | 59065 | 0 | 0 | 0.00% | 0.00% | 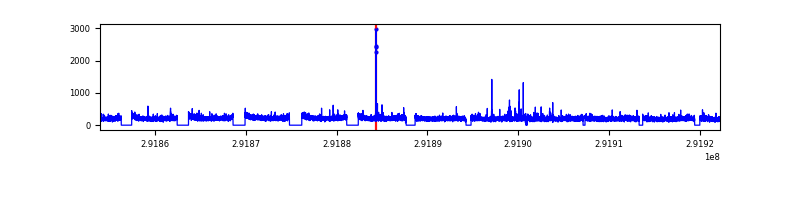 |
| B | 68310 | 59029 | 0 | 0 | 0.00% | 0.00% | 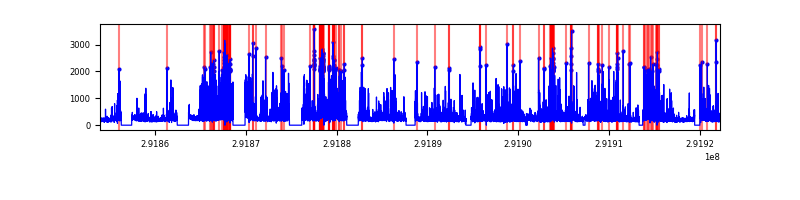 |
| C | 68310 | 59065 | 0 | 0 | 0.00% | 0.00% | 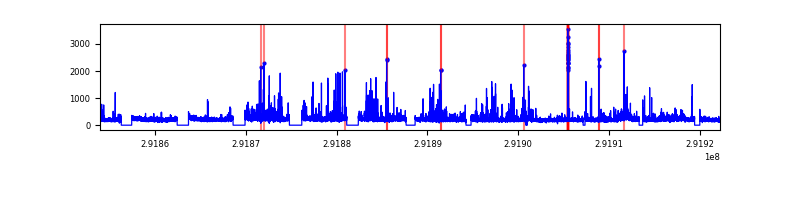 |
| D | 68310 | 59034 | 0 | 0 | 0.00% | 0.00% | 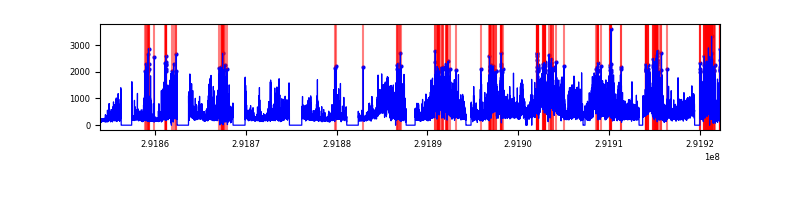 |
Top three noisy pixels from each quadrant. If the there are fewer than three noisy pixels in the level2.evt file, extra rows are filled as -1
| Pixel properties | Quadrant properties | ||||||
|---|---|---|---|---|---|---|---|
| Quadrant | DetID | PixID | Counts | Sigma | Mean | Median | Sigma |
| A | 0 | 29 | 3396 | 10.7 | 950 | 889 | 234.2 |
| A | 7 | 110 | 2901 | 8.59 | 950 | 889 | 234.2 |
| A | 15 | 236 | 2666 | 7.59 | 950 | 889 | 234.2 |
| B | 2 | 9 | 2690 | 10.17 | 905 | 861 | 179.9 |
| B | 2 | 8 | 2361 | 8.34 | 905 | 861 | 179.9 |
| B | 3 | 17 | 2305 | 8.03 | 905 | 861 | 179.9 |
| C | 1 | 81 | 2713 | 7.53 | 942 | 880 | 243.4 |
| C | 1 | 80 | 2691 | 7.44 | 942 | 880 | 243.4 |
| C | 3 | 126 | 2500 | 6.65 | 942 | 880 | 243.4 |
| D | 10 | 190 | 2341 | 6.9 | 856 | 780 | 226.2 |
| D | 7 | 3 | 2142 | 6.02 | 856 | 780 | 226.2 |
| D | 3 | 14 | 2112 | 5.89 | 856 | 780 | 226.2 |
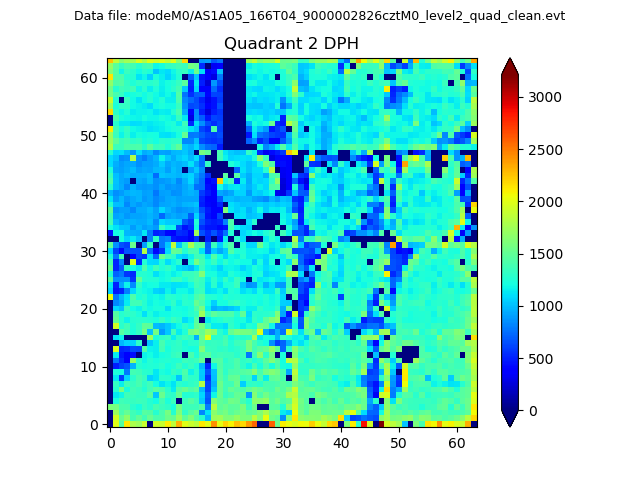
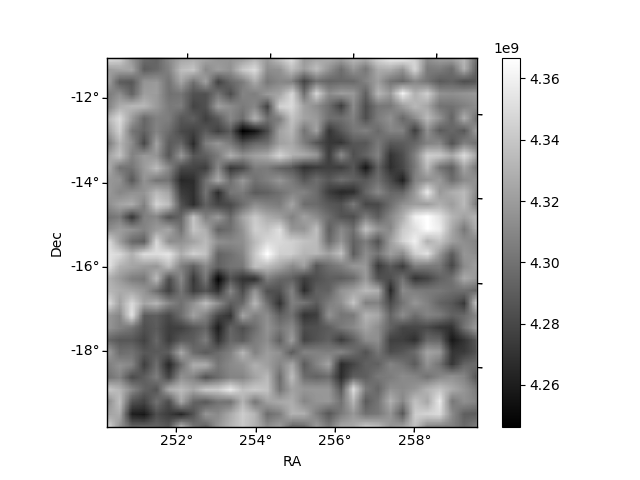
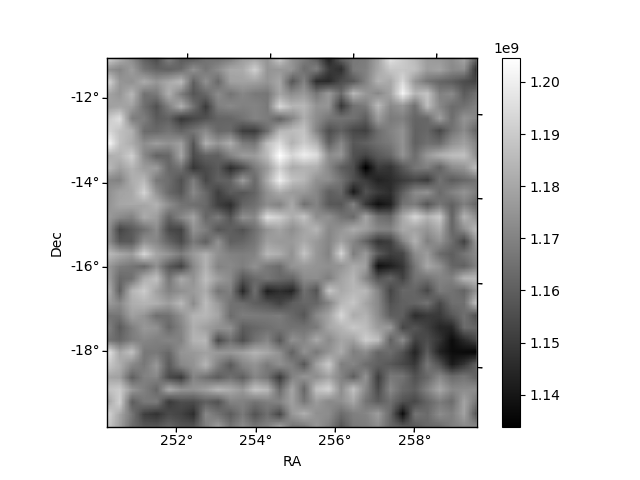
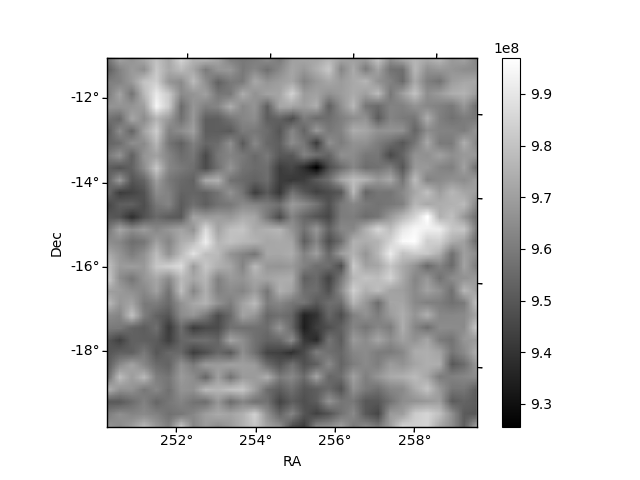
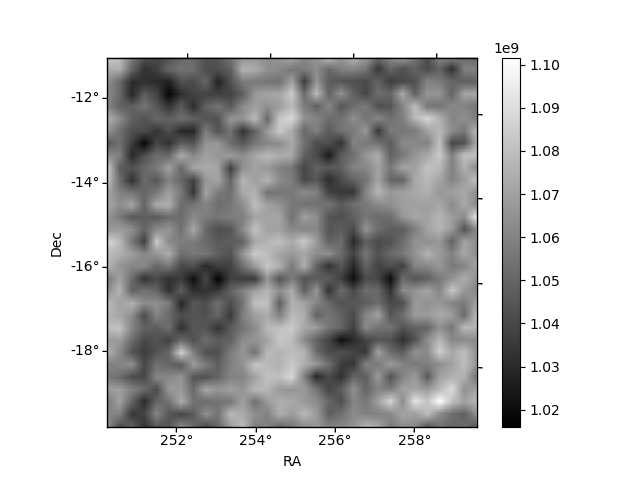
Histogram calculated using DETX and DETY for each event in the final _common_clean file
| Quadrant A | 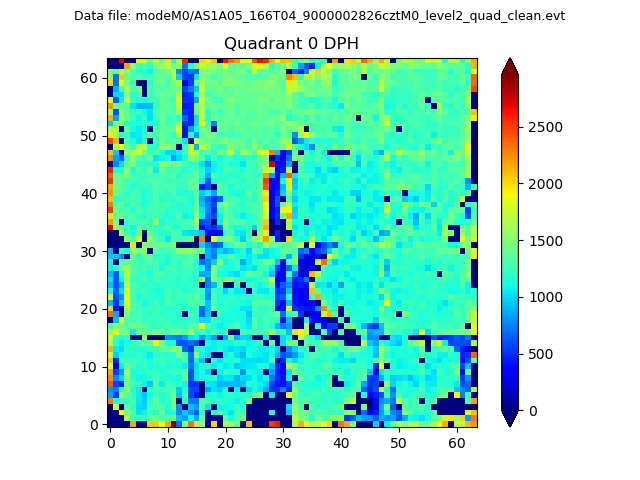 |
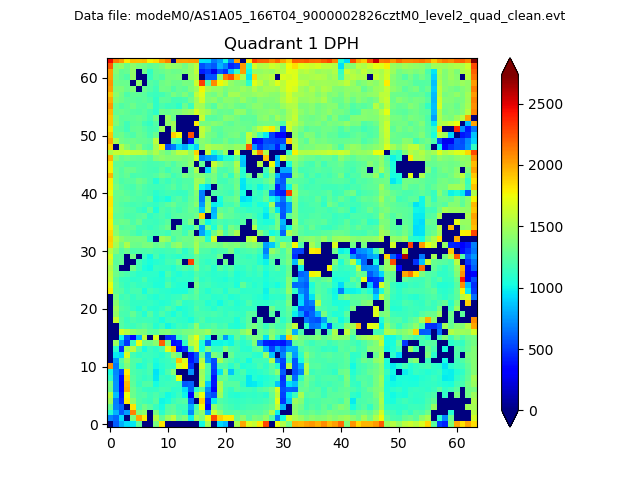 |
Quadrant B |
|---|---|---|---|
| Quadrant D | 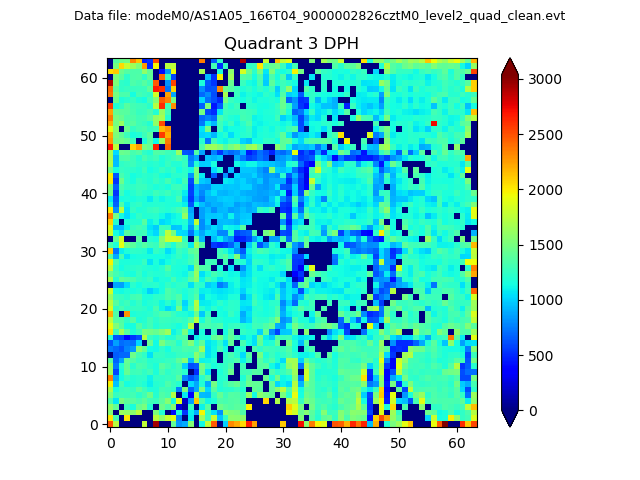 |
 |
Quadrant C |
| Plot type | Count rate plots | Images |
|---|---|---|
| Comparison with Poisson distribution Blue bars denote a histogram of data divided into 1 sec bins. Red curve is a Poisson curve with rate = median count rate of data. |
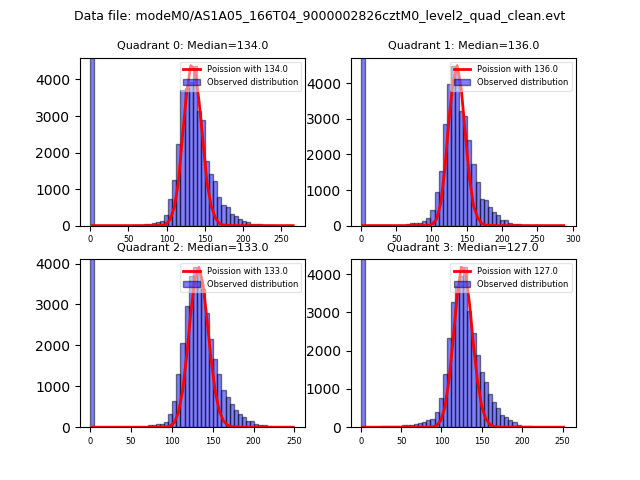 |
 |
| Quadrant-wise count rates Data is divided into 100 sec bins |
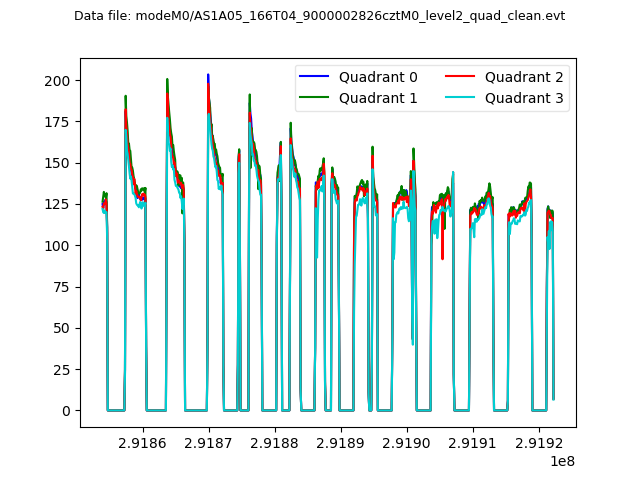 |
|
| Module-wise count rates for Quadrant A Data is divided into 100 sec bins |
 |
 |
| Module-wise count rates for Quadrant B Data is divided into 100 sec bins |
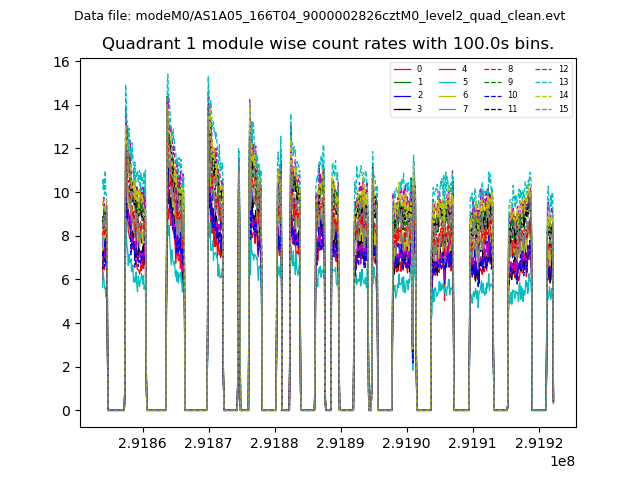 |
 |
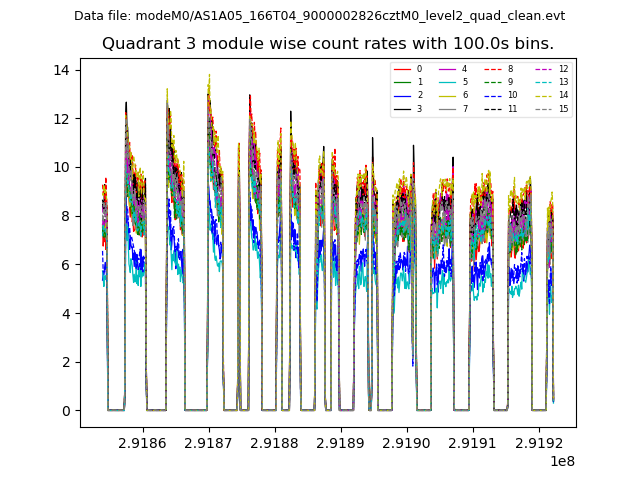
| Module-wise count rates for Quadrant C Data is divided into 100 sec bins |
 |
 |
| Module-wise count rates for Quadrant D Data is divided into 100 sec bins |
 |
 |
| Parameter | Plot |
|---|---|
| CZT HV Monitor |  |
| D_VDD | 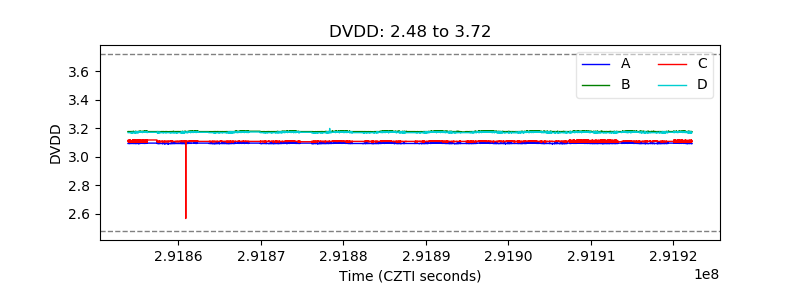 |
| Temperature 1 | 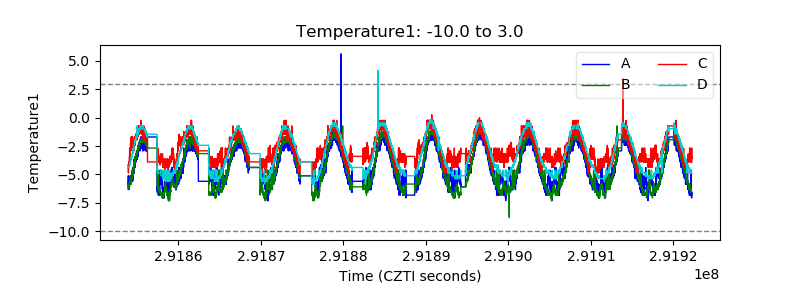 |
| Veto HV Monitor |  |
| Veto LLD | 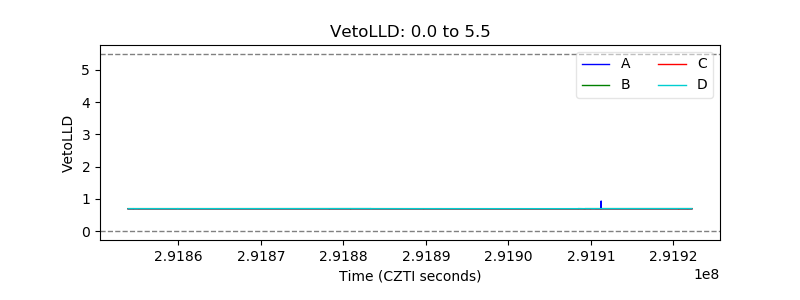 |
| Alpha Counter | 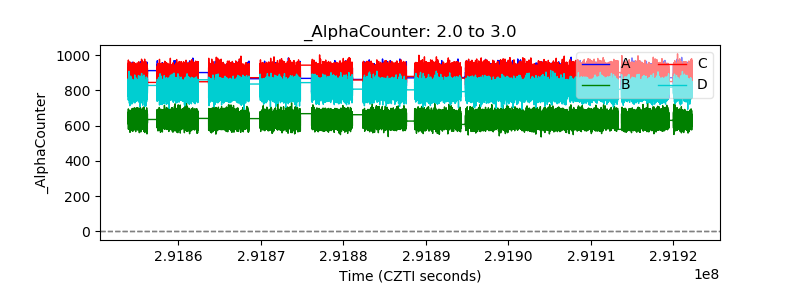 |
| _CPM_Rate | 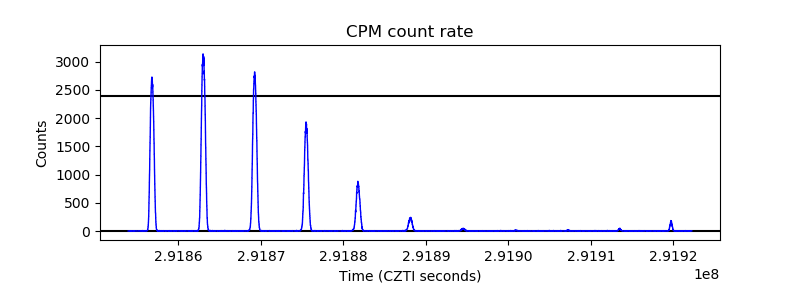 |
| CZT Counter | 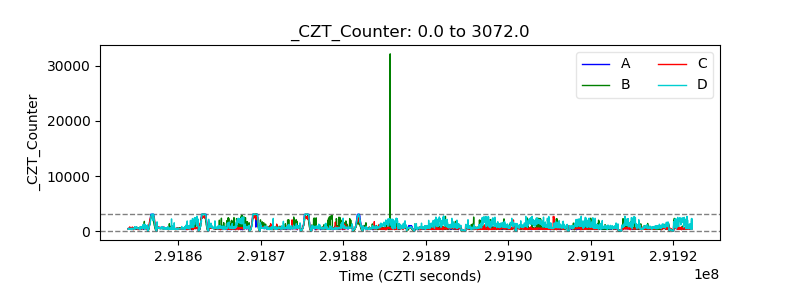 |
| +2.5 Volts monitor | 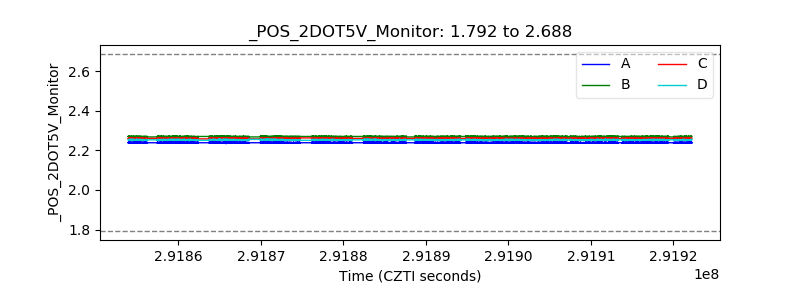 |
| +5 Volts monitor | 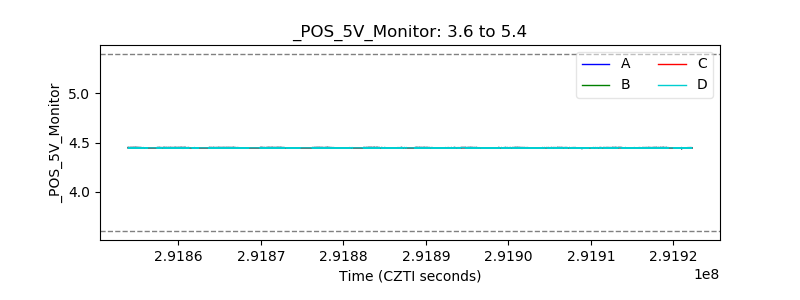 |
| _ROLL_ROT | 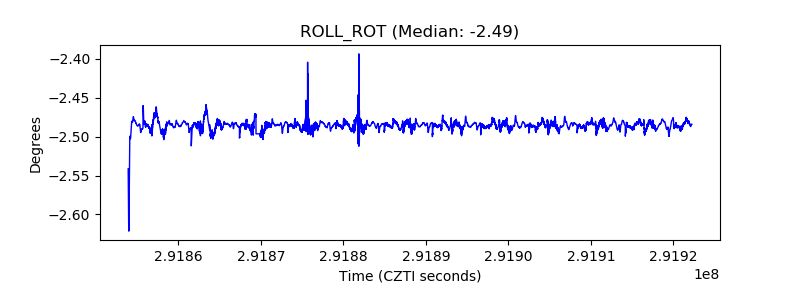 |
| _Roll_DEC | 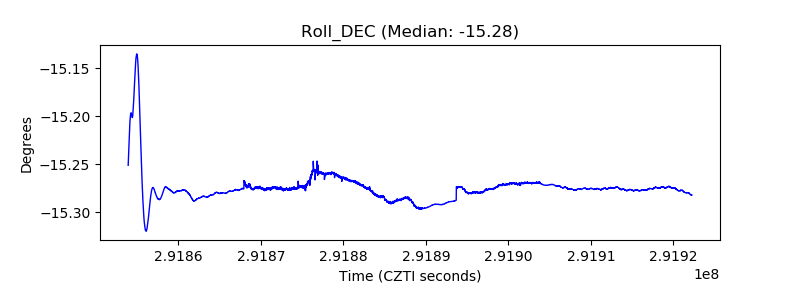 |
| _Roll_RA | 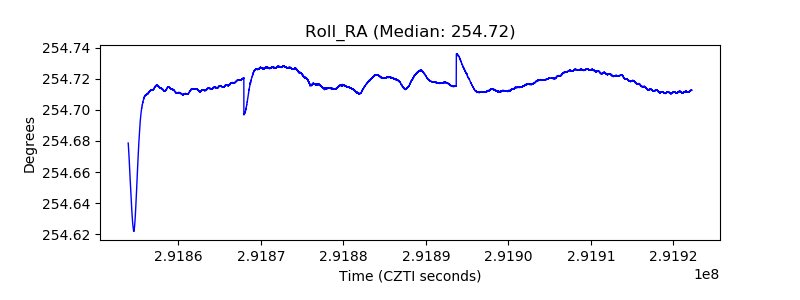 |
| Veto Counter |  |