| Param | Original file | Final file |
|---|---|---|
| Filename | modeM0/AS1A05_166T04_9000002826_18973cztM0_level2.evt | modeM0/AS1A05_166T04_9000002826_18973cztM0_level2_quad_clean.evt |
| Size (bytes) | 262,546,560 | 47,986,560 |
| Size | 250.4 MB | 45.8 MB |
| Events in quadrant A | 1,826,803 | 298,919 |
| Events in quadrant B | 1,961,301 | 310,363 |
| Events in quadrant C | 1,891,178 | 299,237 |
| Events in quadrant D | 2,023,839 | 287,317 |
| Mode SS | |||
|---|---|---|---|
| Quadrant | BADHDUFLAG | Total packets | Discarded packets |
| A | 0 | 74 | 0 |
| B | 0 | 74 | 0 |
| C | 0 | 74 | 0 |
| D | 0 | 74 | 0 |
| Mode M9 | |||
|---|---|---|---|
| Quadrant | BADHDUFLAG | Total packets | Discarded packets |
| A | 0 | 12 | 0 |
| B | 0 | 12 | 0 |
| C | 0 | 12 | 0 |
| D | 0 | 12 | 0 |
| Mode M0 | |||
|---|---|---|---|
| Quadrant | BADHDUFLAG | Total packets | Discarded packets |
| A | 0 | 7641 | 1 |
| B | 0 | 8058 | 1 |
| C | 0 | 7758 | 1 |
| D | 0 | 8380 | 1 |
| Quadrant | Total seconds | Saturated seconds | Saturation percentage |
|---|---|---|---|
| A | 3631 | 17 | 0.468191% |
| B | 3631 | 52 | 1.432112% |
| C | 3631 | 34 | 0.936381% |
| D | 3631 | 23 | 0.633434% |
Noise dominated data is calculated using 1-second bins in cleaned event files. If a bin has >2000 counts, and if more than 50% of those come from <1% of pixels, then it is considered to be noise-dominated and hence unusable.
| Quadrant | # 1 sec bins | Bins with >0 counts | Bins with >2000 counts | High rate bins dominated by noise | Noise dominated (total time) | Noise dominated (detector-on time) | Marked lightcurve |
|---|---|---|---|---|---|---|---|
| A | 4786 | 3632 | 0 | 0 | 0.00% | 0.00% |  |
| B | 4786 | 3632 | 13 | 13 | 0.27% | 0.36% |  |
| C | 4786 | 3632 | 0 | 0 | 0.00% | 0.00% |  |
| D | 4786 | 3632 | 5 | 5 | 0.10% | 0.14% |  |
Top three noisy pixels from each quadrant. If the there are fewer than three noisy pixels in the level2.evt file, extra rows are filled as -1
| Pixel properties | Quadrant properties | ||||||
|---|---|---|---|---|---|---|---|
| Quadrant | DetID | PixID | Counts | Sigma | Mean | Median | Sigma |
| A | 11 | 29 | 11215 | 110.68 | 472 | 461 | 97.2 |
| A | 0 | 226 | 4190 | 38.38 | 472 | 461 | 97.2 |
| A | 3 | 137 | 3711 | 33.45 | 472 | 461 | 97.2 |
| B | 7 | 220 | 77803 | 841.65 | 471 | 459 | 91.9 |
| B | 3 | 112 | 25108 | 268.23 | 471 | 459 | 91.9 |
| B | 12 | 111 | 10399 | 108.17 | 471 | 459 | 91.9 |
| C | 14 | 238 | 71835 | 660.48 | 458 | 462 | 108.1 |
| C | 6 | 96 | 16197 | 145.61 | 458 | 462 | 108.1 |
| C | 7 | 220 | 5646 | 47.97 | 458 | 462 | 108.1 |
| D | 7 | 238 | 246557 | 2169.8 | 460 | 446 | 113.4 |
| D | 1 | 52 | 21861 | 188.8 | 460 | 446 | 113.4 |
| D | 2 | 234 | 18382 | 158.13 | 460 | 446 | 113.4 |
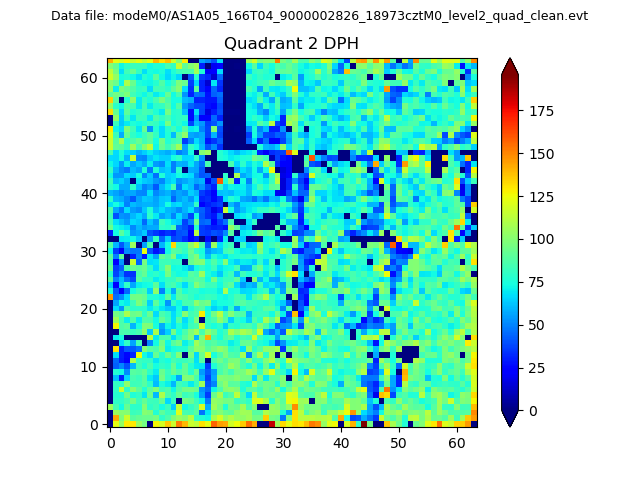
Histogram calculated using DETX and DETY for each event in the final _common_clean file
| Quadrant A |  |
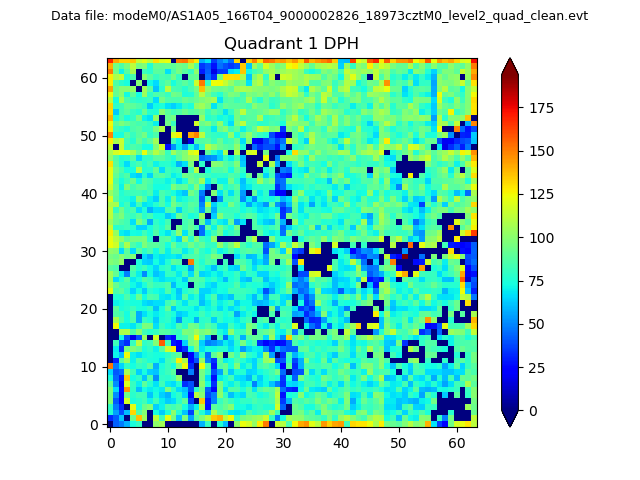 |
Quadrant B |
|---|---|---|---|
| Quadrant D |  |
 |
Quadrant C |
| Plot type | Count rate plots | Images |
|---|---|---|
| Comparison with Poisson distribution Blue bars denote a histogram of data divided into 1 sec bins. Red curve is a Poisson curve with rate = median count rate of data. |
 |
 |
| Quadrant-wise count rates Data is divided into 100 sec bins |
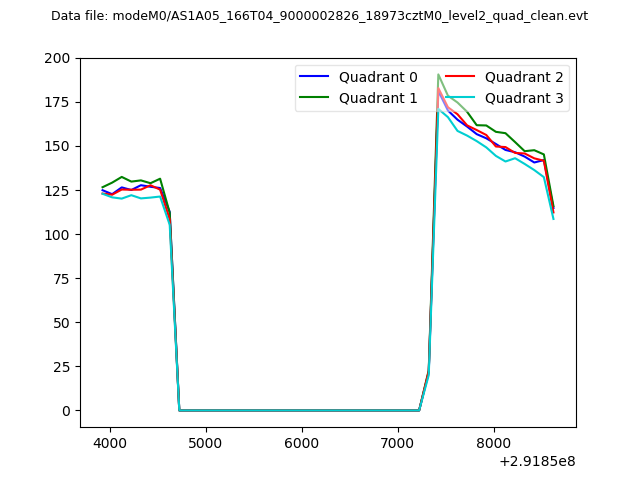 |
|
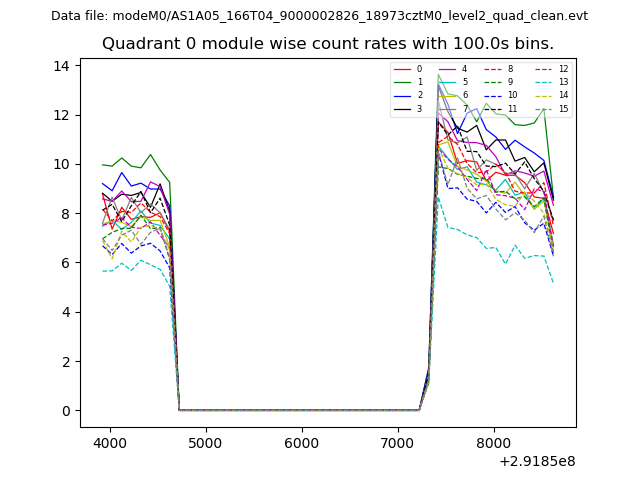
| Module-wise count rates for Quadrant A Data is divided into 100 sec bins |
 |
 |
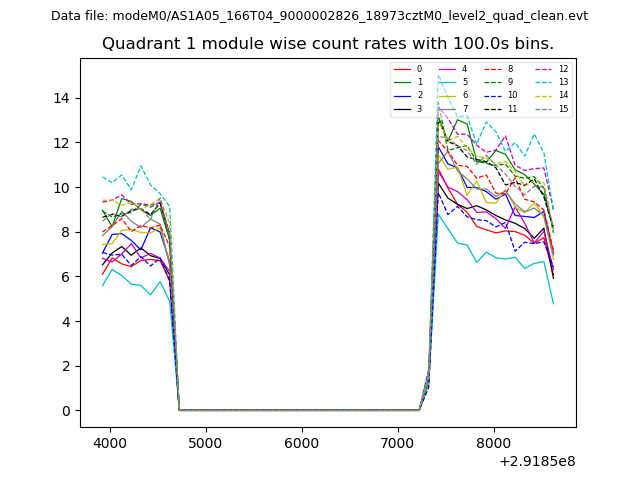
| Module-wise count rates for Quadrant B Data is divided into 100 sec bins |
 |
 |
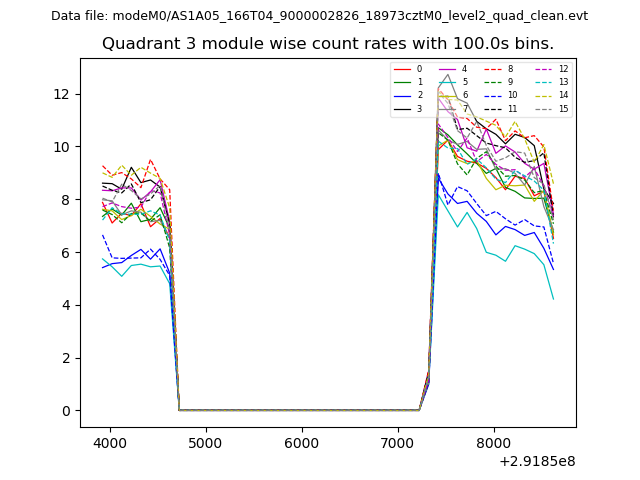
| Module-wise count rates for Quadrant C Data is divided into 100 sec bins |
 |
 |
| Module-wise count rates for Quadrant D Data is divided into 100 sec bins |
 |
 |
| Parameter | Plot |
|---|---|
| CZT HV Monitor |  |
| D_VDD | 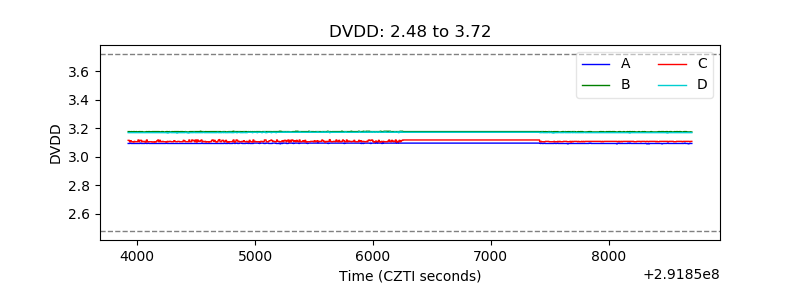 |
| Temperature 1 | 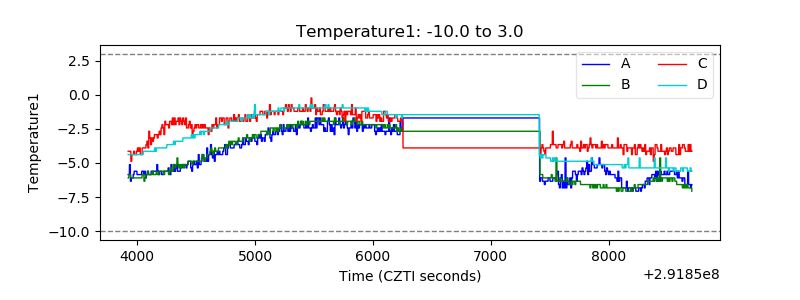 |
| Veto HV Monitor | 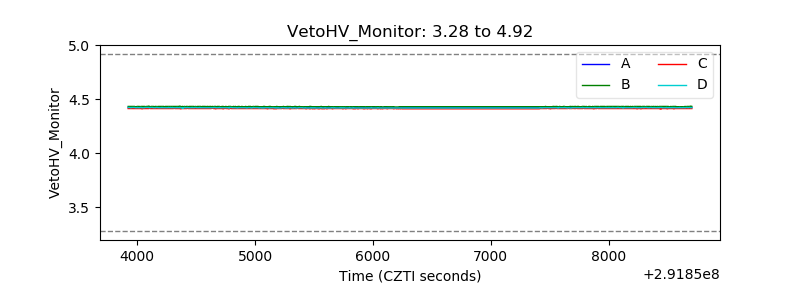 |
| Veto LLD | 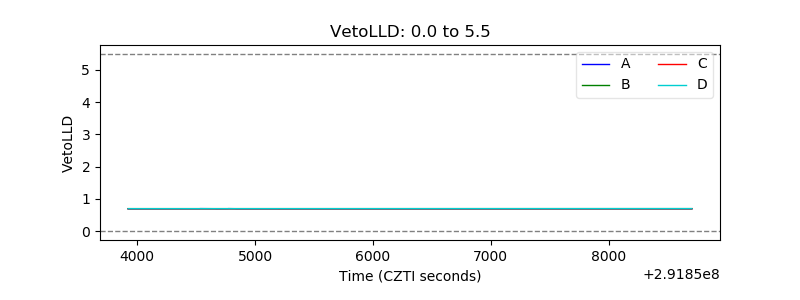 |
| Alpha Counter | 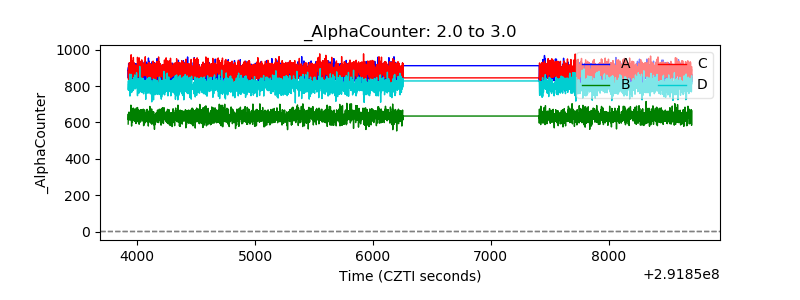 |
| _CPM_Rate | 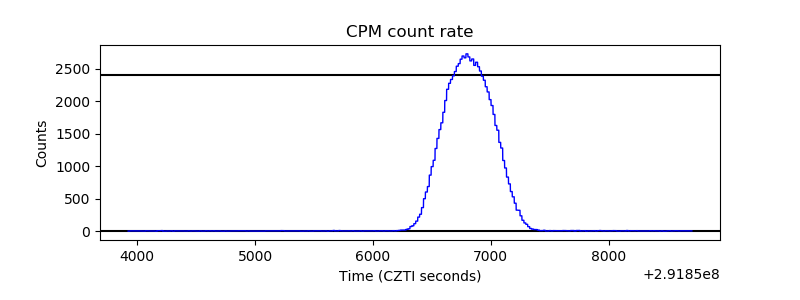 |
| CZT Counter | 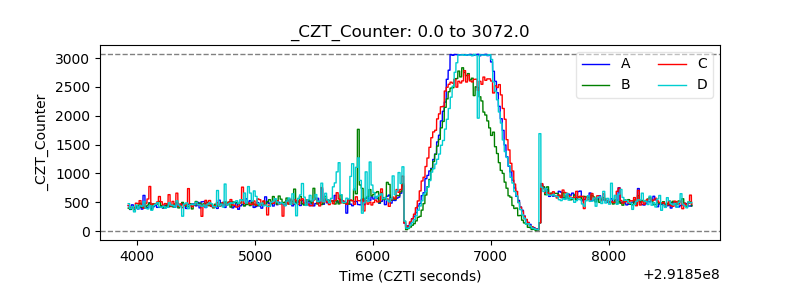 |
| +2.5 Volts monitor |  |
| +5 Volts monitor |  |
| _ROLL_ROT | 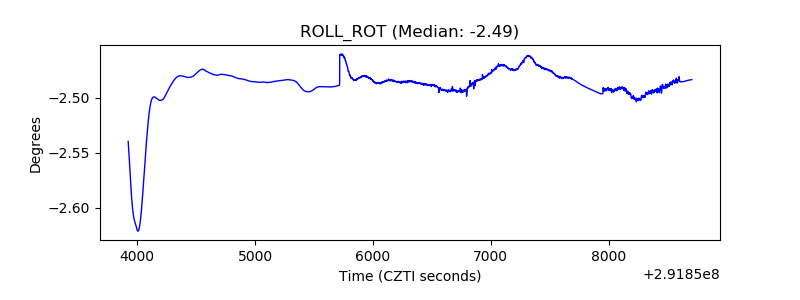 |
| _Roll_DEC | 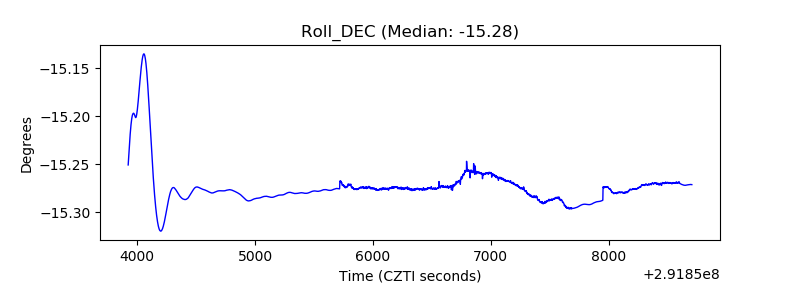 |
| _Roll_RA | 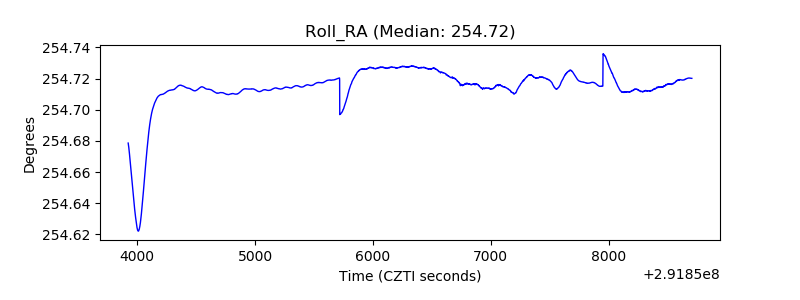 |
| Veto Counter | 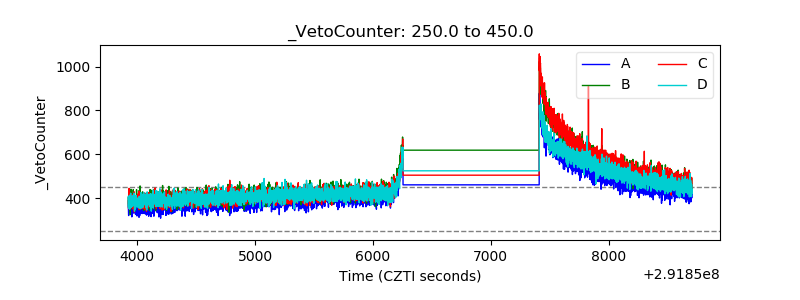 |