| Param | Original file | Final file |
|---|---|---|
| Filename | modeM0/AS1A05_166T04_9000002826_18974cztM0_level2.evt | modeM0/AS1A05_166T04_9000002826_18974cztM0_level2_quad_clean.evt |
| Size (bytes) | 523,293,120 | 107,395,200 |
| Size | 499.1 MB | 102.4 MB |
| Events in quadrant A | 3,281,294 | 699,017 |
| Events in quadrant B | 3,640,922 | 723,722 |
| Events in quadrant C | 3,397,078 | 701,544 |
| Events in quadrant D | 5,081,065 | 668,188 |
| Mode SS | |||
|---|---|---|---|
| Quadrant | BADHDUFLAG | Total packets | Discarded packets |
| A | 0 | 134 | 0 |
| B | 0 | 134 | 0 |
| C | 0 | 134 | 0 |
| D | 0 | 134 | 0 |
| Mode M9 | |||
|---|---|---|---|
| Quadrant | BADHDUFLAG | Total packets | Discarded packets |
| A | 0 | 17 | 0 |
| B | 0 | 18 | 0 |
| C | 0 | 18 | 0 |
| D | 0 | 18 | 0 |
| Mode M0 | |||
|---|---|---|---|
| Quadrant | BADHDUFLAG | Total packets | Discarded packets |
| A | 0 | 13888 | 2 |
| B | 0 | 14948 | 2 |
| C | 0 | 14079 | 2 |
| D | 0 | 19524 | 2 |
| Quadrant | Total seconds | Saturated seconds | Saturation percentage |
|---|---|---|---|
| A | 6599 | 28 | 0.424307% |
| B | 6599 | 85 | 1.288074% |
| C | 6599 | 46 | 0.697075% |
| D | 6599 | 584 | 8.849826% |
Noise dominated data is calculated using 1-second bins in cleaned event files. If a bin has >2000 counts, and if more than 50% of those come from <1% of pixels, then it is considered to be noise-dominated and hence unusable.
| Quadrant | # 1 sec bins | Bins with >0 counts | Bins with >2000 counts | High rate bins dominated by noise | Noise dominated (total time) | Noise dominated (detector-on time) | Marked lightcurve |
|---|---|---|---|---|---|---|---|
| A | 7854 | 6600 | 0 | 0 | 0.00% | 0.00% | 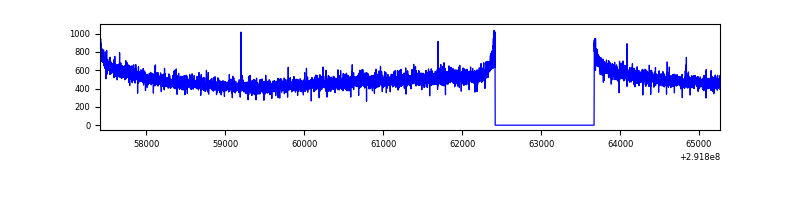 |
| B | 7854 | 6600 | 25 | 25 | 0.32% | 0.38% | 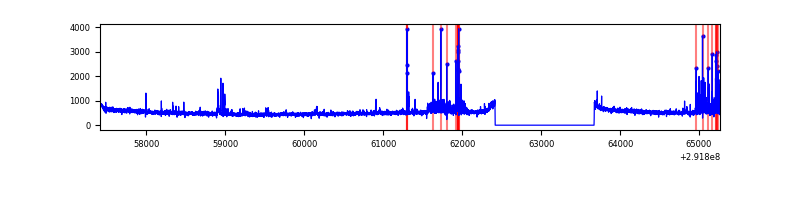 |
| C | 7854 | 6600 | 0 | 0 | 0.00% | 0.00% | 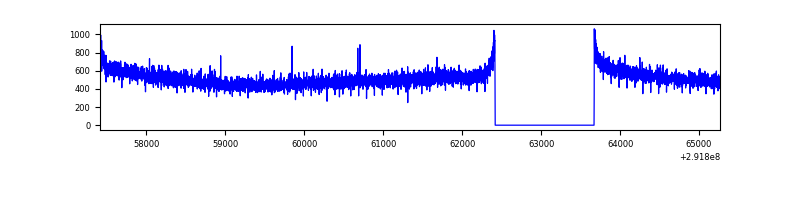 |
| D | 7854 | 6599 | 346 | 346 | 4.41% | 5.24% | 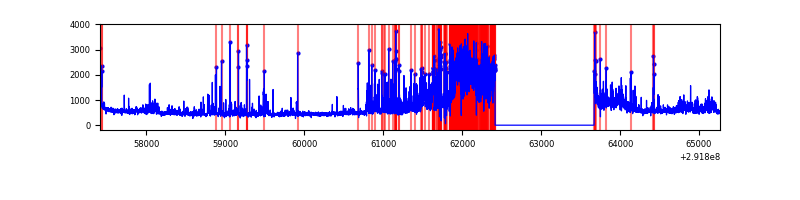 |
Top three noisy pixels from each quadrant. If the there are fewer than three noisy pixels in the level2.evt file, extra rows are filled as -1
| Pixel properties | Quadrant properties | ||||||
|---|---|---|---|---|---|---|---|
| Quadrant | DetID | PixID | Counts | Sigma | Mean | Median | Sigma |
| A | 11 | 29 | 14799 | 81.74 | 848 | 831 | 170.9 |
| A | 0 | 226 | 7337 | 38.07 | 848 | 831 | 170.9 |
| A | 13 | 254 | 6763 | 34.71 | 848 | 831 | 170.9 |
| B | 3 | 112 | 151486 | 938.63 | 854 | 835 | 160.5 |
| B | 7 | 220 | 106728 | 659.77 | 854 | 835 | 160.5 |
| B | 12 | 111 | 18562 | 110.45 | 854 | 835 | 160.5 |
| C | 14 | 238 | 130282 | 664.02 | 833 | 839 | 194.9 |
| C | 3 | 233 | 7830 | 35.86 | 833 | 839 | 194.9 |
| C | 7 | 220 | 6791 | 30.53 | 833 | 839 | 194.9 |
| D | 7 | 238 | 836460 | 4350.77 | 795 | 776 | 192.1 |
| D | 1 | 52 | 586402 | 3048.91 | 795 | 776 | 192.1 |
| D | 9 | 68 | 585523 | 3044.33 | 795 | 776 | 192.1 |
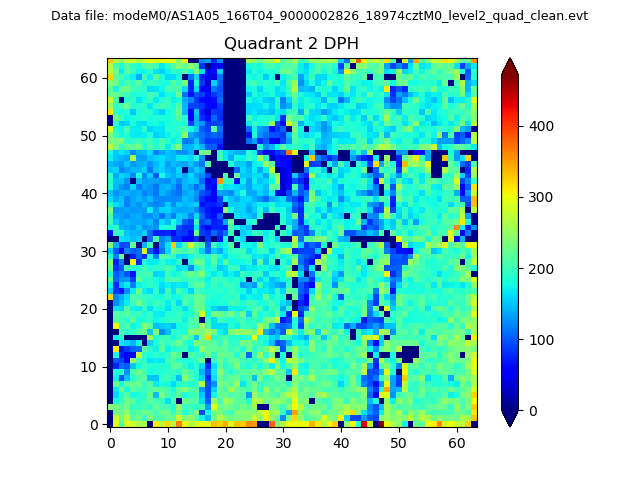
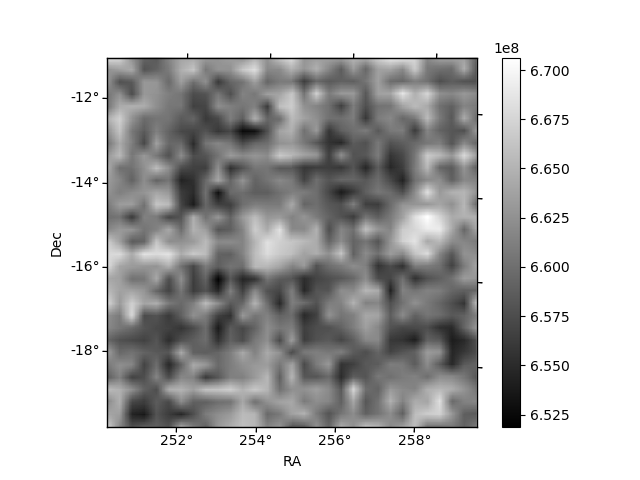
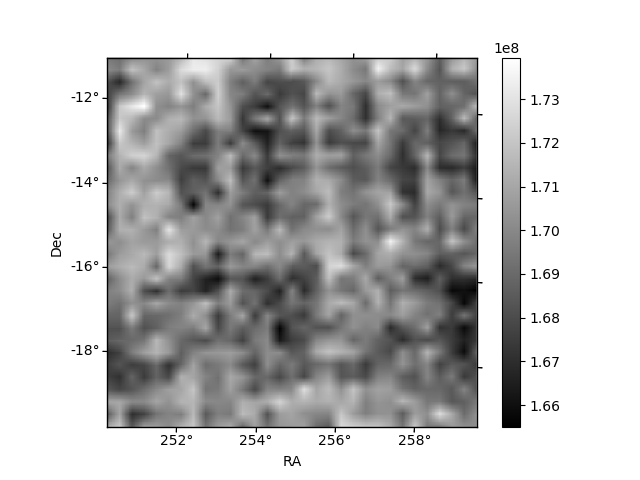
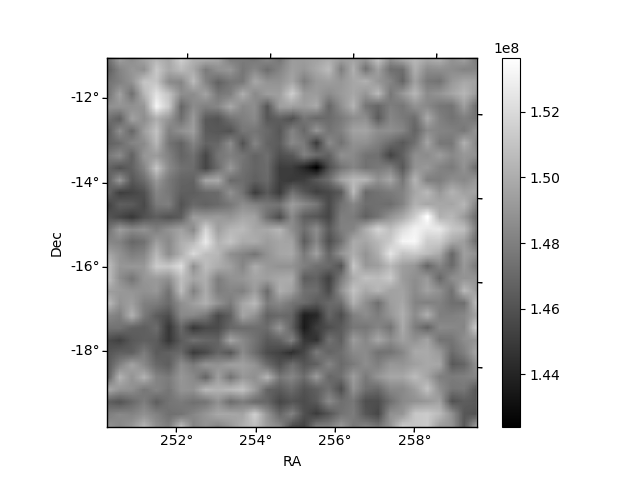
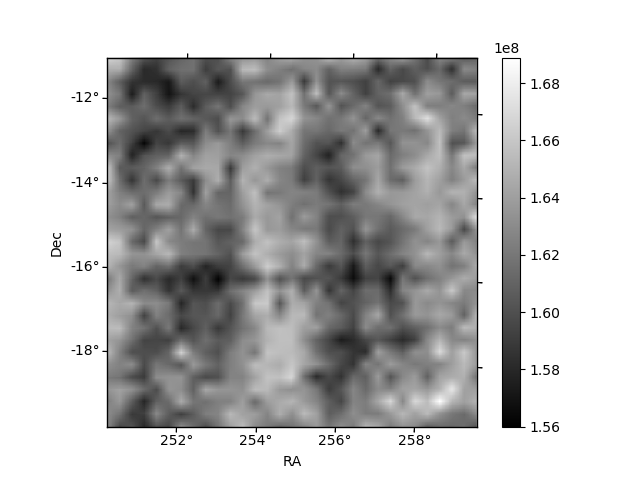
Histogram calculated using DETX and DETY for each event in the final _common_clean file
| Quadrant A | 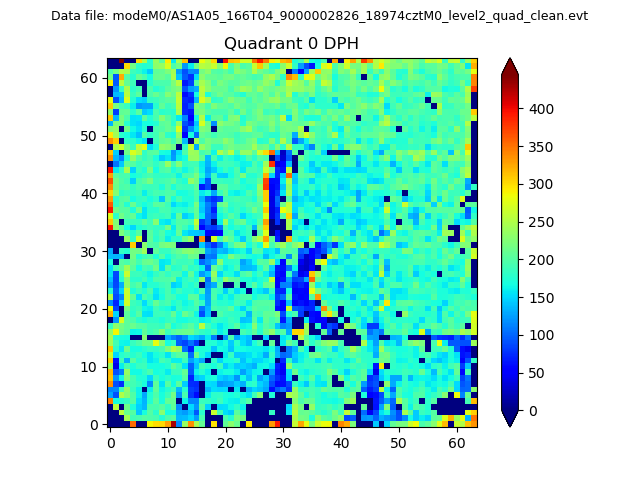 |
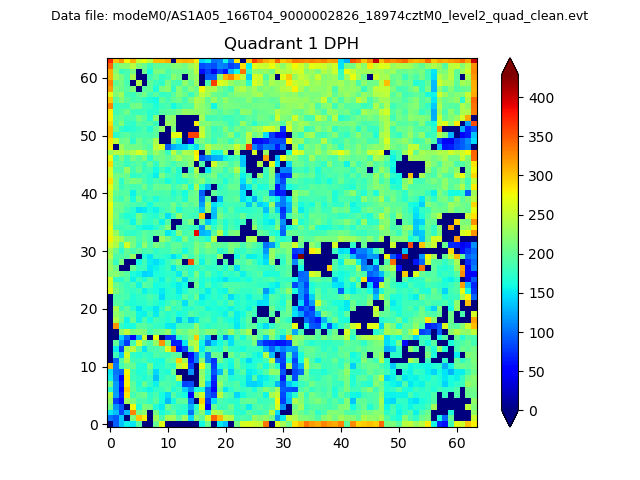 |
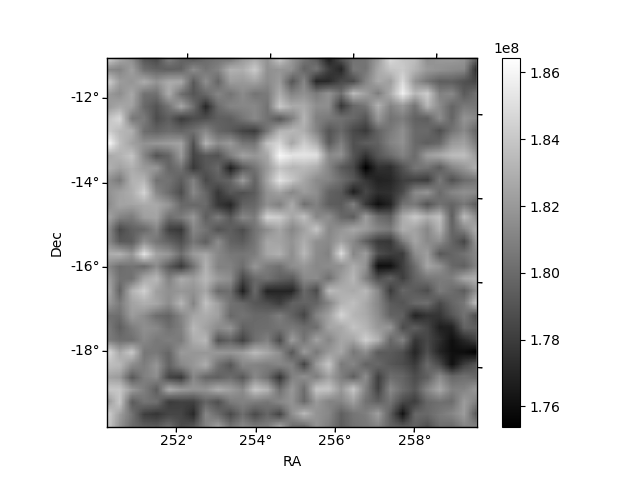
Quadrant B |
|---|---|---|---|
| Quadrant D | 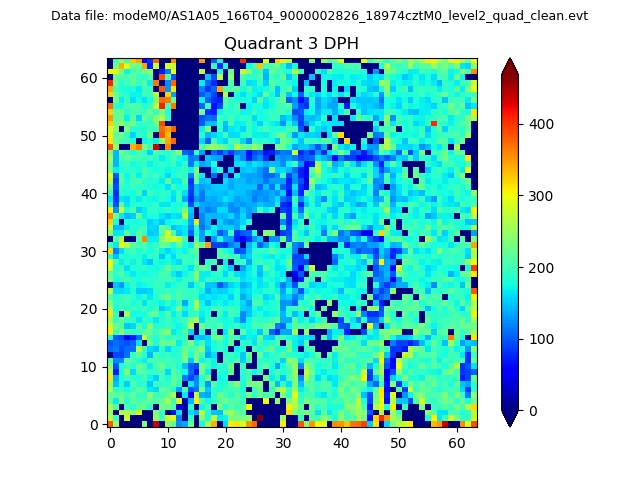 |
 |
Quadrant C |
| Plot type | Count rate plots | Images |
|---|---|---|
| Comparison with Poisson distribution Blue bars denote a histogram of data divided into 1 sec bins. Red curve is a Poisson curve with rate = median count rate of data. |
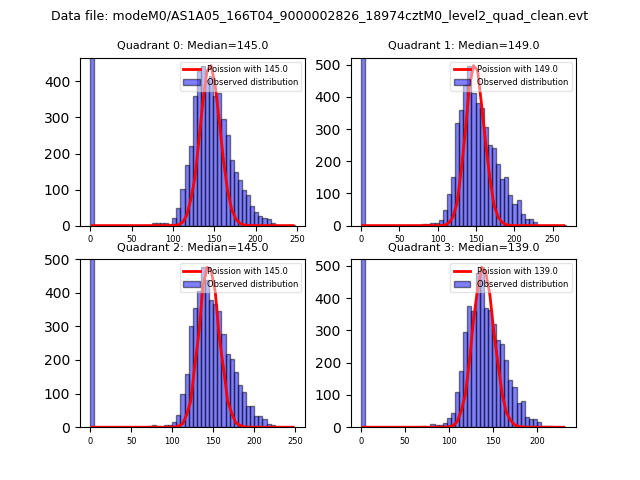 |
 |
| Quadrant-wise count rates Data is divided into 100 sec bins |
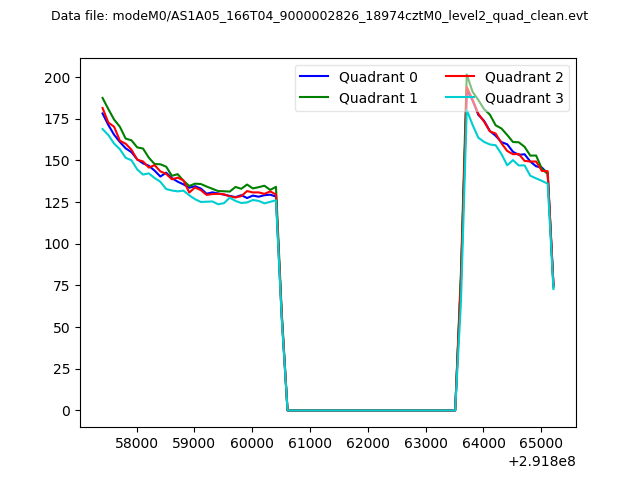 |
|
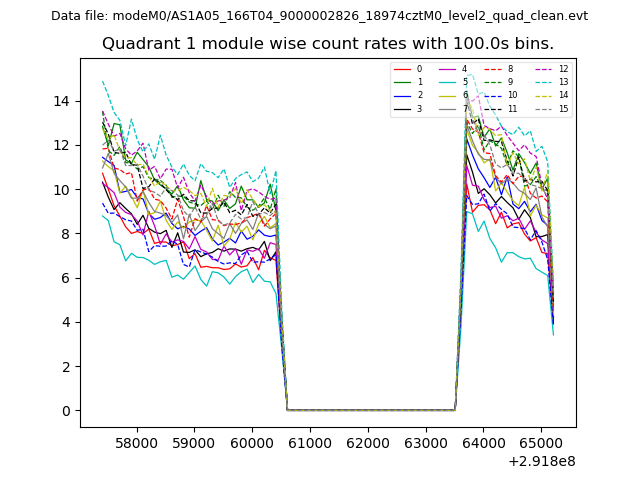
| Module-wise count rates for Quadrant A Data is divided into 100 sec bins |
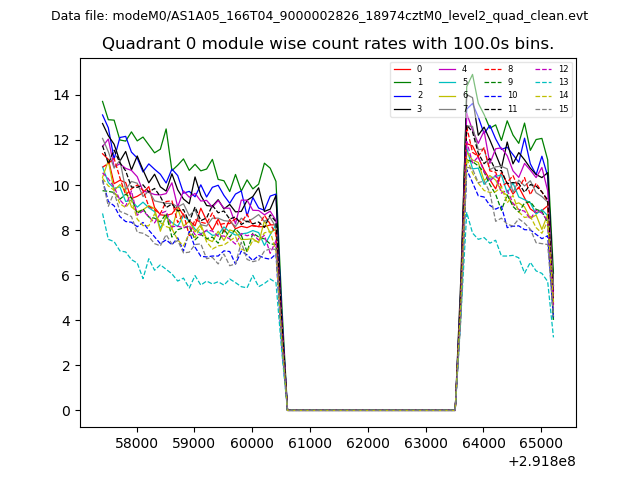 |
 |
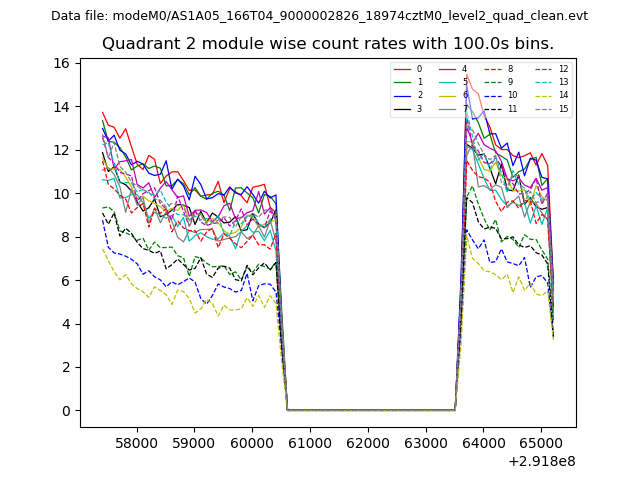
| Module-wise count rates for Quadrant B Data is divided into 100 sec bins |
 |
 |
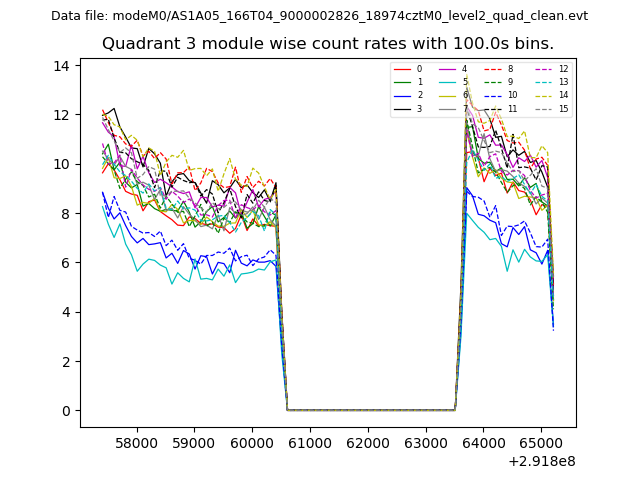
| Module-wise count rates for Quadrant C Data is divided into 100 sec bins |
 |
 |
| Module-wise count rates for Quadrant D Data is divided into 100 sec bins |
 |
 |
| Parameter | Plot |
|---|---|
| CZT HV Monitor | 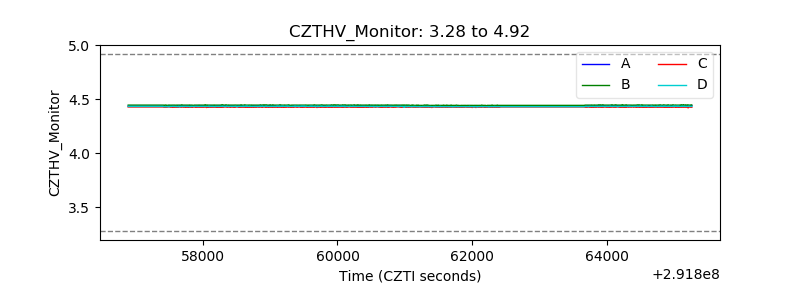 |
| D_VDD | 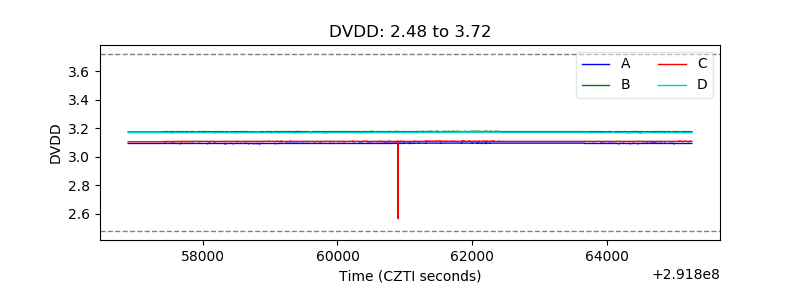 |
| Temperature 1 | 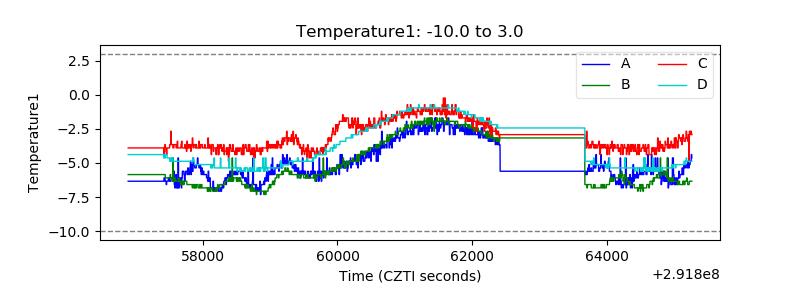 |
| Veto HV Monitor | 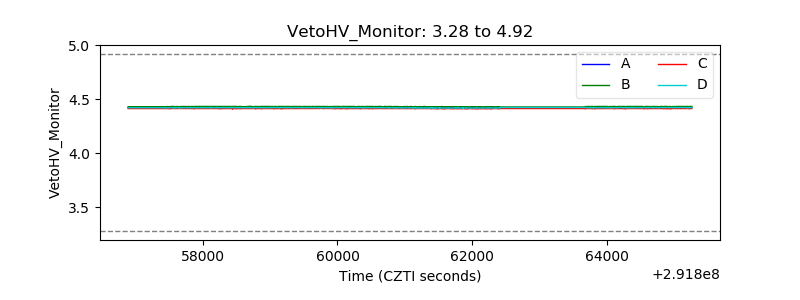 |
| Veto LLD | 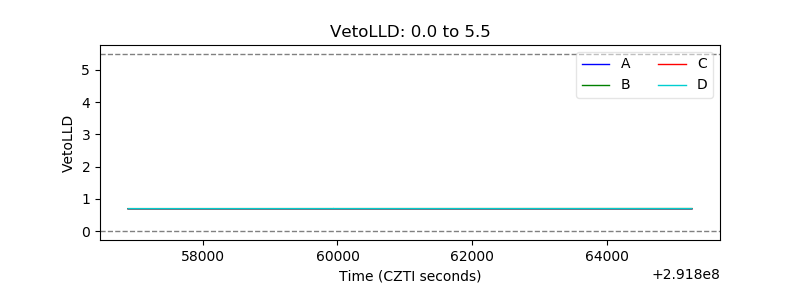 |
| Alpha Counter | 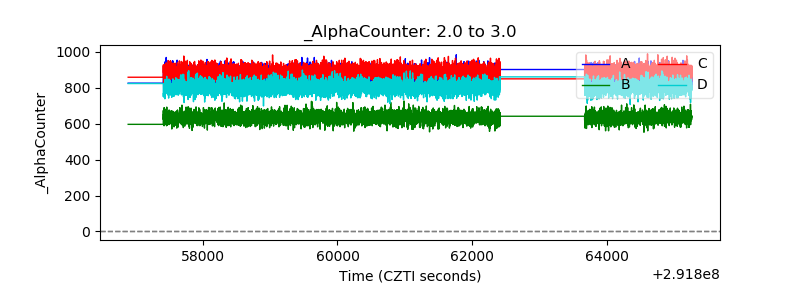 |
| _CPM_Rate | 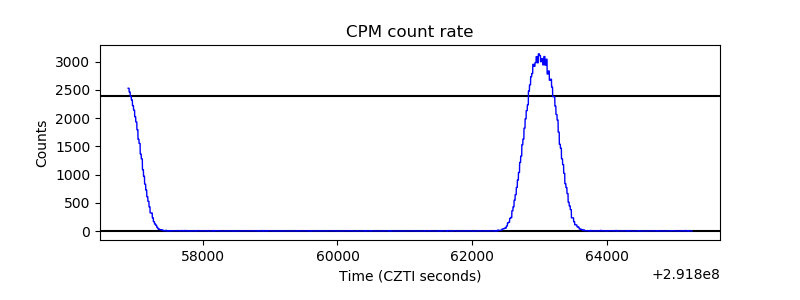 |
| CZT Counter | 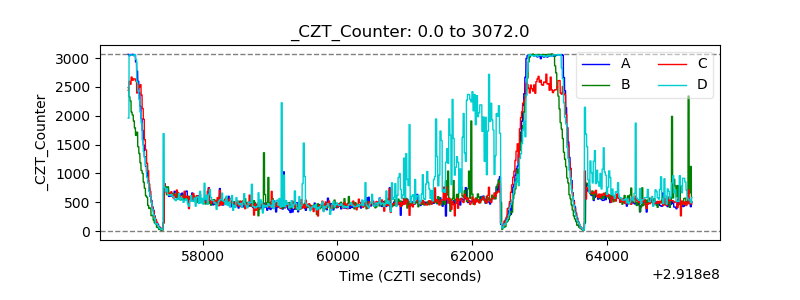 |
| +2.5 Volts monitor | 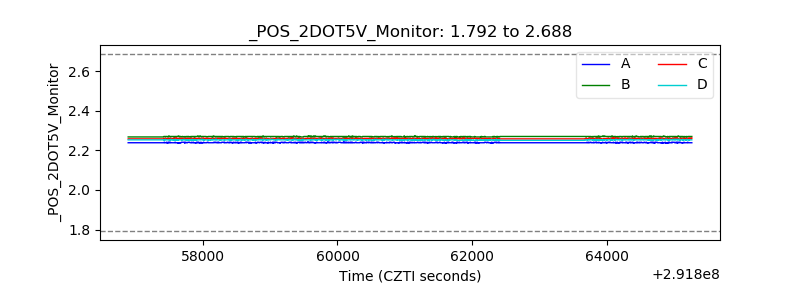 |
| +5 Volts monitor | 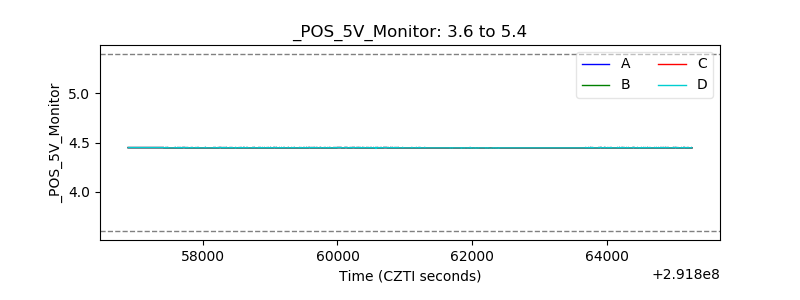 |
| _ROLL_ROT | 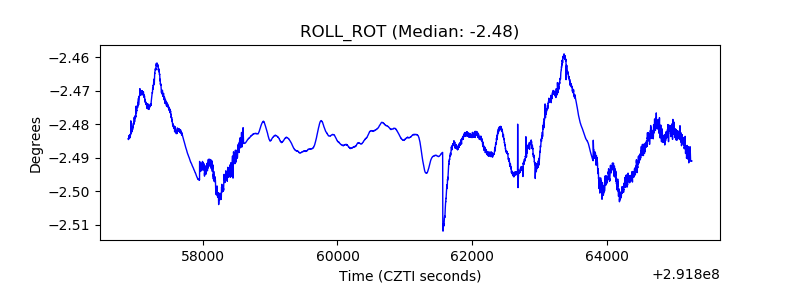 |
| _Roll_DEC | 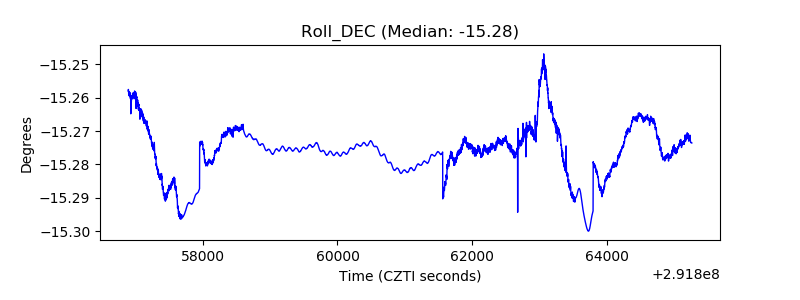 |
| _Roll_RA | 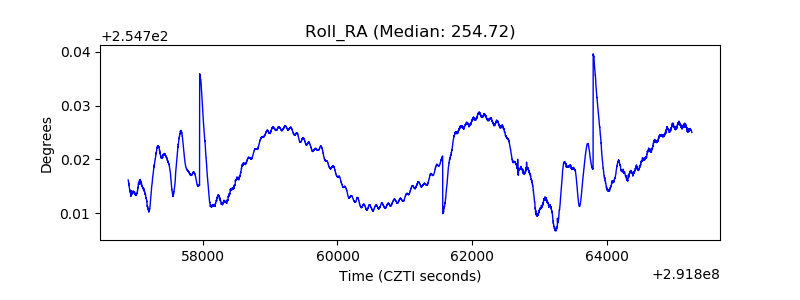 |
| Veto Counter | 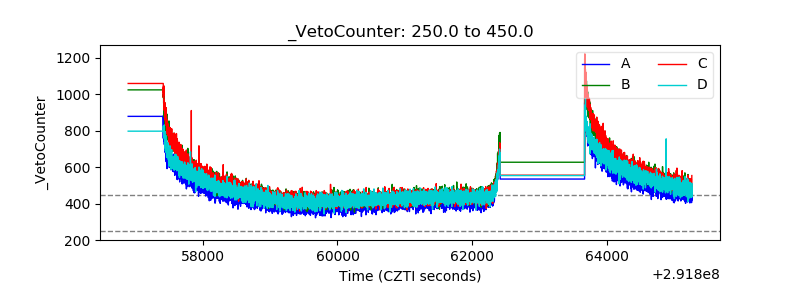 |