| Param | Original file | Final file |
|---|---|---|
| Filename | modeM0/AS1A05_166T04_9000002826_18975cztM0_level2.evt | modeM0/AS1A05_166T04_9000002826_18975cztM0_level2_quad_clean.evt |
| Size (bytes) | 599,964,480 | 104,685,120 |
| Size | 572.2 MB | 99.8 MB |
| Events in quadrant A | 3,352,856 | 687,183 |
| Events in quadrant B | 5,351,339 | 699,634 |
| Events in quadrant C | 3,528,548 | 680,739 |
| Events in quadrant D | 5,495,384 | 647,822 |
| Mode SS | |||
|---|---|---|---|
| Quadrant | BADHDUFLAG | Total packets | Discarded packets |
| A | 0 | 132 | 0 |
| B | 0 | 132 | 0 |
| C | 0 | 132 | 0 |
| D | 0 | 132 | 0 |
| Mode M9 | |||
|---|---|---|---|
| Quadrant | BADHDUFLAG | Total packets | Discarded packets |
| A | 0 | 20 | 0 |
| B | 0 | 21 | 0 |
| C | 0 | 21 | 0 |
| D | 0 | 21 | 0 |
| Mode M0 | |||
|---|---|---|---|
| Quadrant | BADHDUFLAG | Total packets | Discarded packets |
| A | 0 | 13832 | 2 |
| B | 0 | 20147 | 2 |
| C | 0 | 14342 | 2 |
| D | 0 | 20656 | 2 |
| Quadrant | Total seconds | Saturated seconds | Saturation percentage |
|---|---|---|---|
| A | 6529 | 25 | 0.382907% |
| B | 6529 | 672 | 10.292541% |
| C | 6529 | 65 | 0.995558% |
| D | 6528 | 533 | 8.164828% |
Noise dominated data is calculated using 1-second bins in cleaned event files. If a bin has >2000 counts, and if more than 50% of those come from <1% of pixels, then it is considered to be noise-dominated and hence unusable.
| Quadrant | # 1 sec bins | Bins with >0 counts | Bins with >2000 counts | High rate bins dominated by noise | Noise dominated (total time) | Noise dominated (detector-on time) | Marked lightcurve |
|---|---|---|---|---|---|---|---|
| A | 7859 | 6530 | 0 | 0 | 0.00% | 0.00% | 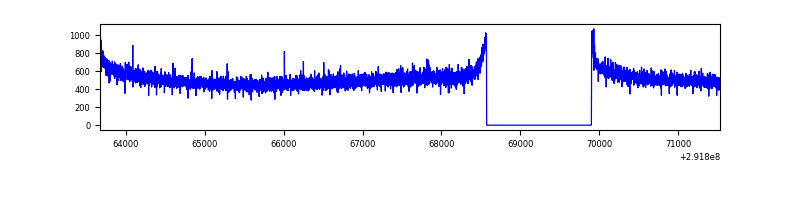 |
| B | 7859 | 6530 | 400 | 400 | 5.09% | 6.13% | 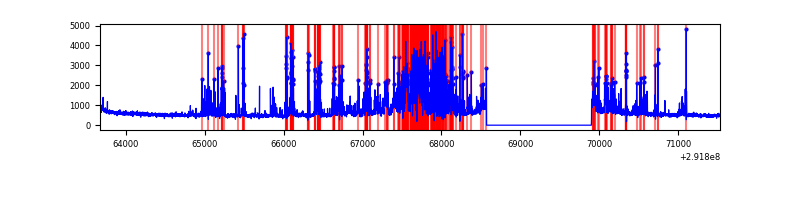 |
| C | 7859 | 6530 | 3 | 3 | 0.04% | 0.05% | 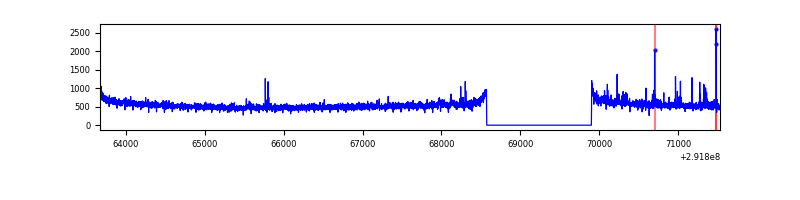 |
| D | 7858 | 6529 | 365 | 365 | 4.64% | 5.59% | 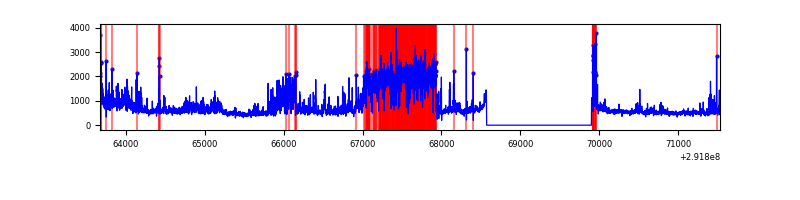 |
Top three noisy pixels from each quadrant. If the there are fewer than three noisy pixels in the level2.evt file, extra rows are filled as -1
| Pixel properties | Quadrant properties | ||||||
|---|---|---|---|---|---|---|---|
| Quadrant | DetID | PixID | Counts | Sigma | Mean | Median | Sigma |
| A | 0 | 226 | 7649 | 39.42 | 869 | 855 | 172.4 |
| A | 13 | 254 | 7413 | 38.05 | 869 | 855 | 172.4 |
| A | 12 | 194 | 6188 | 30.94 | 869 | 855 | 172.4 |
| B | 3 | 112 | 1977947 | 12687.37 | 837 | 819 | 155.8 |
| B | 7 | 220 | 59666 | 377.63 | 837 | 819 | 155.8 |
| B | 12 | 111 | 17951 | 109.94 | 837 | 819 | 155.8 |
| C | 14 | 238 | 133735 | 667.39 | 847 | 852 | 199.1 |
| C | 0 | 207 | 76105 | 377.95 | 847 | 852 | 199.1 |
| C | 3 | 233 | 18267 | 87.46 | 847 | 852 | 199.1 |
| D | 7 | 238 | 1838671 | 9254.58 | 829 | 809 | 198.6 |
| D | 1 | 52 | 515481 | 2591.64 | 829 | 809 | 198.6 |
| D | 2 | 234 | 26780 | 130.77 | 829 | 809 | 198.6 |
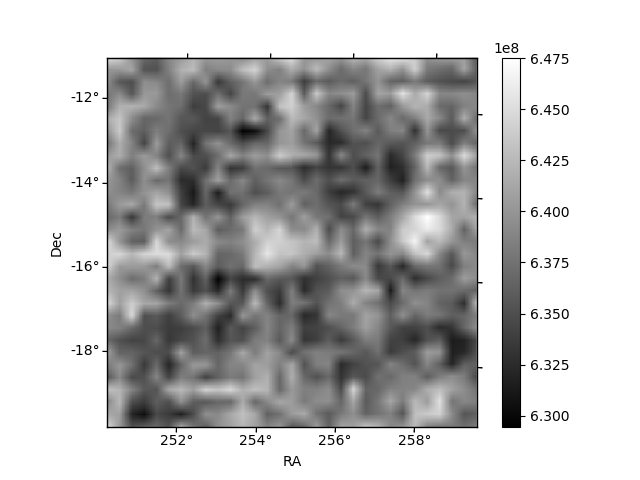
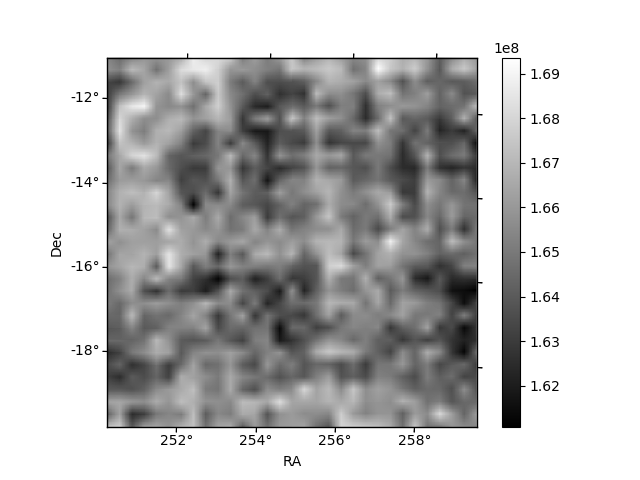
Histogram calculated using DETX and DETY for each event in the final _common_clean file
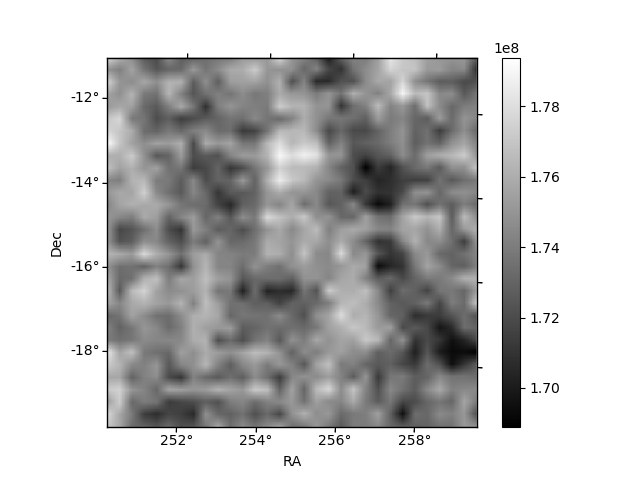
| Quadrant A | 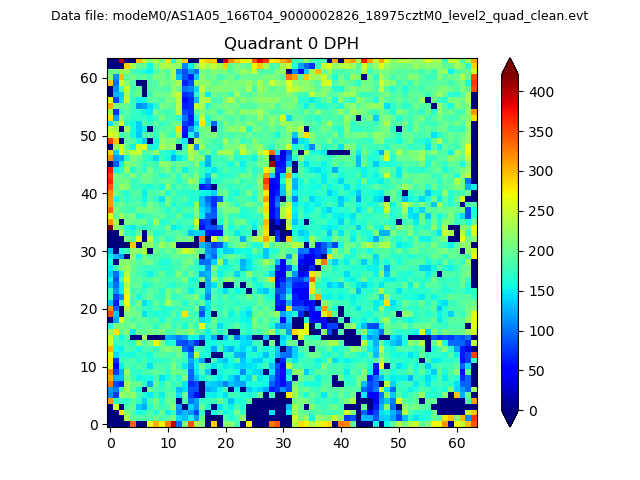 |
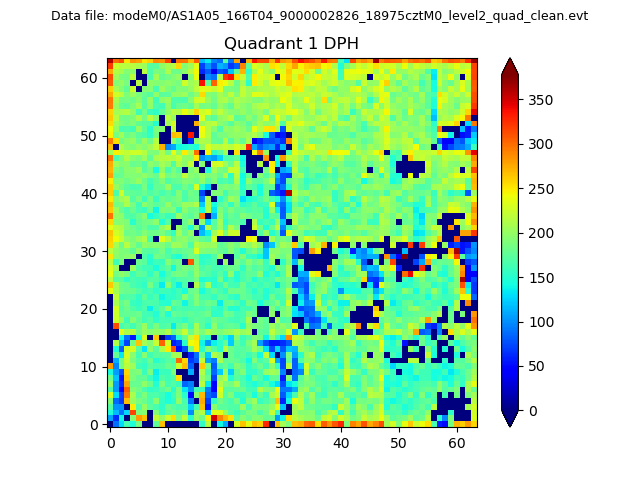 |
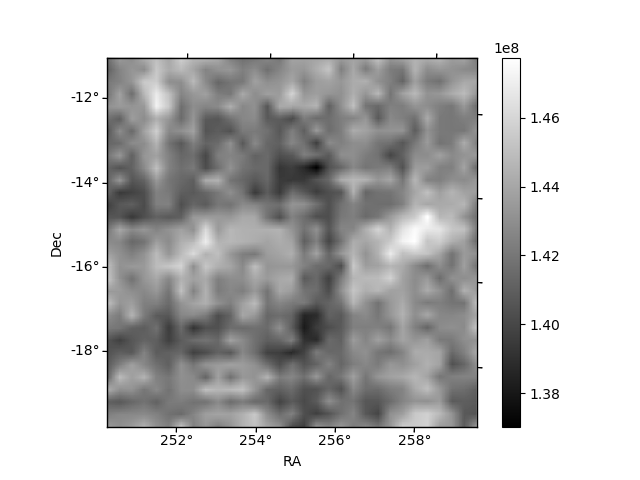
Quadrant B |
|---|---|---|---|
| Quadrant D | 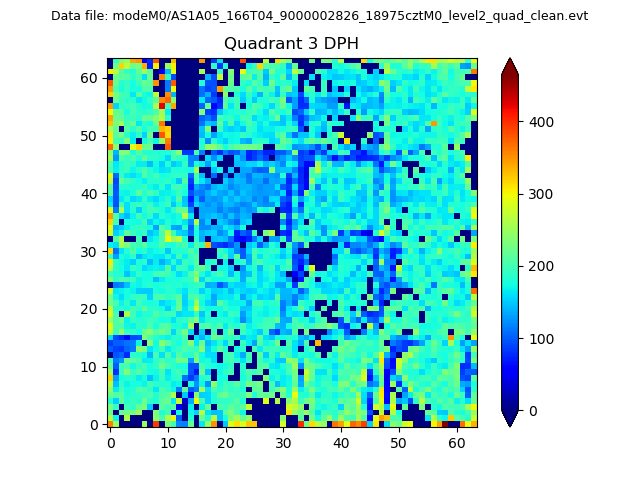 |
 |
Quadrant C |
| Plot type | Count rate plots | Images |
|---|---|---|
| Comparison with Poisson distribution Blue bars denote a histogram of data divided into 1 sec bins. Red curve is a Poisson curve with rate = median count rate of data. |
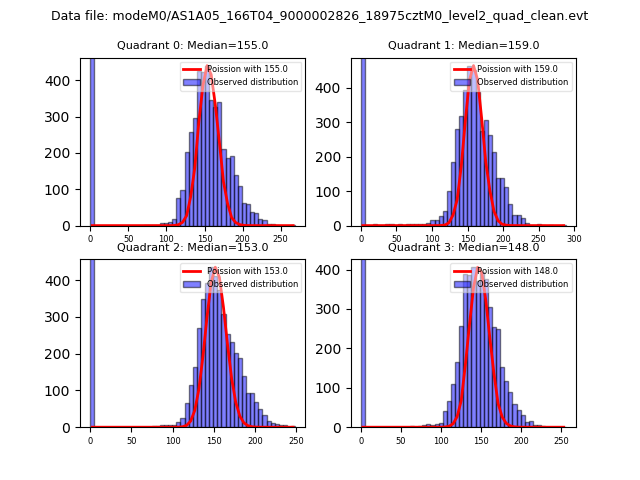 |
 |
| Quadrant-wise count rates Data is divided into 100 sec bins |
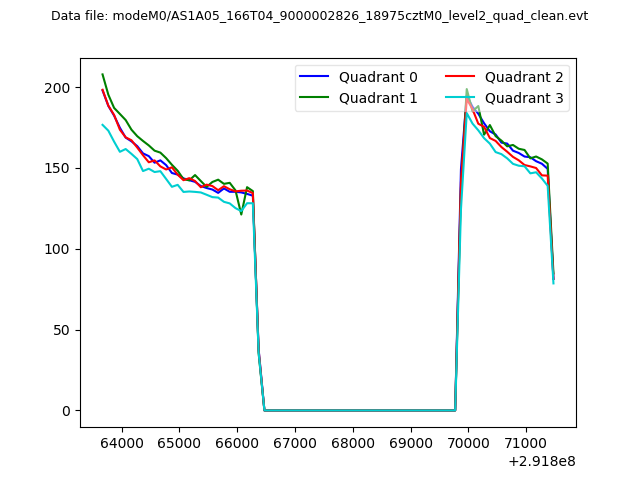 |
|
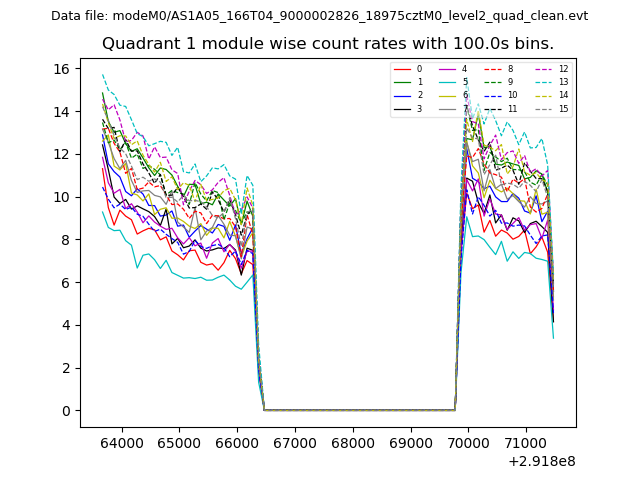
| Module-wise count rates for Quadrant A Data is divided into 100 sec bins |
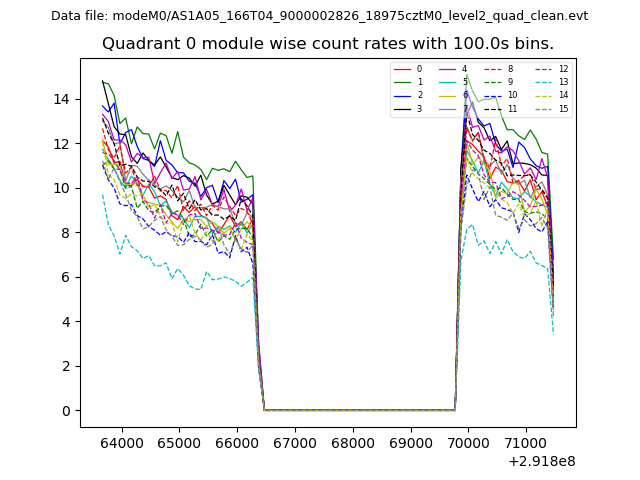 |
 |
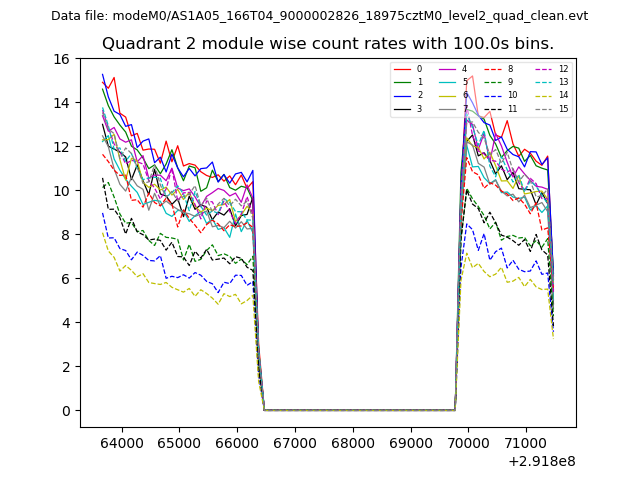
| Module-wise count rates for Quadrant B Data is divided into 100 sec bins |
 |
 |
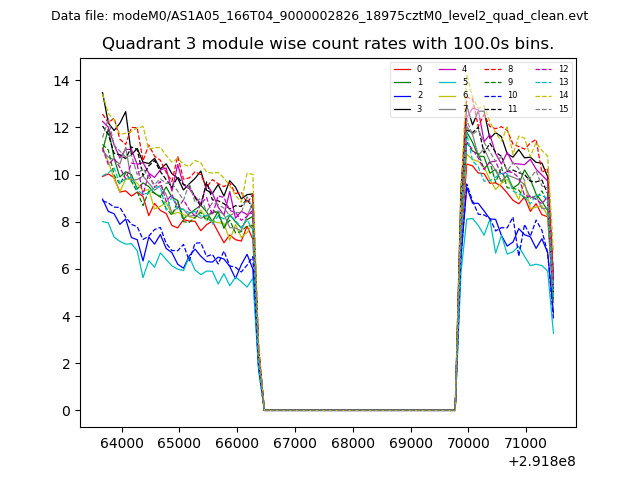
| Module-wise count rates for Quadrant C Data is divided into 100 sec bins |
 |
 |
| Module-wise count rates for Quadrant D Data is divided into 100 sec bins |
 |
 |
| Parameter | Plot |
|---|---|
| CZT HV Monitor | 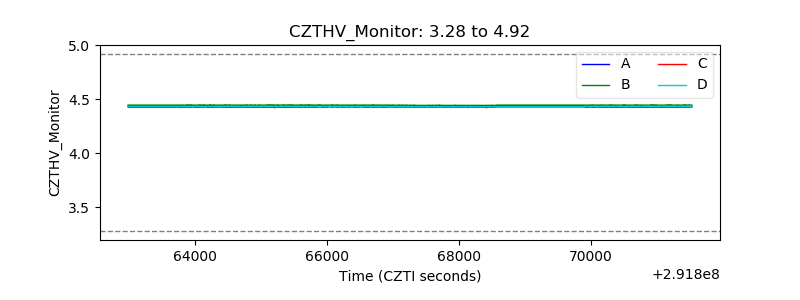 |
| D_VDD | 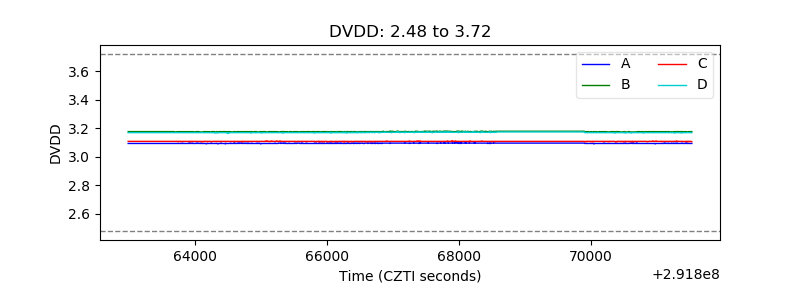 |
| Temperature 1 | 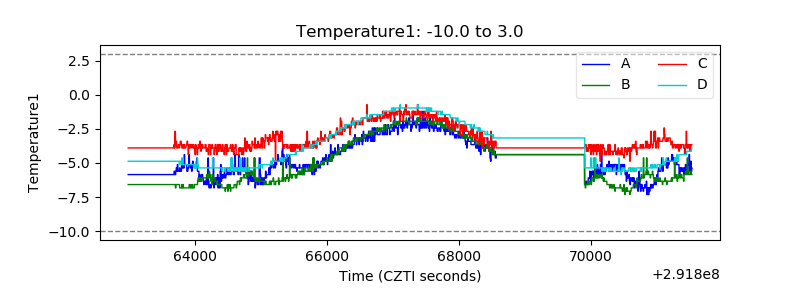 |
| Veto HV Monitor | 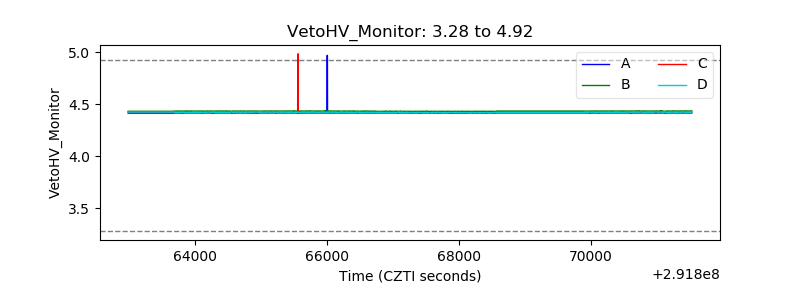 |
| Veto LLD | 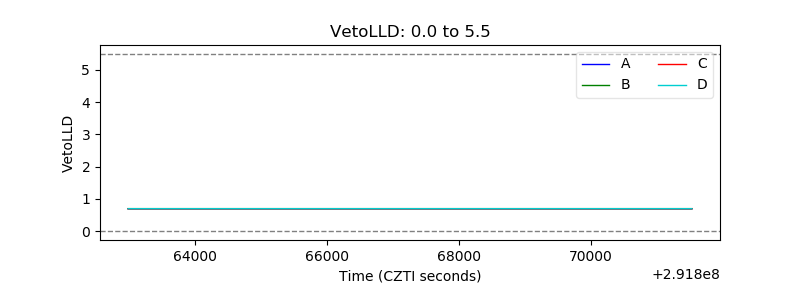 |
| Alpha Counter | 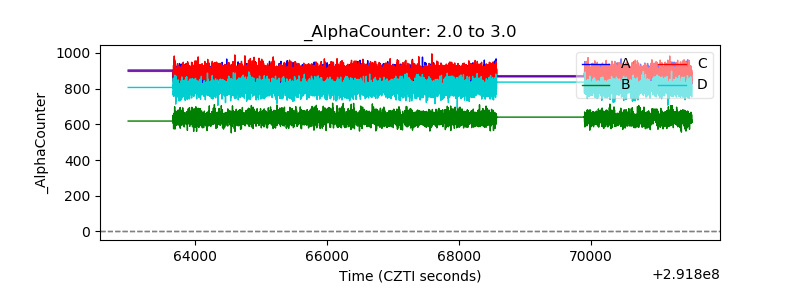 |
| _CPM_Rate | 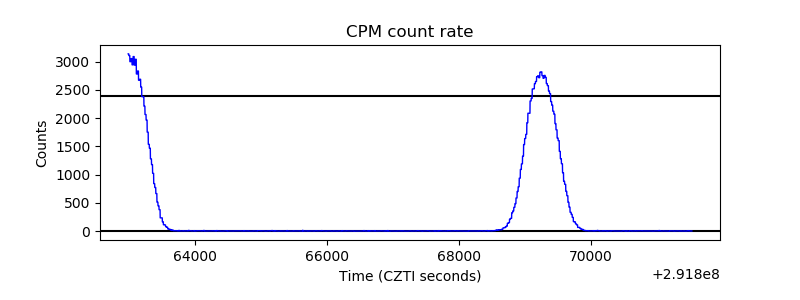 |
| CZT Counter | 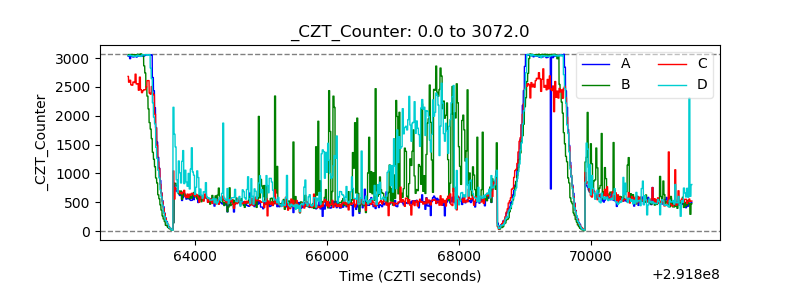 |
| +2.5 Volts monitor |  |
| +5 Volts monitor |  |
| _ROLL_ROT | 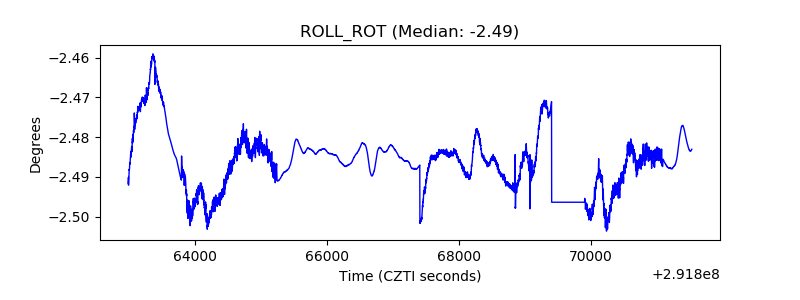 |
| _Roll_DEC | 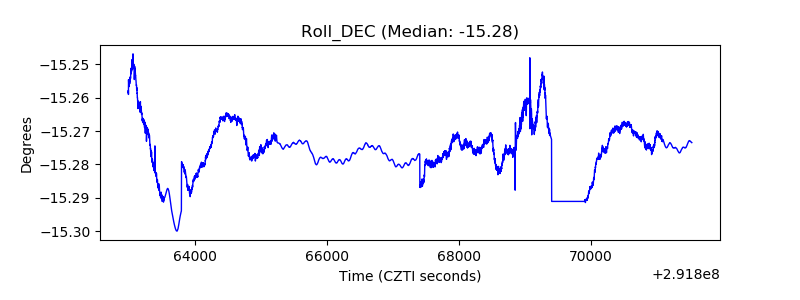 |
| _Roll_RA | 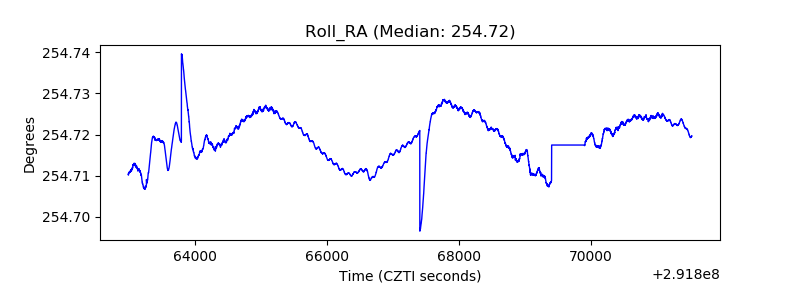 |
| Veto Counter | 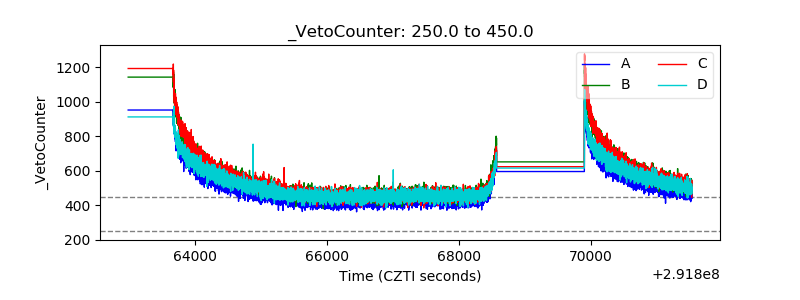 |