| Param | Original file | Final file |
|---|---|---|
| Filename | modeM0/AS1A05_166T04_9000002826_18976cztM0_level2.evt | modeM0/AS1A05_166T04_9000002826_18976cztM0_level2_quad_clean.evt |
| Size (bytes) | 523,615,680 | 102,162,240 |
| Size | 499.4 MB | 97.4 MB |
| Events in quadrant A | 3,362,083 | 673,466 |
| Events in quadrant B | 4,413,633 | 674,200 |
| Events in quadrant C | 3,685,682 | 658,345 |
| Events in quadrant D | 3,958,722 | 637,546 |
| Mode SS | |||
|---|---|---|---|
| Quadrant | BADHDUFLAG | Total packets | Discarded packets |
| A | 0 | 132 | 0 |
| B | 0 | 132 | 0 |
| C | 0 | 132 | 0 |
| D | 0 | 132 | 0 |
| Mode M9 | |||
|---|---|---|---|
| Quadrant | BADHDUFLAG | Total packets | Discarded packets |
| A | 0 | 13 | 0 |
| B | 0 | 13 | 0 |
| C | 0 | 13 | 0 |
| D | 0 | 13 | 0 |
| Mode M0 | |||
|---|---|---|---|
| Quadrant | BADHDUFLAG | Total packets | Discarded packets |
| A | 0 | 13665 | 2 |
| B | 0 | 17208 | 2 |
| C | 0 | 14763 | 2 |
| D | 0 | 15692 | 2 |
| Quadrant | Total seconds | Saturated seconds | Saturation percentage |
|---|---|---|---|
| A | 6453 | 42 | 0.650860% |
| B | 6453 | 311 | 4.819464% |
| C | 6453 | 116 | 1.797614% |
| D | 6454 | 85 | 1.317013% |
Noise dominated data is calculated using 1-second bins in cleaned event files. If a bin has >2000 counts, and if more than 50% of those come from <1% of pixels, then it is considered to be noise-dominated and hence unusable.
| Quadrant | # 1 sec bins | Bins with >0 counts | Bins with >2000 counts | High rate bins dominated by noise | Noise dominated (total time) | Noise dominated (detector-on time) | Marked lightcurve |
|---|---|---|---|---|---|---|---|
| A | 7813 | 6454 | 0 | 0 | 0.00% | 0.00% | 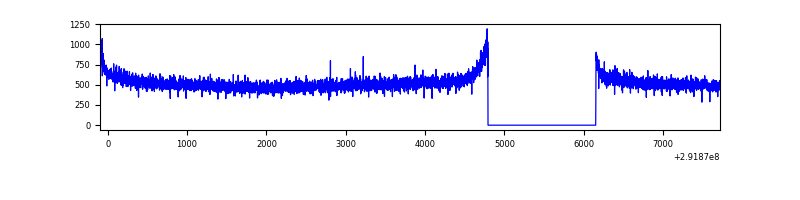 |
| B | 7813 | 6454 | 141 | 141 | 1.80% | 2.18% | 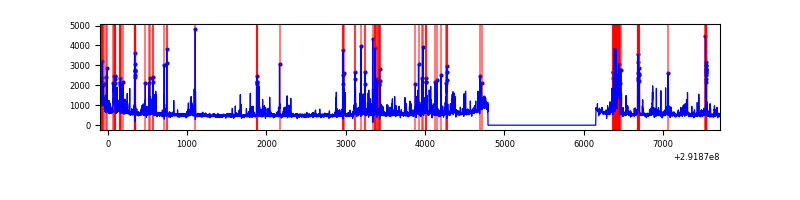 |
| C | 7813 | 6454 | 15 | 15 | 0.19% | 0.23% | 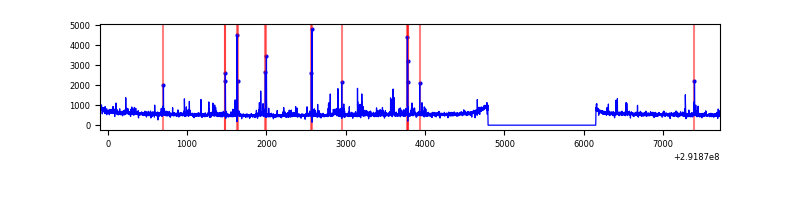 |
| D | 7814 | 6455 | 19 | 19 | 0.24% | 0.29% | 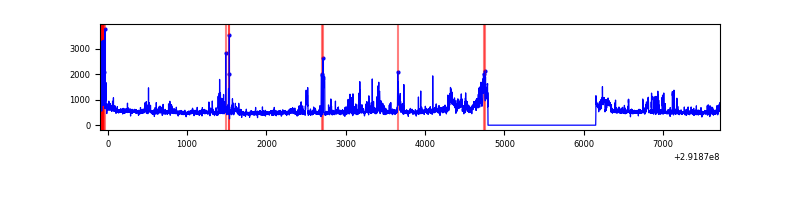 |
Top three noisy pixels from each quadrant. If the there are fewer than three noisy pixels in the level2.evt file, extra rows are filled as -1
| Pixel properties | Quadrant properties | ||||||
|---|---|---|---|---|---|---|---|
| Quadrant | DetID | PixID | Counts | Sigma | Mean | Median | Sigma |
| A | 0 | 226 | 7613 | 38.86 | 872 | 856 | 173.9 |
| A | 13 | 254 | 7169 | 36.31 | 872 | 856 | 173.9 |
| A | 12 | 194 | 6308 | 31.36 | 872 | 856 | 173.9 |
| B | 3 | 112 | 876528 | 5490.41 | 854 | 837 | 159.5 |
| B | 7 | 220 | 187504 | 1170.37 | 854 | 837 | 159.5 |
| B | 12 | 111 | 18405 | 110.15 | 854 | 837 | 159.5 |
| C | 0 | 207 | 270750 | 1383.26 | 839 | 849 | 195.1 |
| C | 14 | 238 | 132191 | 673.14 | 839 | 849 | 195.1 |
| C | 3 | 233 | 10371 | 48.8 | 839 | 849 | 195.1 |
| D | 1 | 52 | 599138 | 2923.22 | 849 | 828 | 204.7 |
| D | 7 | 238 | 141053 | 685.11 | 849 | 828 | 204.7 |
| D | 2 | 234 | 24850 | 117.37 | 849 | 828 | 204.7 |
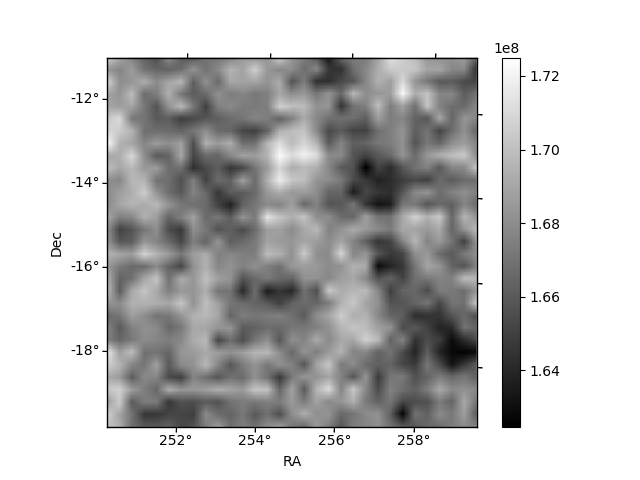
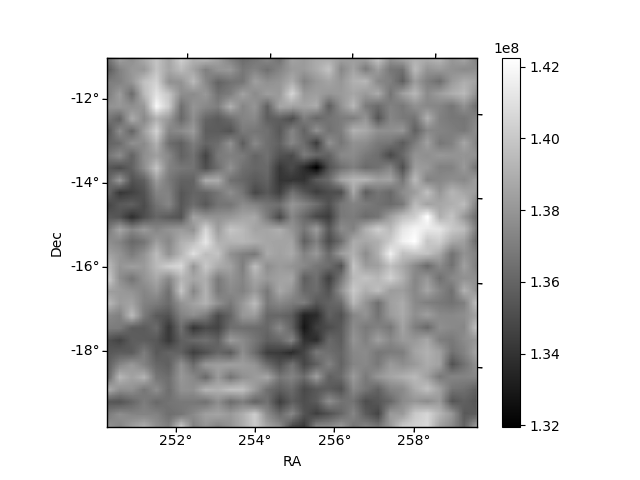
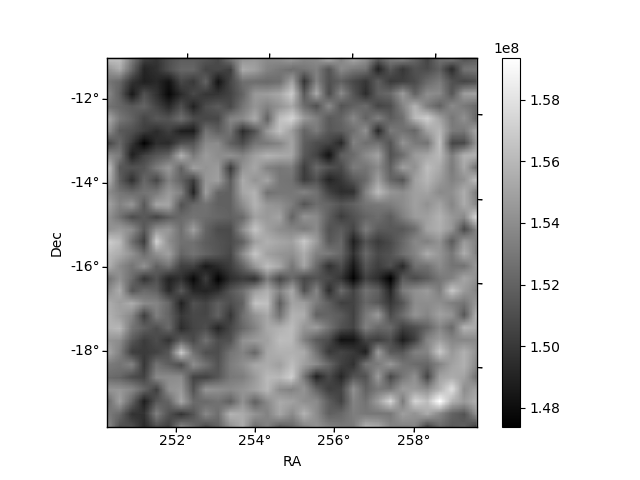
Histogram calculated using DETX and DETY for each event in the final _common_clean file
| Quadrant A | 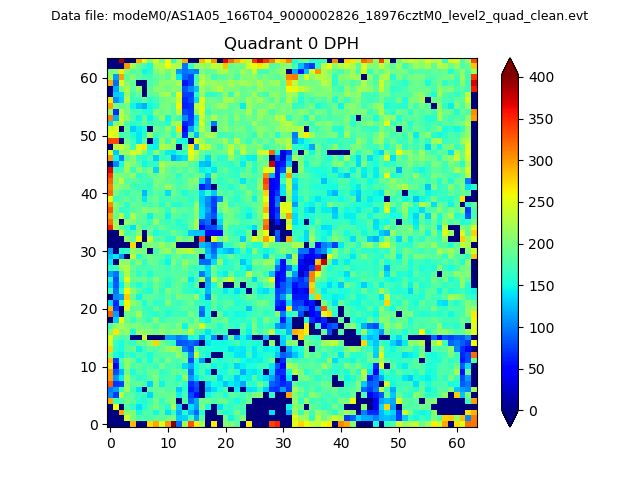 |
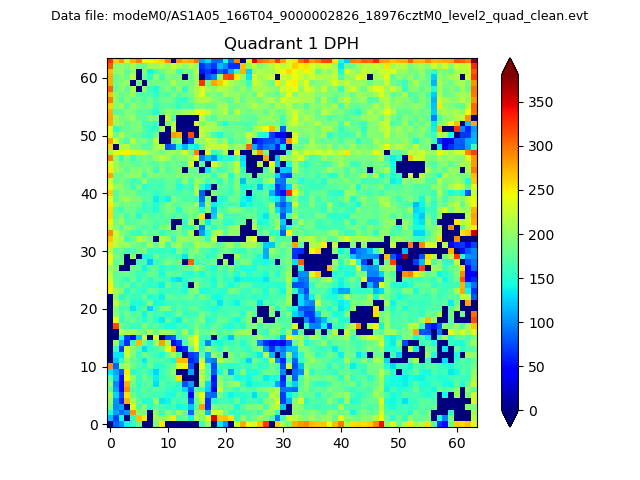 |
Quadrant B |
|---|---|---|---|
| Quadrant D | 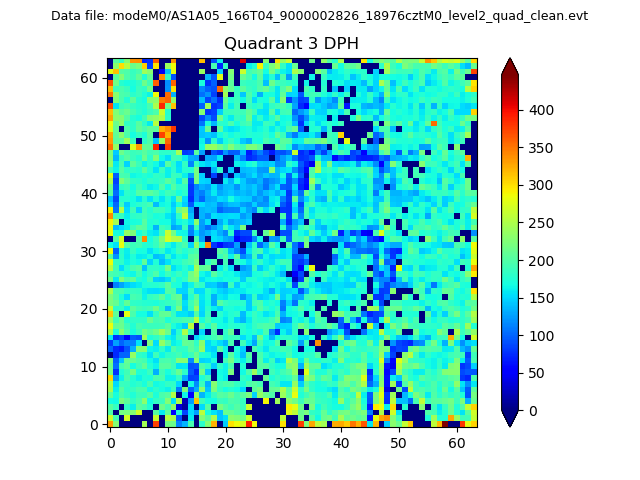 |
 |
Quadrant C |
| Plot type | Count rate plots | Images |
|---|---|---|
| Comparison with Poisson distribution Blue bars denote a histogram of data divided into 1 sec bins. Red curve is a Poisson curve with rate = median count rate of data. |
 |
 |
| Quadrant-wise count rates Data is divided into 100 sec bins |
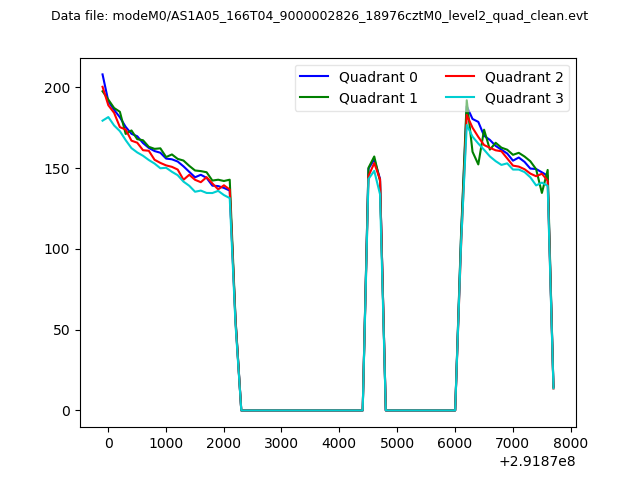 |
|
| Module-wise count rates for Quadrant A Data is divided into 100 sec bins |
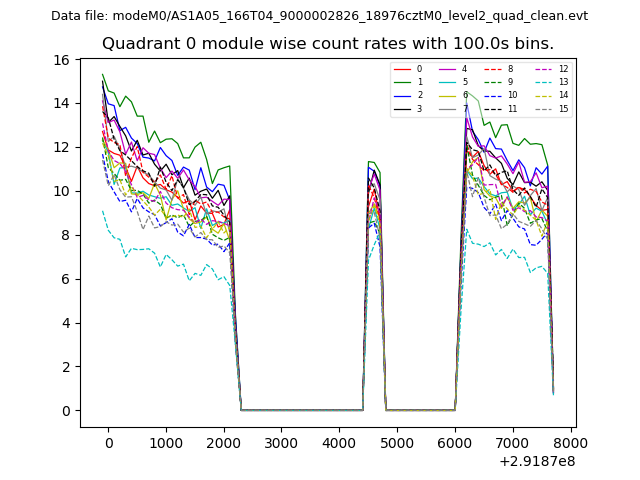 |
 |
| Module-wise count rates for Quadrant B Data is divided into 100 sec bins |
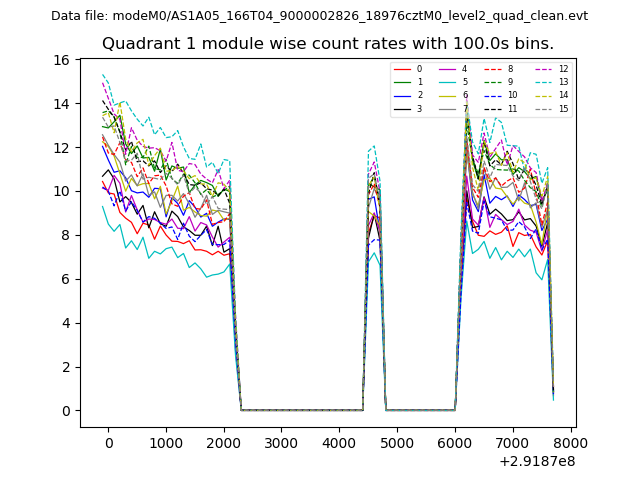 |
 |
| Module-wise count rates for Quadrant C Data is divided into 100 sec bins |
 |
 |
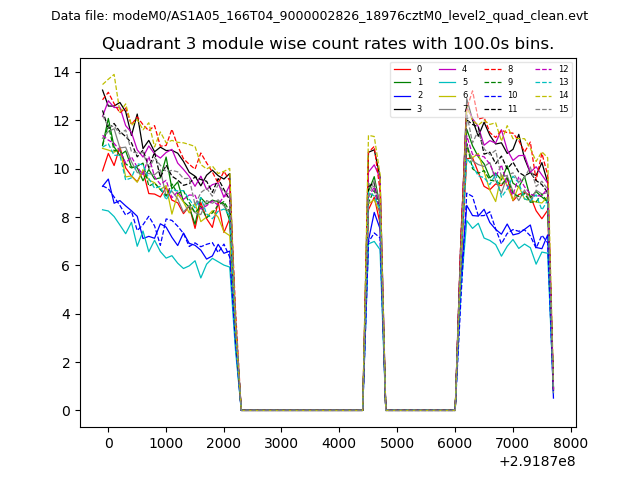
| Module-wise count rates for Quadrant D Data is divided into 100 sec bins |
 |
 |
| Parameter | Plot |
|---|---|
| CZT HV Monitor | 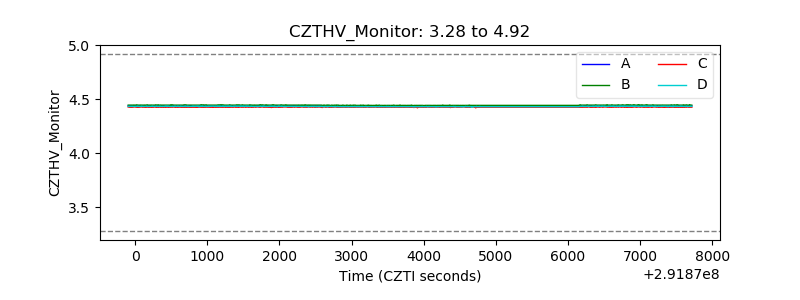 |
| D_VDD | 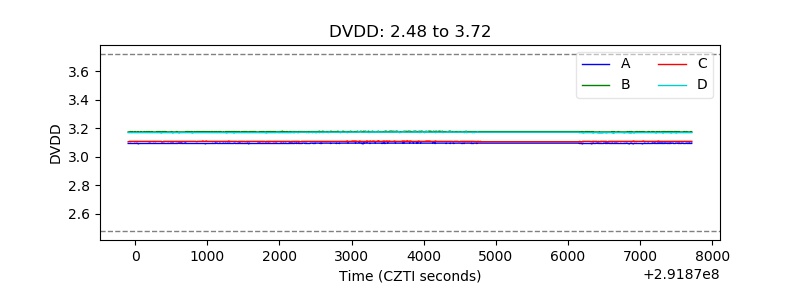 |
| Temperature 1 | 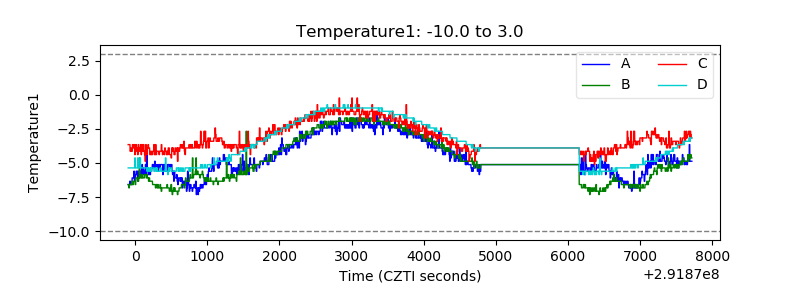 |
| Veto HV Monitor | 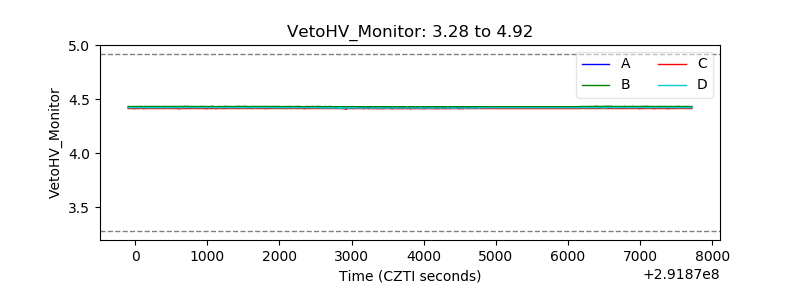 |
| Veto LLD | 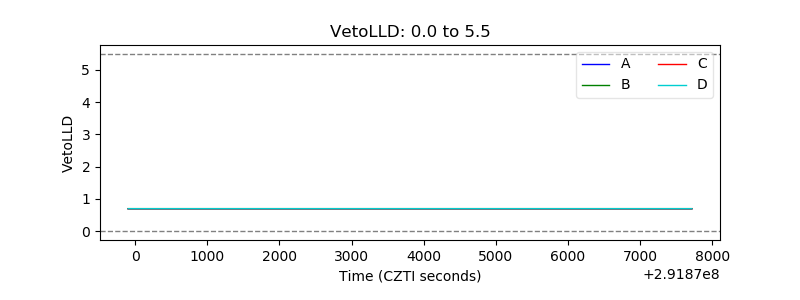 |
| Alpha Counter |  |
| _CPM_Rate | 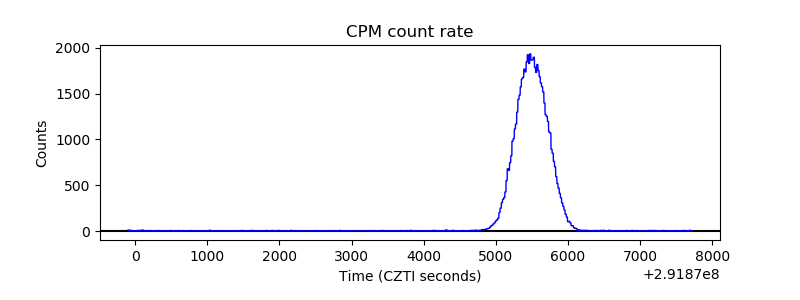 |
| CZT Counter |  |
| +2.5 Volts monitor |  |
| +5 Volts monitor |  |
| _ROLL_ROT | 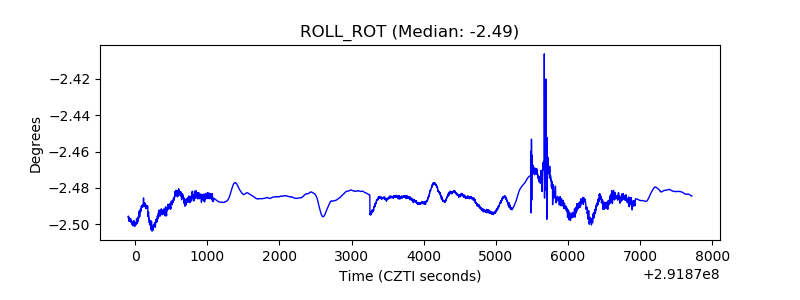 |
| _Roll_DEC | 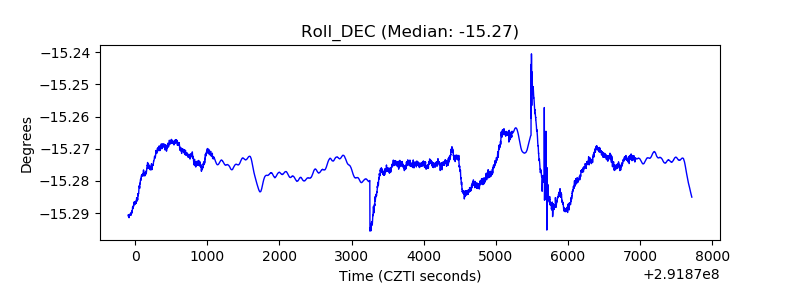 |
| _Roll_RA | 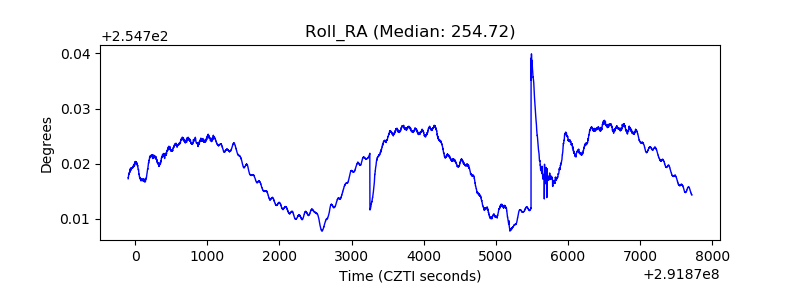 |
| Veto Counter | 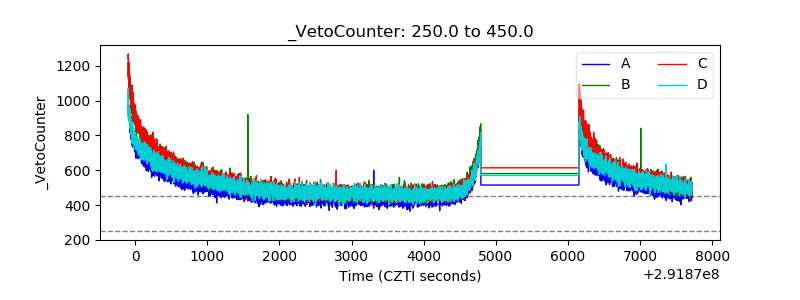 |