| Param | Original file | Final file |
|---|---|---|
| Filename | modeM0/AS1A05_166T04_9000002826_18977cztM0_level2.evt | modeM0/AS1A05_166T04_9000002826_18977cztM0_level2_quad_clean.evt |
| Size (bytes) | 546,088,320 | 97,608,960 |
| Size | 520.8 MB | 93.1 MB |
| Events in quadrant A | 3,302,534 | 640,489 |
| Events in quadrant B | 5,513,687 | 637,554 |
| Events in quadrant C | 3,533,546 | 622,608 |
| Events in quadrant D | 3,753,883 | 608,112 |
| Mode SS | |||
|---|---|---|---|
| Quadrant | BADHDUFLAG | Total packets | Discarded packets |
| A | 0 | 132 | 0 |
| B | 0 | 132 | 0 |
| C | 0 | 132 | 0 |
| D | 0 | 132 | 0 |
| Mode M9 | |||
|---|---|---|---|
| Quadrant | BADHDUFLAG | Total packets | Discarded packets |
| A | 0 | 15 | 0 |
| B | 0 | 16 | 0 |
| C | 0 | 16 | 0 |
| D | 0 | 16 | 0 |
| Mode M0 | |||
|---|---|---|---|
| Quadrant | BADHDUFLAG | Total packets | Discarded packets |
| A | 0 | 13460 | 2 |
| B | 0 | 20501 | 2 |
| C | 0 | 14206 | 2 |
| D | 0 | 15164 | 2 |
| Quadrant | Total seconds | Saturated seconds | Saturation percentage |
|---|---|---|---|
| A | 6404 | 62 | 0.968145% |
| B | 6404 | 765 | 11.945659% |
| C | 6404 | 127 | 1.983136% |
| D | 6404 | 42 | 0.655840% |
Noise dominated data is calculated using 1-second bins in cleaned event files. If a bin has >2000 counts, and if more than 50% of those come from <1% of pixels, then it is considered to be noise-dominated and hence unusable.
| Quadrant | # 1 sec bins | Bins with >0 counts | Bins with >2000 counts | High rate bins dominated by noise | Noise dominated (total time) | Noise dominated (detector-on time) | Marked lightcurve |
|---|---|---|---|---|---|---|---|
| A | 7684 | 6405 | 0 | 0 | 0.00% | 0.00% | 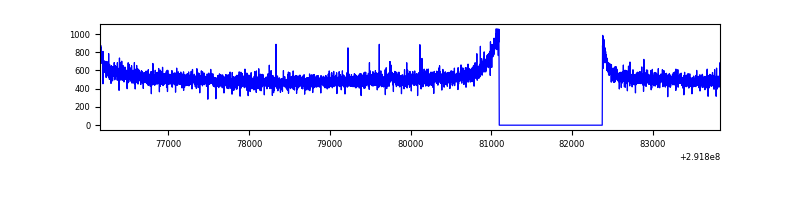 |
| B | 7684 | 6405 | 514 | 514 | 6.69% | 8.02% | 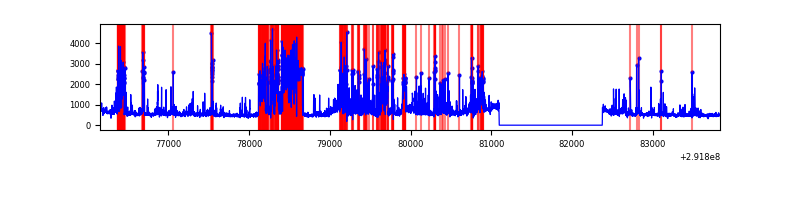 |
| C | 7684 | 6405 | 17 | 17 | 0.22% | 0.27% | 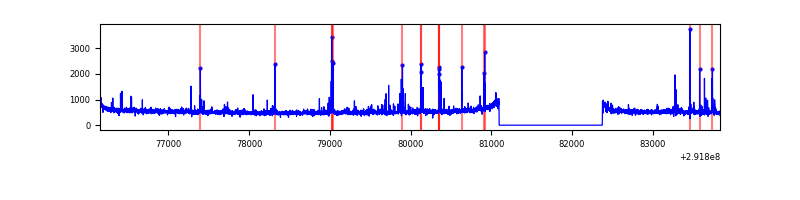 |
| D | 7684 | 6405 | 7 | 7 | 0.09% | 0.11% | 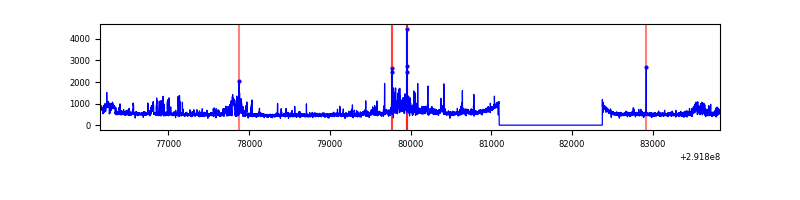 |
Top three noisy pixels from each quadrant. If the there are fewer than three noisy pixels in the level2.evt file, extra rows are filled as -1
| Pixel properties | Quadrant properties | ||||||
|---|---|---|---|---|---|---|---|
| Quadrant | DetID | PixID | Counts | Sigma | Mean | Median | Sigma |
| A | 11 | 29 | 7771 | 40.2 | 855 | 837 | 172.5 |
| A | 0 | 226 | 7539 | 38.86 | 855 | 837 | 172.5 |
| A | 13 | 254 | 6773 | 34.42 | 855 | 837 | 172.5 |
| B | 3 | 112 | 2219781 | 14554.31 | 809 | 791 | 152.5 |
| B | 7 | 220 | 84712 | 550.43 | 809 | 791 | 152.5 |
| B | 4 | 216 | 19049 | 119.75 | 809 | 791 | 152.5 |
| C | 0 | 207 | 200264 | 1052.53 | 819 | 828 | 189.5 |
| C | 14 | 238 | 128873 | 675.76 | 819 | 828 | 189.5 |
| C | 3 | 233 | 9249 | 44.44 | 819 | 828 | 189.5 |
| D | 7 | 238 | 259118 | 1273.2 | 837 | 815 | 202.9 |
| D | 1 | 52 | 187403 | 919.71 | 837 | 815 | 202.9 |
| D | 12 | 218 | 119932 | 587.14 | 837 | 815 | 202.9 |
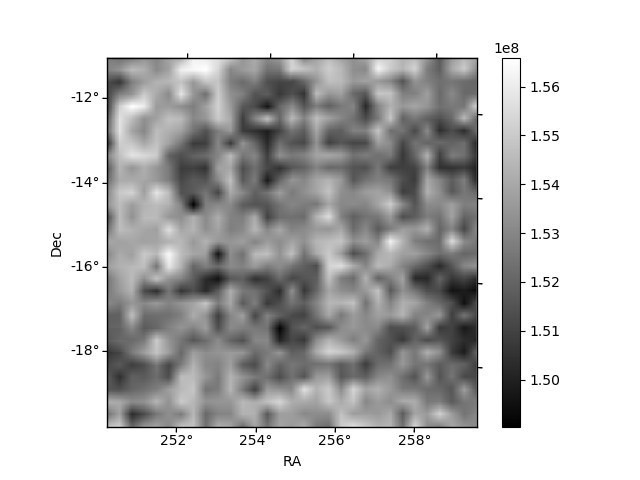
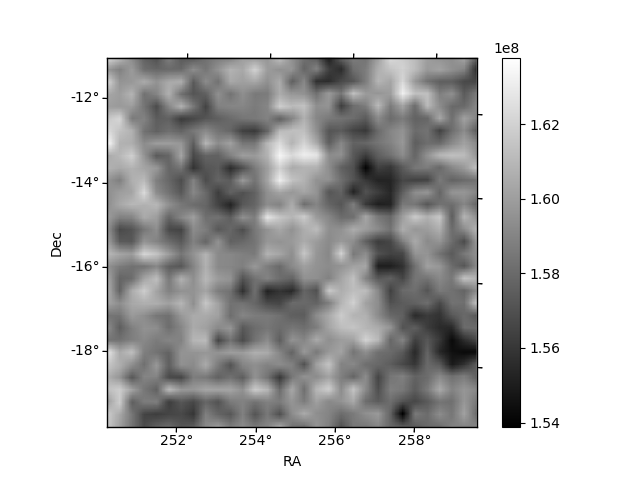
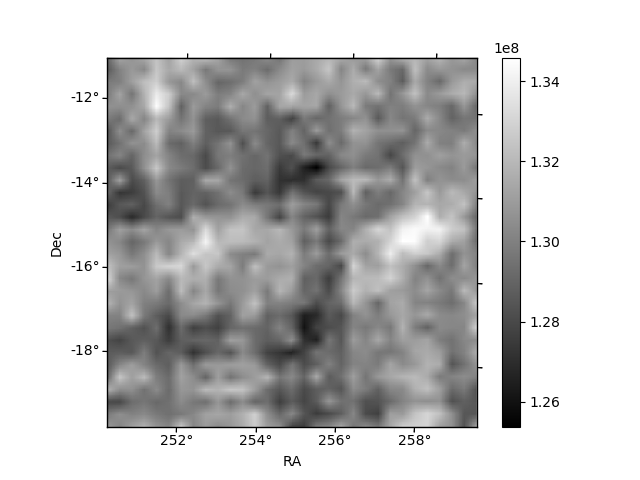
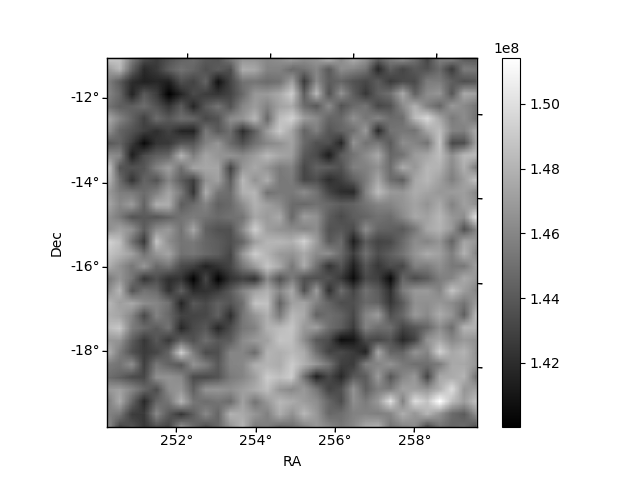
Histogram calculated using DETX and DETY for each event in the final _common_clean file
| Quadrant A |  |
 |
Quadrant B |
|---|---|---|---|
| Quadrant D |  |
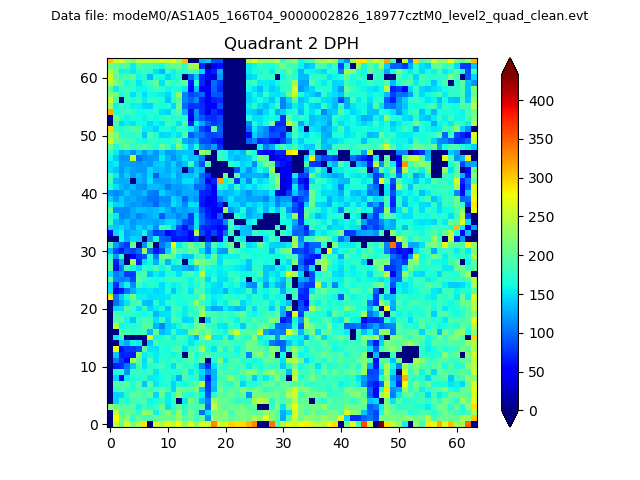 |
Quadrant C |
| Plot type | Count rate plots | Images |
|---|---|---|
| Comparison with Poisson distribution Blue bars denote a histogram of data divided into 1 sec bins. Red curve is a Poisson curve with rate = median count rate of data. |
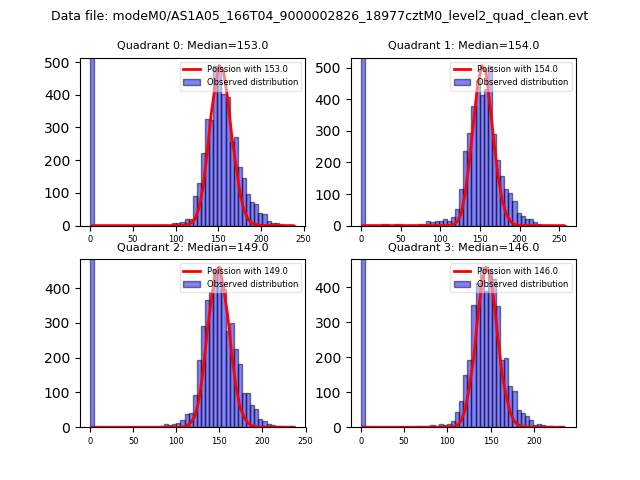 |
 |
| Quadrant-wise count rates Data is divided into 100 sec bins |
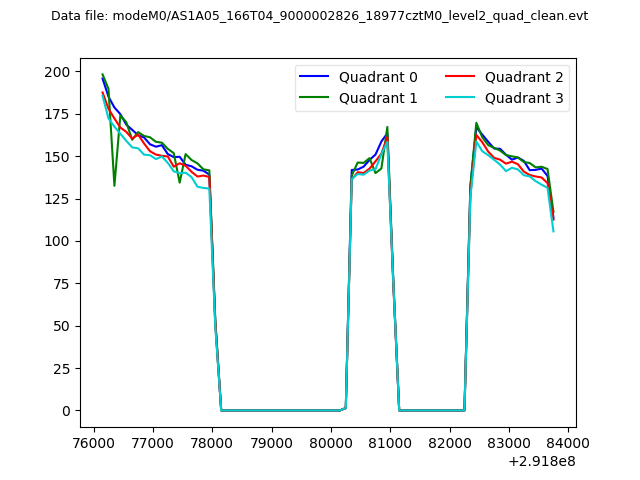 |
|
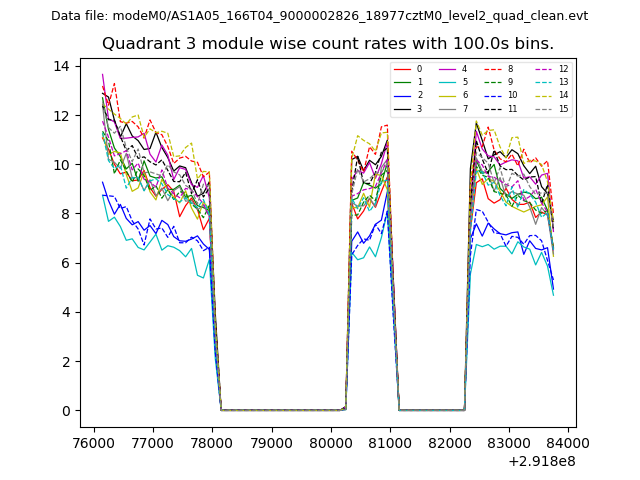
| Module-wise count rates for Quadrant A Data is divided into 100 sec bins |
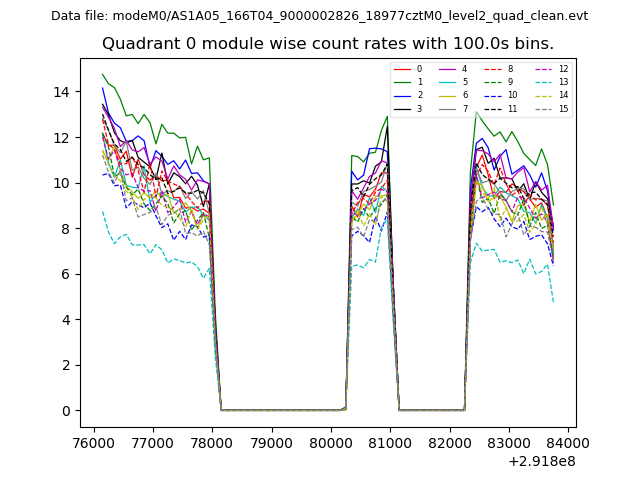 |
 |
| Module-wise count rates for Quadrant B Data is divided into 100 sec bins |
 |
 |
| Module-wise count rates for Quadrant C Data is divided into 100 sec bins |
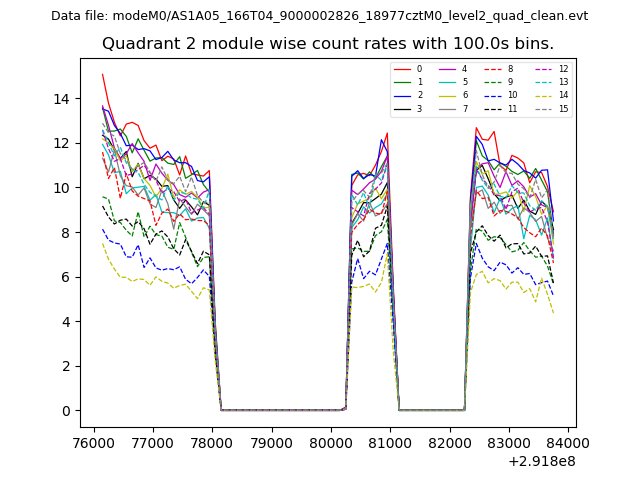 |
 |
| Module-wise count rates for Quadrant D Data is divided into 100 sec bins |
 |
 |
| Parameter | Plot |
|---|---|
| CZT HV Monitor |  |
| D_VDD | 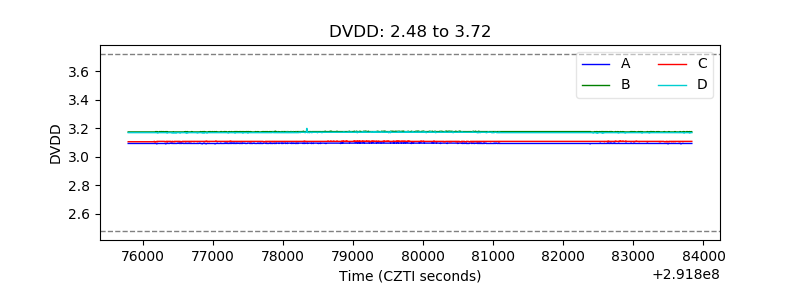 |
| Temperature 1 | 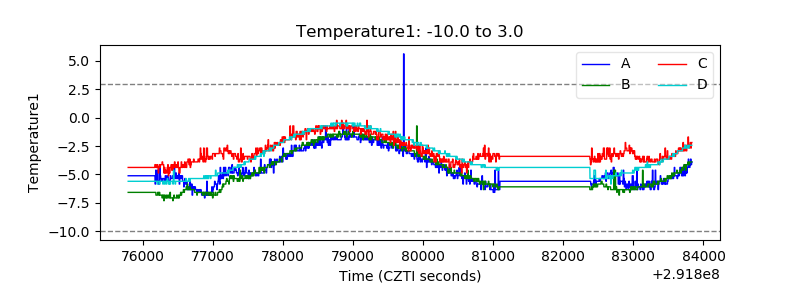 |
| Veto HV Monitor | 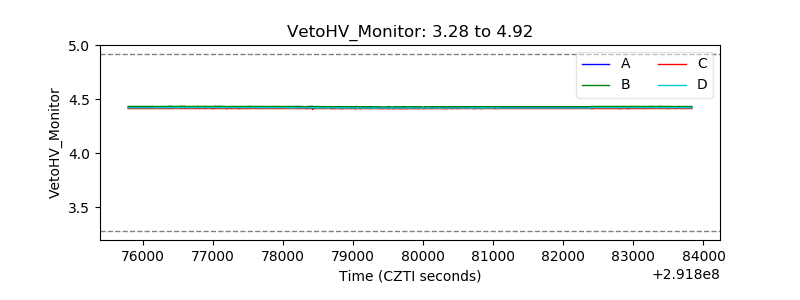 |
| Veto LLD | 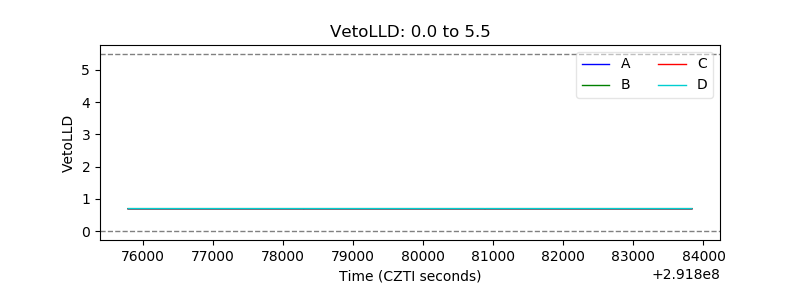 |
| Alpha Counter | 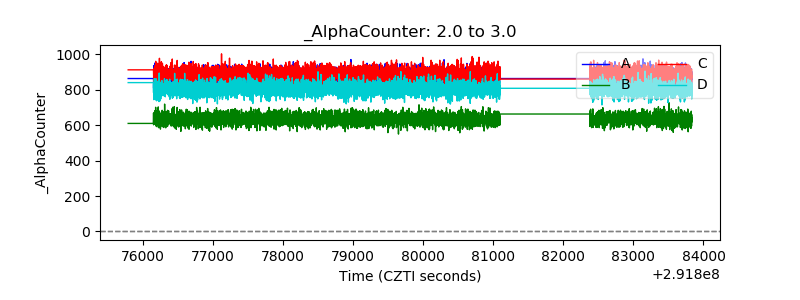 |
| _CPM_Rate | 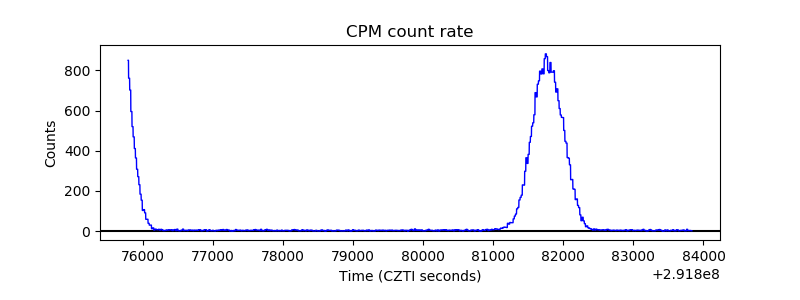 |
| CZT Counter | 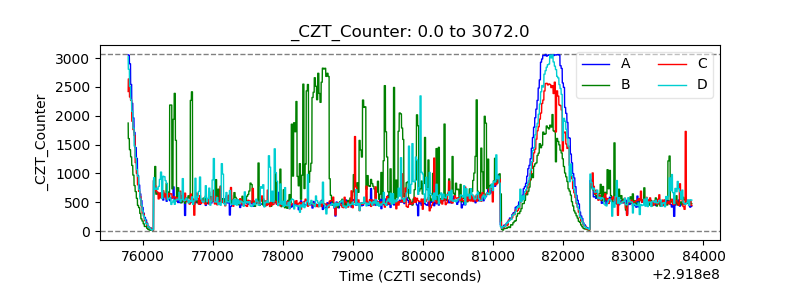 |
| +2.5 Volts monitor |  |
| +5 Volts monitor | 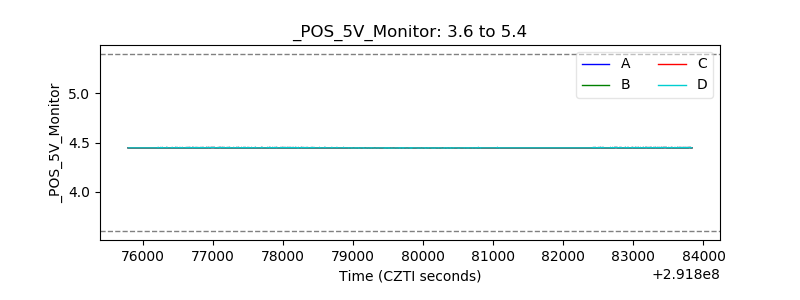 |
| _ROLL_ROT | 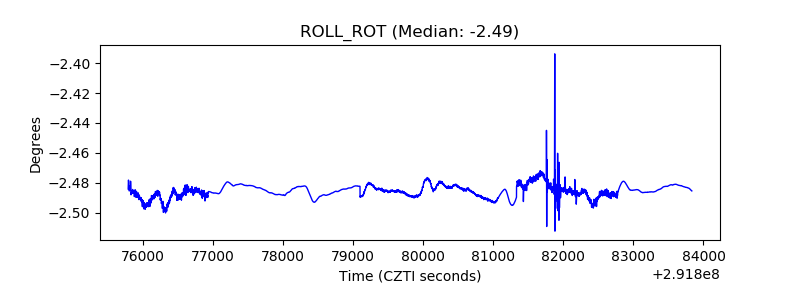 |
| _Roll_DEC | 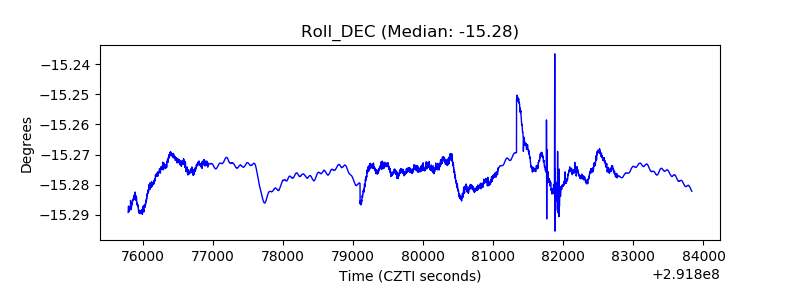 |
| _Roll_RA | 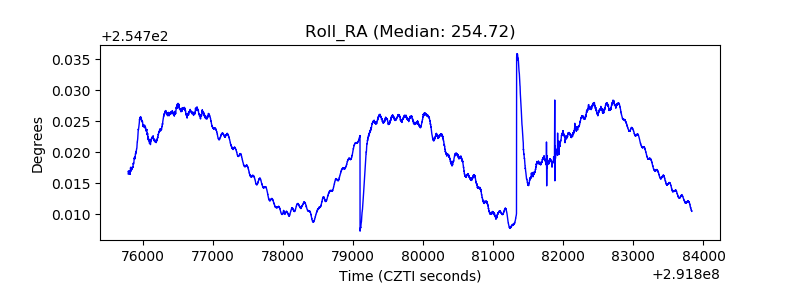 |
| Veto Counter | 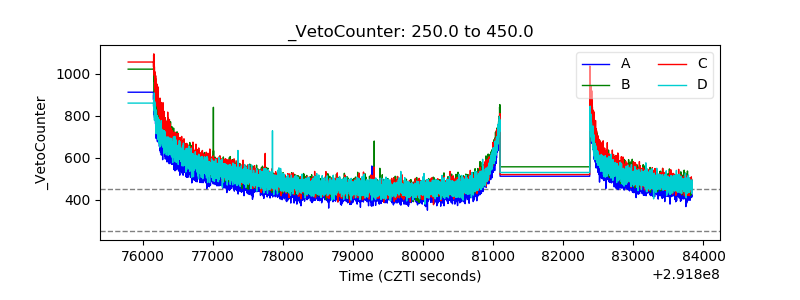 |