| Param | Original file | Final file |
|---|---|---|
| Filename | modeM0/AS1A05_166T04_9000002826_18978cztM0_level2.evt | modeM0/AS1A05_166T04_9000002826_18978cztM0_level2_quad_clean.evt |
| Size (bytes) | 502,041,600 | 76,282,560 |
| Size | 478.8 MB | 72.7 MB |
| Events in quadrant A | 2,896,945 | 483,461 |
| Events in quadrant B | 3,262,793 | 493,005 |
| Events in quadrant C | 3,078,378 | 477,788 |
| Events in quadrant D | 5,573,494 | 450,935 |
| Mode SS | |||
|---|---|---|---|
| Quadrant | BADHDUFLAG | Total packets | Discarded packets |
| A | 0 | 118 | 0 |
| B | 0 | 118 | 0 |
| C | 0 | 118 | 0 |
| D | 0 | 118 | 0 |
| Mode M9 | |||
|---|---|---|---|
| Quadrant | BADHDUFLAG | Total packets | Discarded packets |
| A | 0 | 10 | 0 |
| B | 0 | 10 | 0 |
| C | 0 | 10 | 0 |
| D | 0 | 10 | 0 |
| Mode M0 | |||
|---|---|---|---|
| Quadrant | BADHDUFLAG | Total packets | Discarded packets |
| A | 0 | 11997 | 1 |
| B | 0 | 13145 | 1 |
| C | 0 | 12494 | 1 |
| D | 0 | 20563 | 3 |
| Quadrant | Total seconds | Saturated seconds | Saturation percentage |
|---|---|---|---|
| A | 5788 | 115 | 1.986869% |
| B | 5789 | 151 | 2.608395% |
| C | 5789 | 144 | 2.487476% |
| D | 5788 | 618 | 10.677263% |
Noise dominated data is calculated using 1-second bins in cleaned event files. If a bin has >2000 counts, and if more than 50% of those come from <1% of pixels, then it is considered to be noise-dominated and hence unusable.
| Quadrant | # 1 sec bins | Bins with >0 counts | Bins with >2000 counts | High rate bins dominated by noise | Noise dominated (total time) | Noise dominated (detector-on time) | Marked lightcurve |
|---|---|---|---|---|---|---|---|
| A | 6783 | 5789 | 5 | 5 | 0.07% | 0.09% | 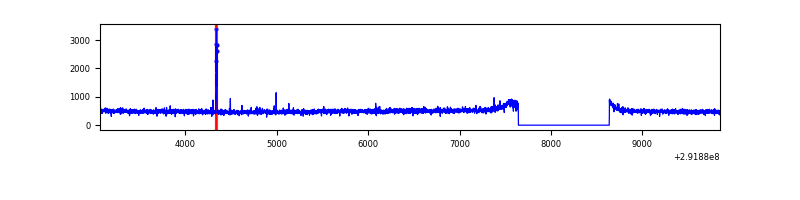 |
| B | 6784 | 5790 | 16 | 16 | 0.24% | 0.28% | 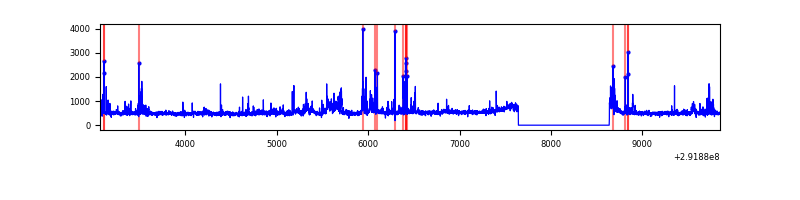 |
| C | 6784 | 5790 | 13 | 13 | 0.19% | 0.22% | 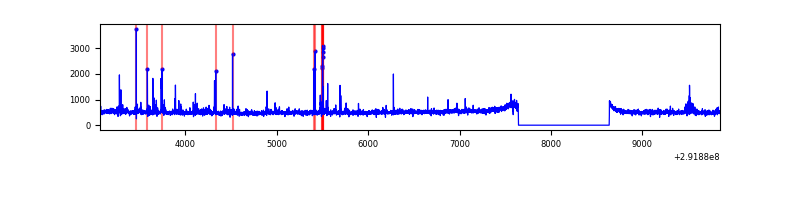 |
| D | 6783 | 5789 | 345 | 345 | 5.09% | 5.96% | 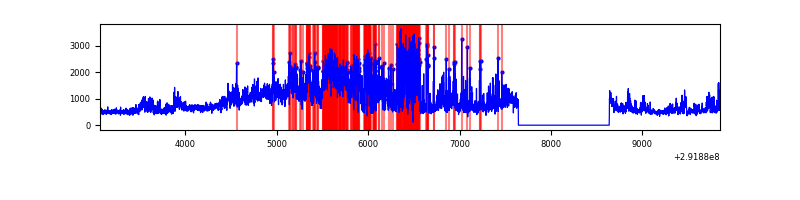 |
Top three noisy pixels from each quadrant. If the there are fewer than three noisy pixels in the level2.evt file, extra rows are filled as -1
| Pixel properties | Quadrant properties | ||||||
|---|---|---|---|---|---|---|---|
| Quadrant | DetID | PixID | Counts | Sigma | Mean | Median | Sigma |
| A | 4 | 2 | 30582 | 200.07 | 742 | 727 | 149.2 |
| A | 0 | 226 | 6431 | 38.22 | 742 | 727 | 149.2 |
| A | 11 | 29 | 6228 | 36.86 | 742 | 727 | 149.2 |
| B | 3 | 112 | 276088 | 1971.28 | 733 | 716 | 139.7 |
| B | 7 | 220 | 36293 | 254.68 | 733 | 716 | 139.7 |
| B | 0 | 197 | 26845 | 187.05 | 733 | 716 | 139.7 |
| C | 0 | 207 | 160099 | 951.43 | 713 | 719 | 167.5 |
| C | 14 | 238 | 109339 | 648.41 | 713 | 719 | 167.5 |
| C | 7 | 220 | 17029 | 97.36 | 713 | 719 | 167.5 |
| D | 7 | 238 | 2533736 | 14529.48 | 709 | 689 | 174.3 |
| D | 1 | 52 | 147121 | 839.93 | 709 | 689 | 174.3 |
| D | 12 | 218 | 87091 | 495.6 | 709 | 689 | 174.3 |
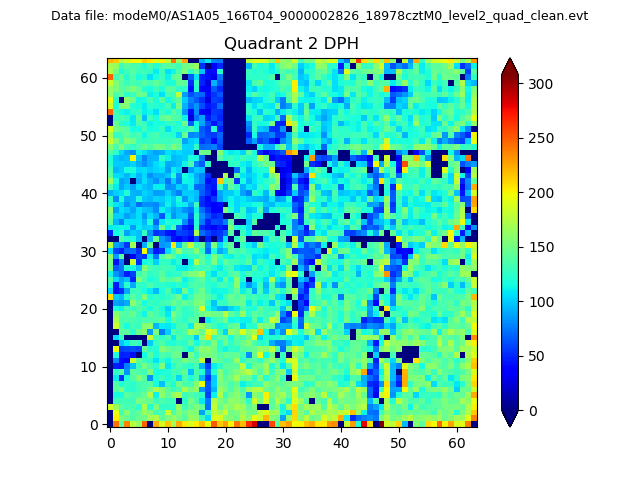
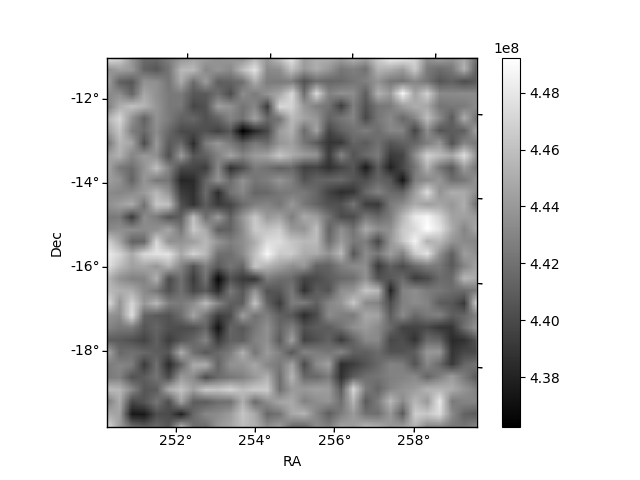
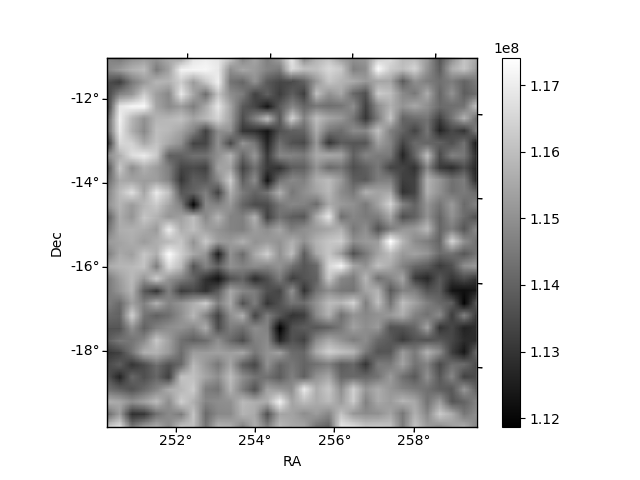
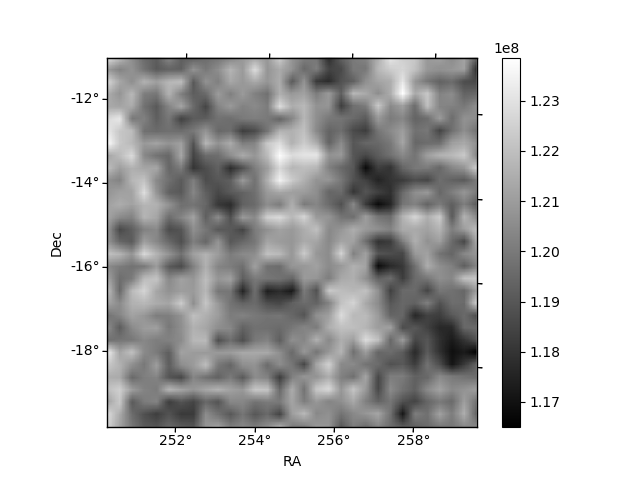
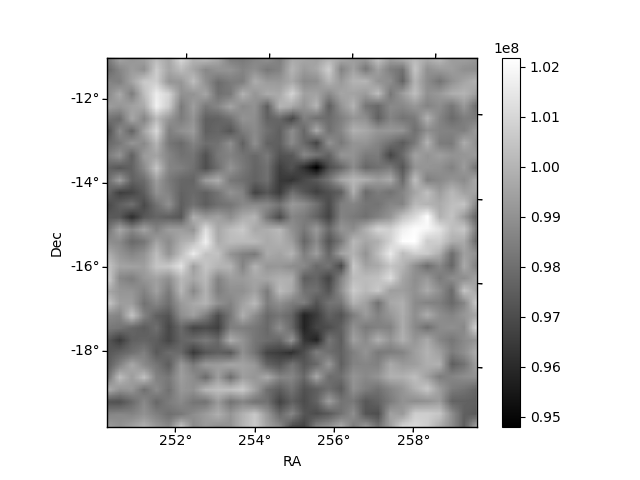
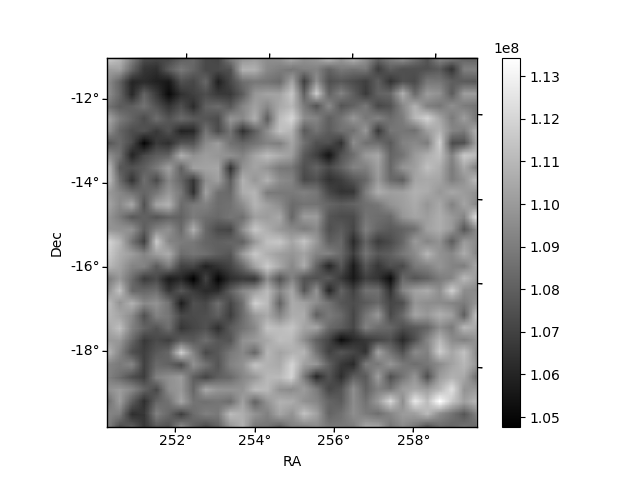
Histogram calculated using DETX and DETY for each event in the final _common_clean file
| Quadrant A | 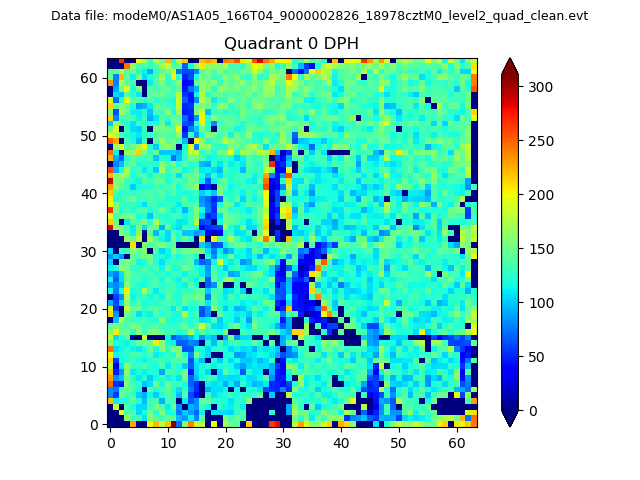 |
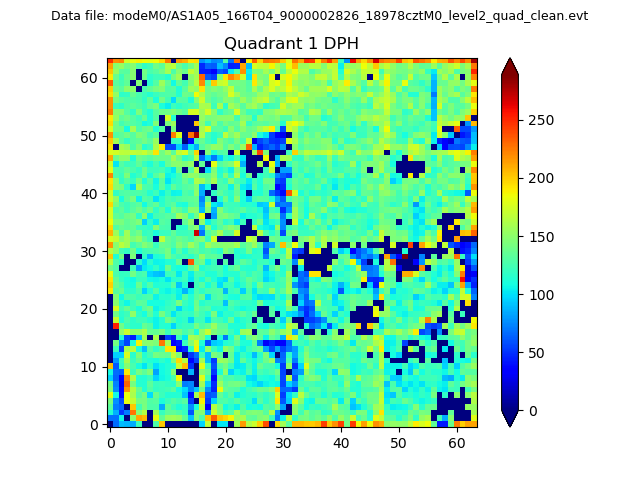 |
Quadrant B |
|---|---|---|---|
| Quadrant D | 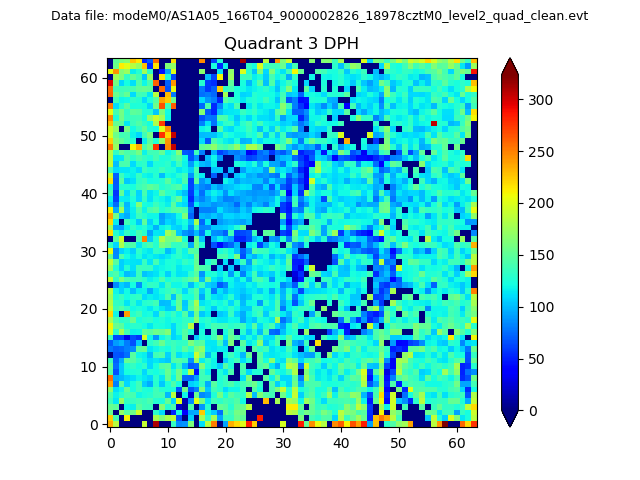 |
 |
Quadrant C |
| Plot type | Count rate plots | Images |
|---|---|---|
| Comparison with Poisson distribution Blue bars denote a histogram of data divided into 1 sec bins. Red curve is a Poisson curve with rate = median count rate of data. |
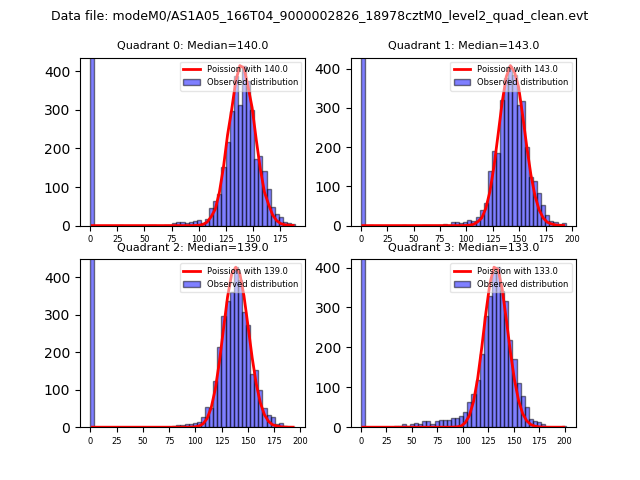 |
 |
| Quadrant-wise count rates Data is divided into 100 sec bins |
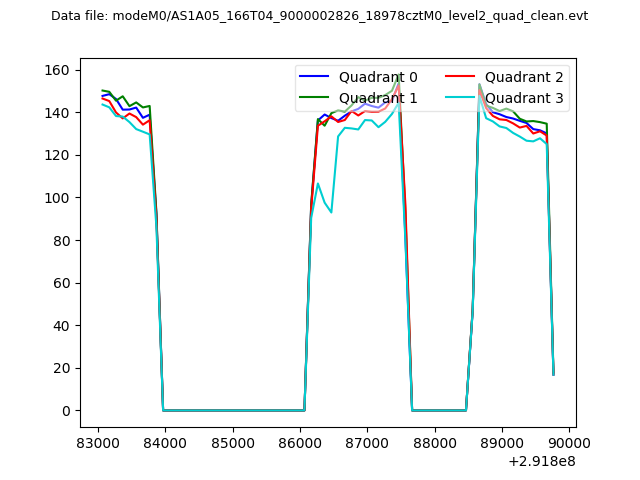 |
|
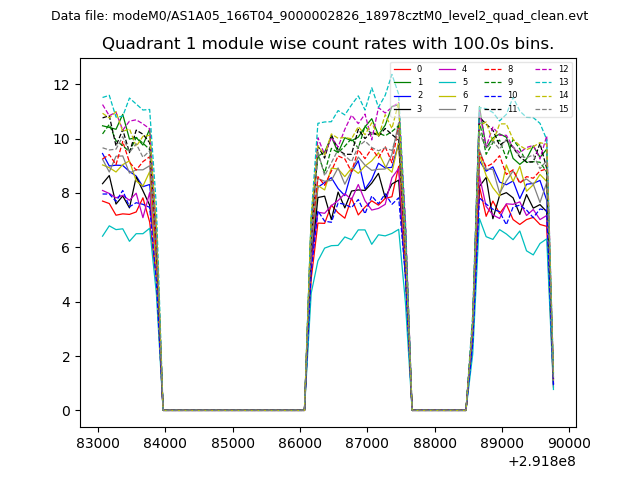
| Module-wise count rates for Quadrant A Data is divided into 100 sec bins |
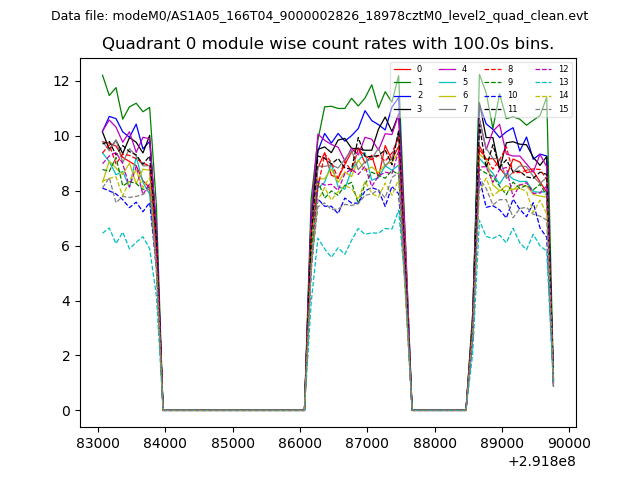 |
 |
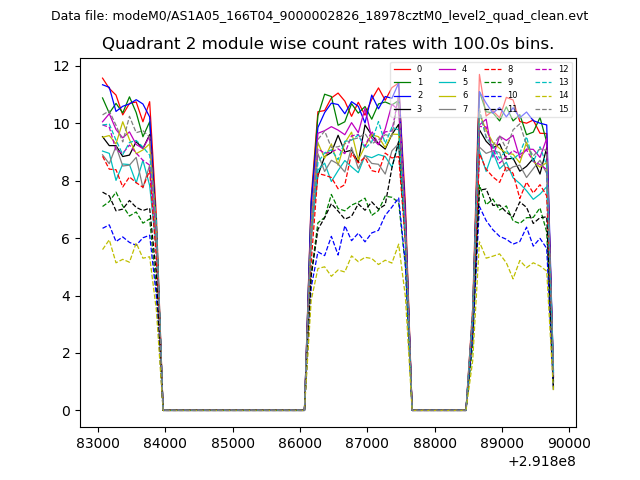
| Module-wise count rates for Quadrant B Data is divided into 100 sec bins |
 |
 |
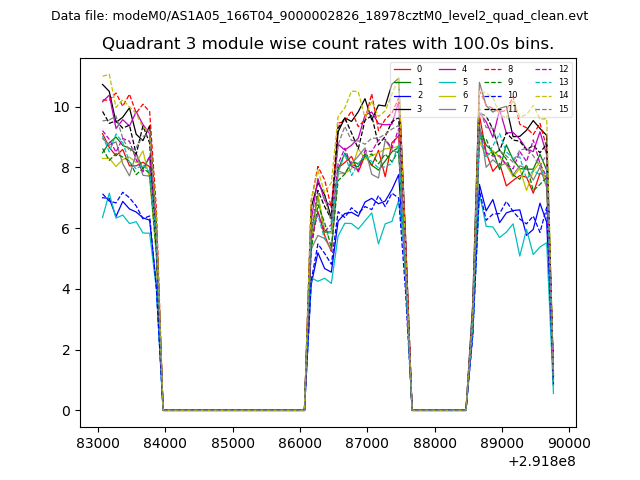
| Module-wise count rates for Quadrant C Data is divided into 100 sec bins |
 |
 |
| Module-wise count rates for Quadrant D Data is divided into 100 sec bins |
 |
 |
| Parameter | Plot |
|---|---|
| CZT HV Monitor | 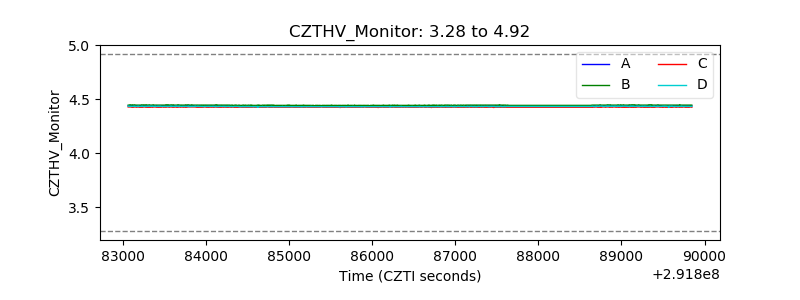 |
| D_VDD | 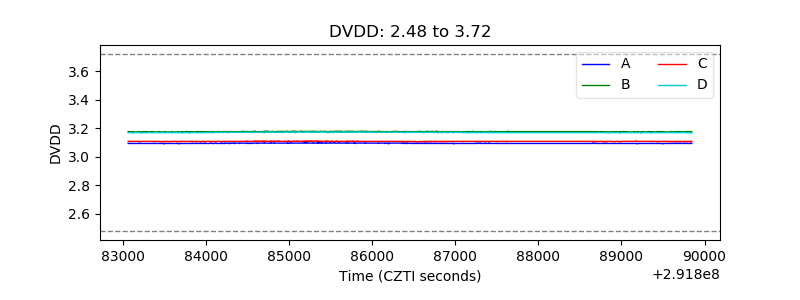 |
| Temperature 1 | 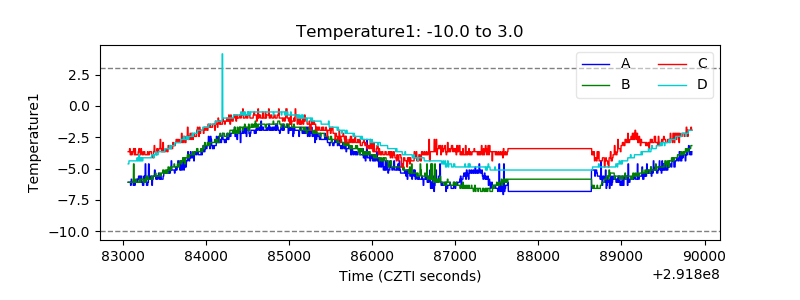 |
| Veto HV Monitor | 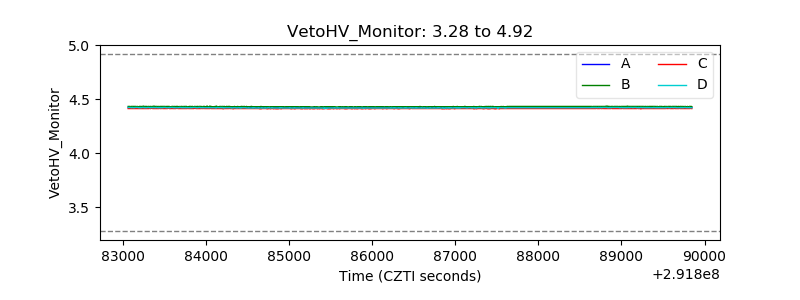 |
| Veto LLD | 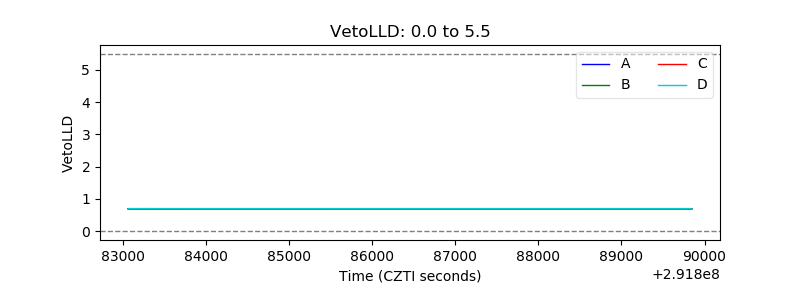 |
| Alpha Counter | 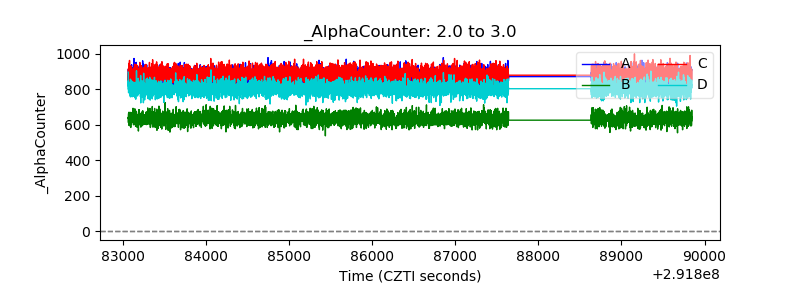 |
| _CPM_Rate | 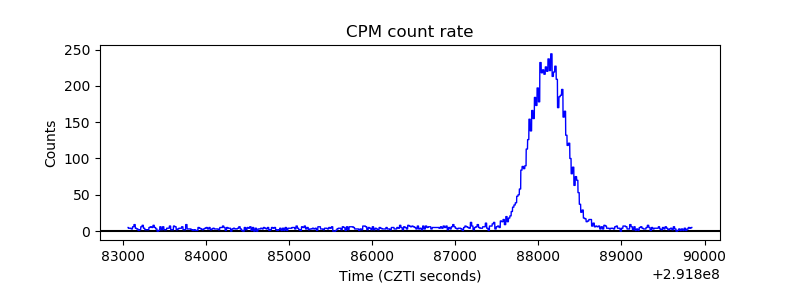 |
| CZT Counter | 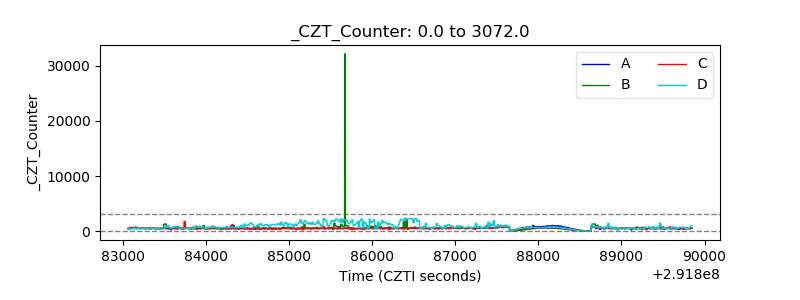 |
| +2.5 Volts monitor |  |
| +5 Volts monitor | 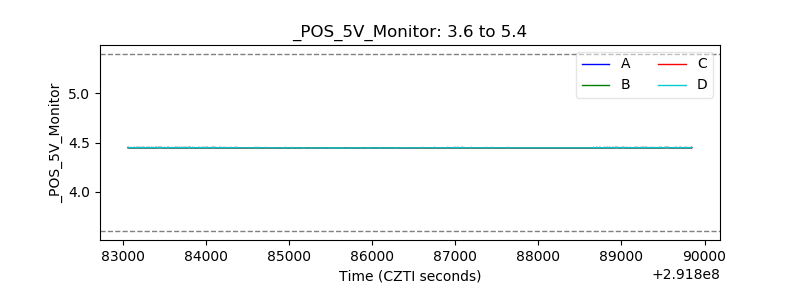 |
| _ROLL_ROT | 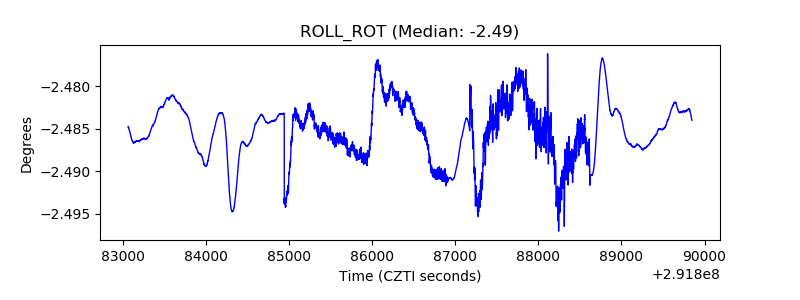 |
| _Roll_DEC | 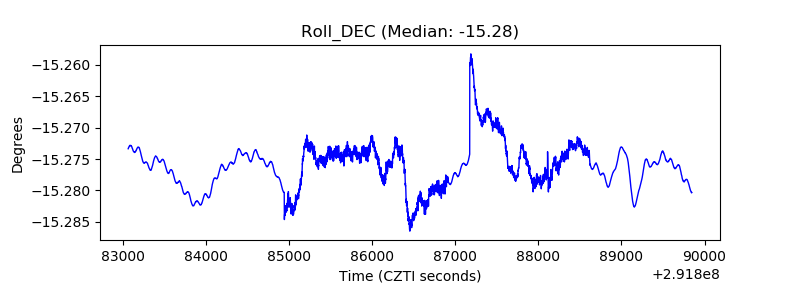 |
| _Roll_RA | 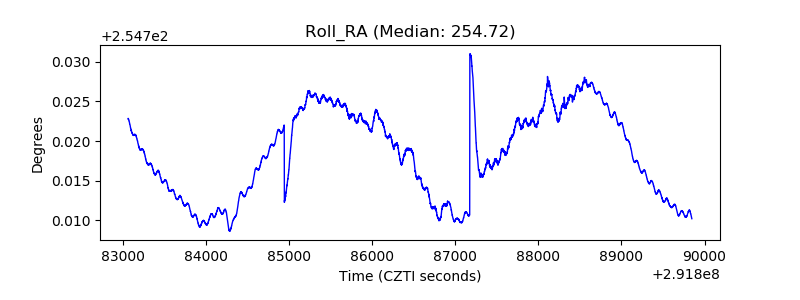 |
| Veto Counter | 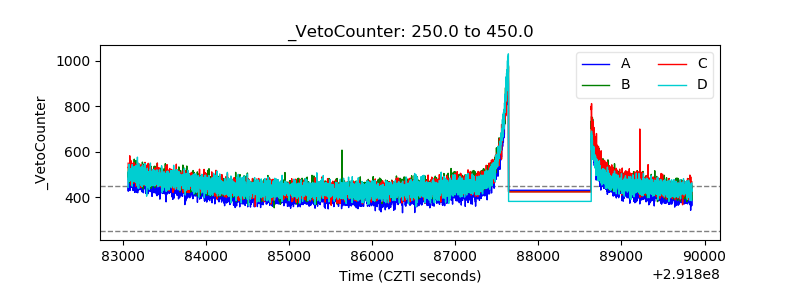 |