| Param | Original file | Final file |
|---|---|---|
| Filename | modeM0/AS1A05_166T04_9000002826_18979cztM0_level2.evt | modeM0/AS1A05_166T04_9000002826_18979cztM0_level2_quad_clean.evt |
| Size (bytes) | 637,312,320 | 89,712,000 |
| Size | 607.8 MB | 85.6 MB |
| Events in quadrant A | 3,595,541 | 558,827 |
| Events in quadrant B | 4,128,116 | 568,023 |
| Events in quadrant C | 3,832,201 | 553,771 |
| Events in quadrant D | 7,242,141 | 518,489 |
| Mode SS | |||
|---|---|---|---|
| Quadrant | BADHDUFLAG | Total packets | Discarded packets |
| A | 0 | 150 | 0 |
| B | 0 | 150 | 0 |
| C | 0 | 150 | 0 |
| D | 0 | 150 | 0 |
| Mode M9 | |||
|---|---|---|---|
| Quadrant | BADHDUFLAG | Total packets | Discarded packets |
| A | 0 | 12 | 0 |
| B | 0 | 13 | 0 |
| C | 0 | 13 | 0 |
| D | 0 | 13 | 0 |
| Mode M0 | |||
|---|---|---|---|
| Quadrant | BADHDUFLAG | Total packets | Discarded packets |
| A | 0 | 15326 | 2 |
| B | 0 | 16802 | 2 |
| C | 0 | 15812 | 2 |
| D | 0 | 26671 | 2 |
| Quadrant | Total seconds | Saturated seconds | Saturation percentage |
|---|---|---|---|
| A | 7432 | 160 | 2.152853% |
| B | 7432 | 232 | 3.121636% |
| C | 7432 | 201 | 2.704521% |
| D | 7432 | 695 | 9.351453% |
Noise dominated data is calculated using 1-second bins in cleaned event files. If a bin has >2000 counts, and if more than 50% of those come from <1% of pixels, then it is considered to be noise-dominated and hence unusable.
| Quadrant | # 1 sec bins | Bins with >0 counts | Bins with >2000 counts | High rate bins dominated by noise | Noise dominated (total time) | Noise dominated (detector-on time) | Marked lightcurve |
|---|---|---|---|---|---|---|---|
| A | 7997 | 7433 | 0 | 0 | 0.00% | 0.00% | 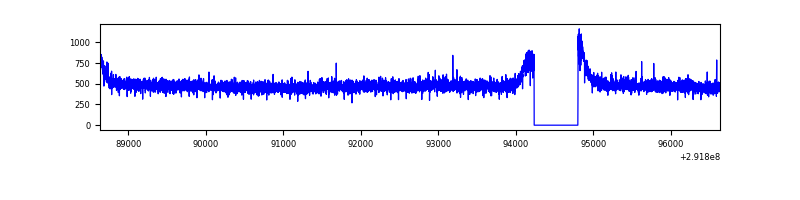 |
| B | 7997 | 7433 | 29 | 29 | 0.36% | 0.39% | 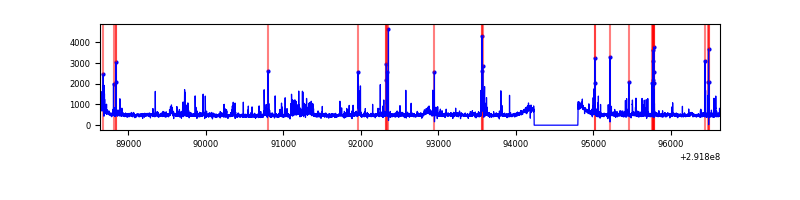 |
| C | 7997 | 7433 | 7 | 7 | 0.09% | 0.09% | 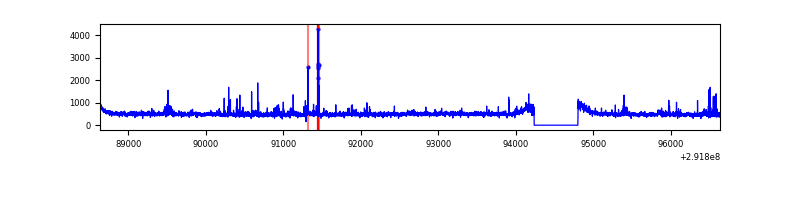 |
| D | 7997 | 7433 | 459 | 459 | 5.74% | 6.18% | 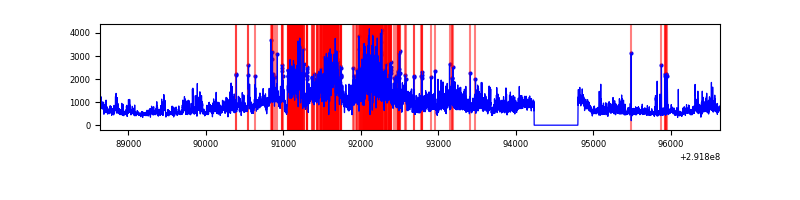 |
Top three noisy pixels from each quadrant. If the there are fewer than three noisy pixels in the level2.evt file, extra rows are filled as -1
| Pixel properties | Quadrant properties | ||||||
|---|---|---|---|---|---|---|---|
| Quadrant | DetID | PixID | Counts | Sigma | Mean | Median | Sigma |
| A | 13 | 254 | 8291 | 39.34 | 930 | 909 | 187.6 |
| A | 0 | 226 | 8089 | 38.26 | 930 | 909 | 187.6 |
| A | 3 | 137 | 7049 | 32.72 | 930 | 909 | 187.6 |
| B | 3 | 112 | 335094 | 1874.37 | 922 | 897 | 178.3 |
| B | 4 | 216 | 83998 | 466.08 | 922 | 897 | 178.3 |
| B | 7 | 220 | 49579 | 273.03 | 922 | 897 | 178.3 |
| C | 0 | 207 | 149980 | 711.01 | 894 | 901 | 209.7 |
| C | 14 | 238 | 137951 | 653.64 | 894 | 901 | 209.7 |
| C | 3 | 233 | 26782 | 123.44 | 894 | 901 | 209.7 |
| D | 7 | 238 | 2555309 | 11827.63 | 889 | 864 | 216.0 |
| D | 12 | 218 | 865508 | 4003.49 | 889 | 864 | 216.0 |
| D | 1 | 52 | 227550 | 1049.61 | 889 | 864 | 216.0 |
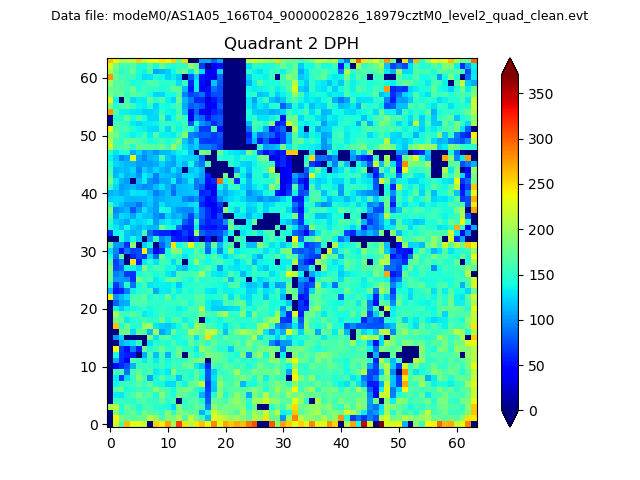
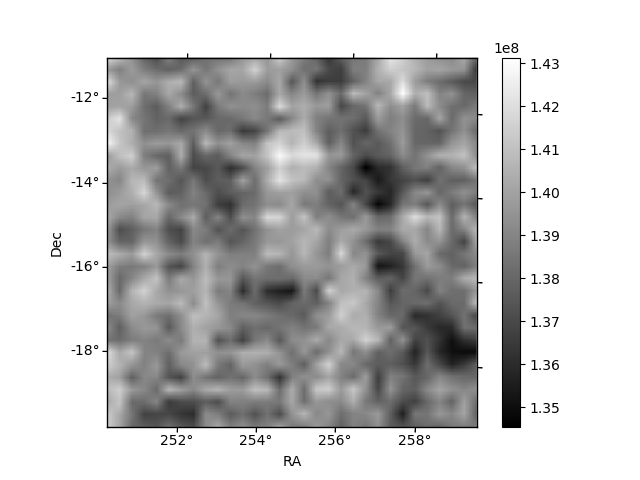
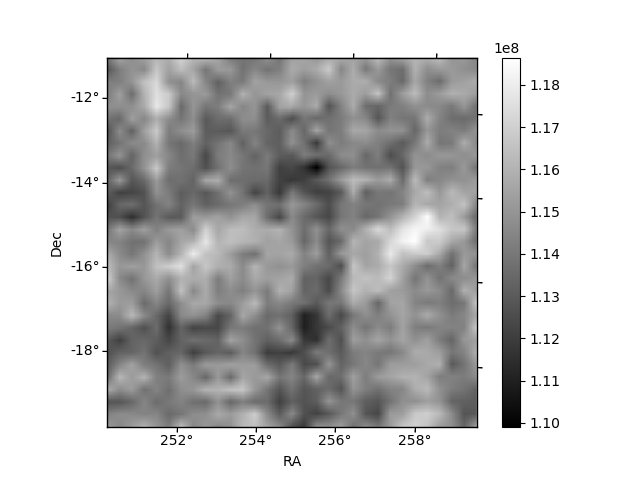
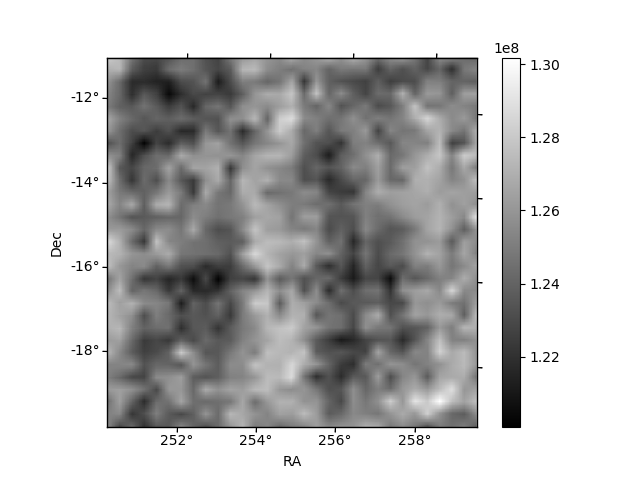
Histogram calculated using DETX and DETY for each event in the final _common_clean file
| Quadrant A | 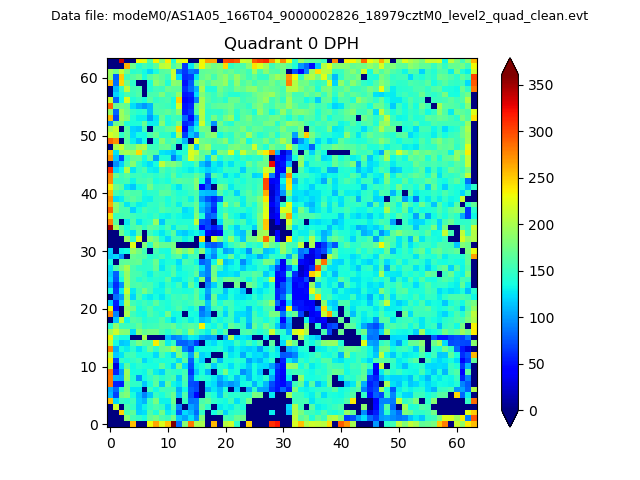 |
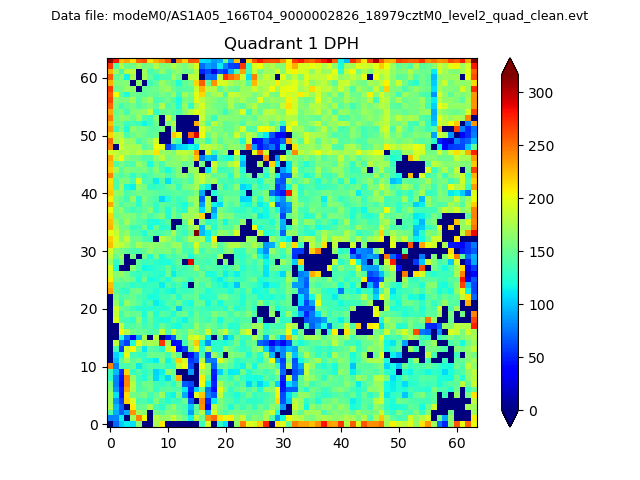 |
Quadrant B |
|---|---|---|---|
| Quadrant D | 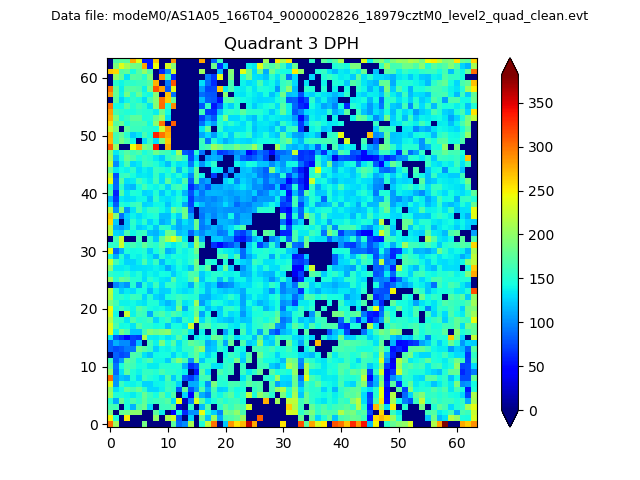 |
 |
Quadrant C |
| Plot type | Count rate plots | Images |
|---|---|---|
| Comparison with Poisson distribution Blue bars denote a histogram of data divided into 1 sec bins. Red curve is a Poisson curve with rate = median count rate of data. |
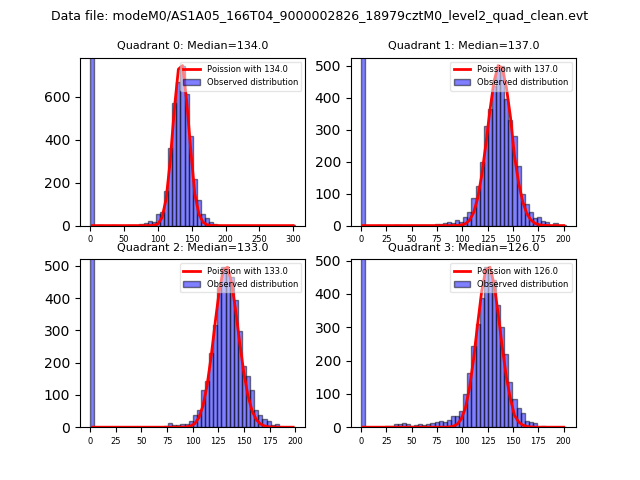 |
 |
| Quadrant-wise count rates Data is divided into 100 sec bins |
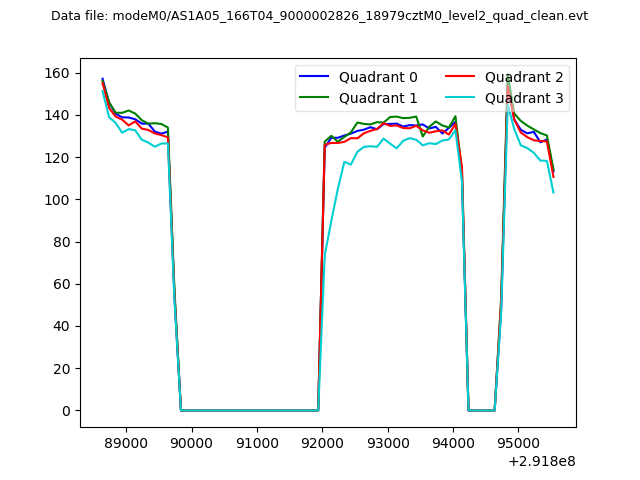 |
|
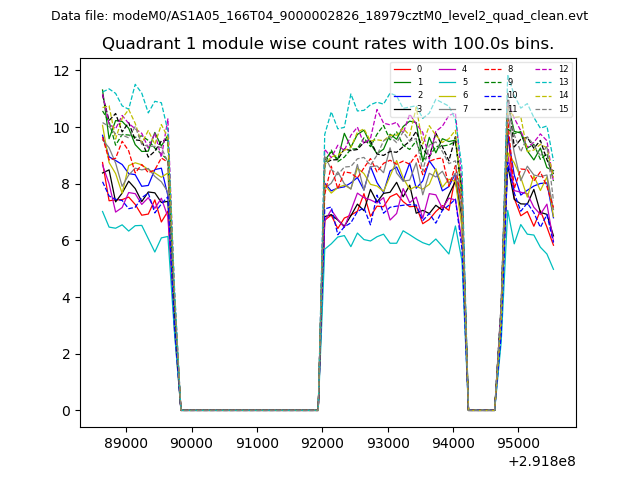
| Module-wise count rates for Quadrant A Data is divided into 100 sec bins |
 |
 |
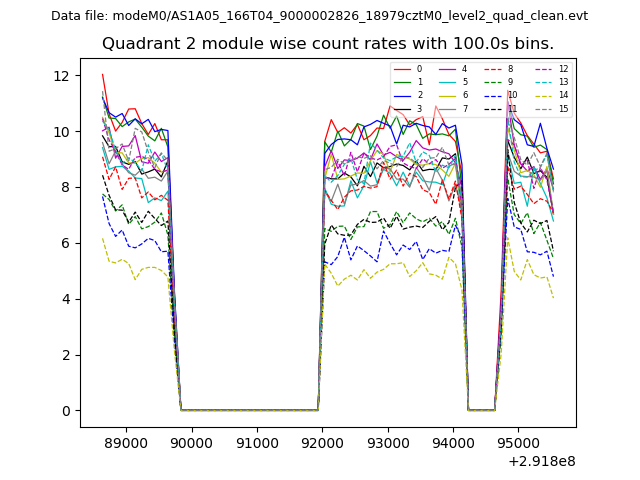
| Module-wise count rates for Quadrant B Data is divided into 100 sec bins |
 |
 |
| Module-wise count rates for Quadrant C Data is divided into 100 sec bins |
 |
 |
| Module-wise count rates for Quadrant D Data is divided into 100 sec bins |
 |
 |
| Parameter | Plot |
|---|---|
| CZT HV Monitor | 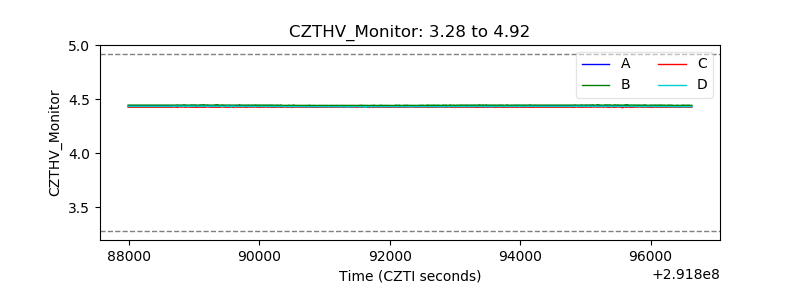 |
| D_VDD | 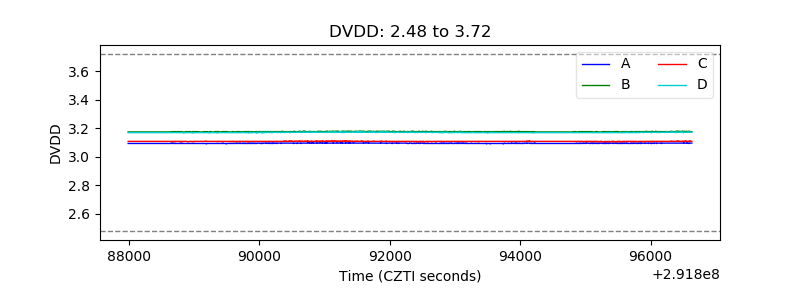 |
| Temperature 1 | 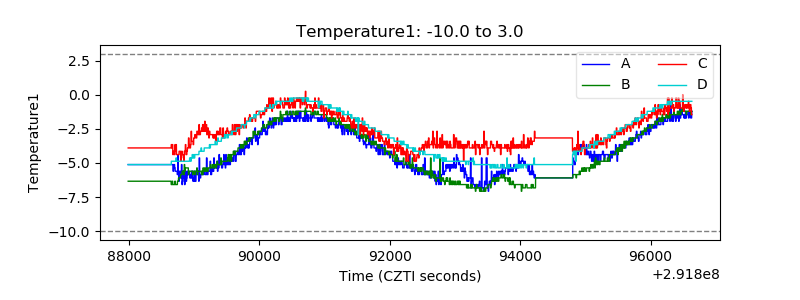 |
| Veto HV Monitor | 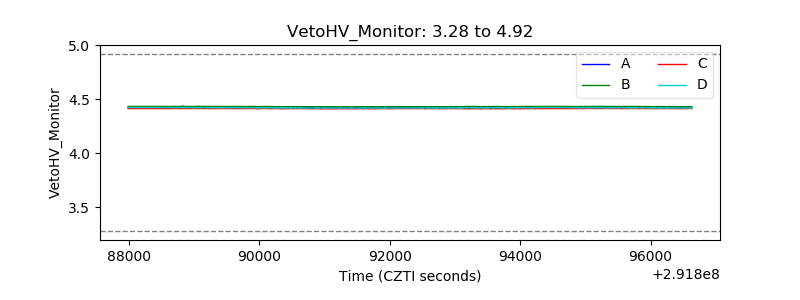 |
| Veto LLD |  |
| Alpha Counter | 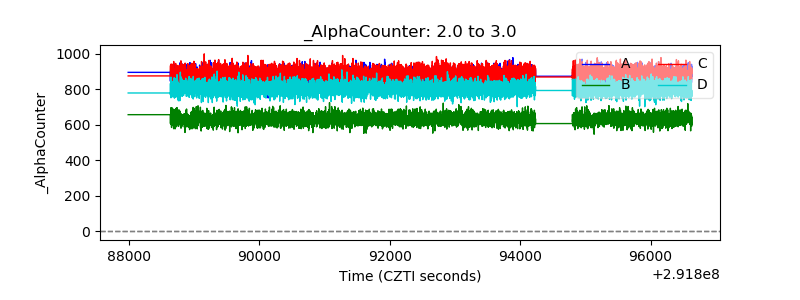 |
| _CPM_Rate | 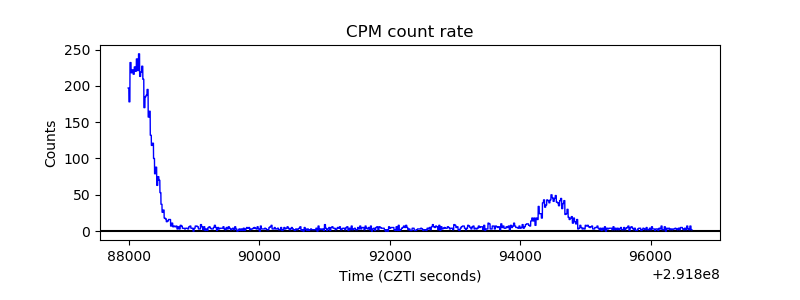 |
| CZT Counter | 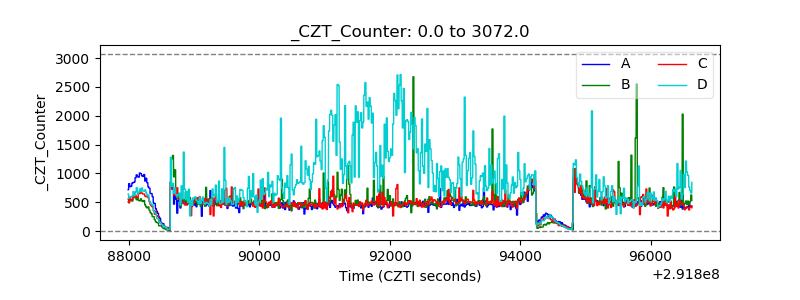 |
| +2.5 Volts monitor |  |
| +5 Volts monitor |  |
| _ROLL_ROT |  |
| _Roll_DEC | 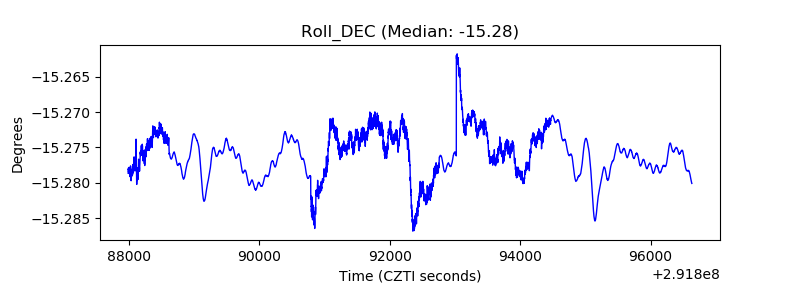 |
| _Roll_RA | 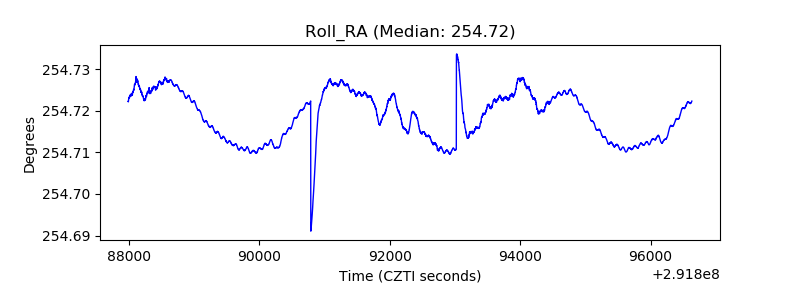 |
| Veto Counter |  |