| Param | Original file | Final file |
|---|---|---|
| Filename | modeM0/AS1A05_166T04_9000002826_18980cztM0_level2.evt | modeM0/AS1A05_166T04_9000002826_18980cztM0_level2_quad_clean.evt |
| Size (bytes) | 688,193,280 | 82,267,200 |
| Size | 656.3 MB | 78.5 MB |
| Events in quadrant A | 3,672,579 | 501,859 |
| Events in quadrant B | 4,267,156 | 508,969 |
| Events in quadrant C | 3,845,089 | 496,427 |
| Events in quadrant D | 8,554,566 | 466,511 |
| Mode SS | |||
|---|---|---|---|
| Quadrant | BADHDUFLAG | Total packets | Discarded packets |
| A | 0 | 150 | 0 |
| B | 0 | 150 | 0 |
| C | 0 | 150 | 0 |
| D | 0 | 150 | 0 |
| Mode M9 | |||
|---|---|---|---|
| Quadrant | BADHDUFLAG | Total packets | Discarded packets |
| A | 0 | 1 | 0 |
| B | 0 | 1 | 0 |
| C | 0 | 1 | 0 |
| D | 0 | 1 | 0 |
| Mode M0 | |||
|---|---|---|---|
| Quadrant | BADHDUFLAG | Total packets | Discarded packets |
| A | 0 | 15695 | 2 |
| B | 0 | 17276 | 2 |
| C | 0 | 16122 | 2 |
| D | 0 | 30600 | 2 |
| Quadrant | Total seconds | Saturated seconds | Saturation percentage |
|---|---|---|---|
| A | 7428 | 253 | 3.406031% |
| B | 7429 | 335 | 4.509355% |
| C | 7429 | 291 | 3.917082% |
| D | 7429 | 1168 | 15.722170% |
Noise dominated data is calculated using 1-second bins in cleaned event files. If a bin has >2000 counts, and if more than 50% of those come from <1% of pixels, then it is considered to be noise-dominated and hence unusable.
| Quadrant | # 1 sec bins | Bins with >0 counts | Bins with >2000 counts | High rate bins dominated by noise | Noise dominated (total time) | Noise dominated (detector-on time) | Marked lightcurve |
|---|---|---|---|---|---|---|---|
| A | 7543 | 7430 | 0 | 0 | 0.00% | 0.00% | 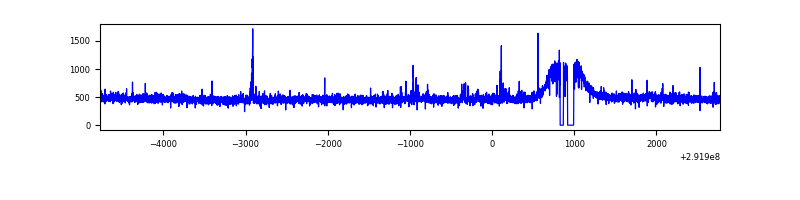 |
| B | 7544 | 7431 | 53 | 53 | 0.70% | 0.71% | 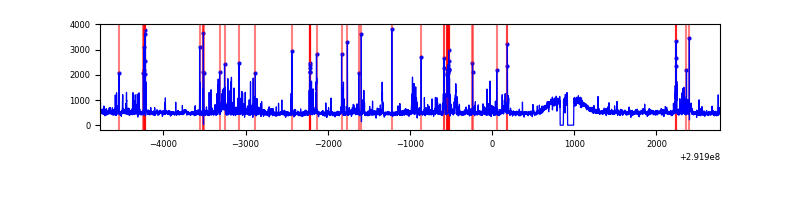 |
| C | 7544 | 7431 | 13 | 13 | 0.17% | 0.17% | 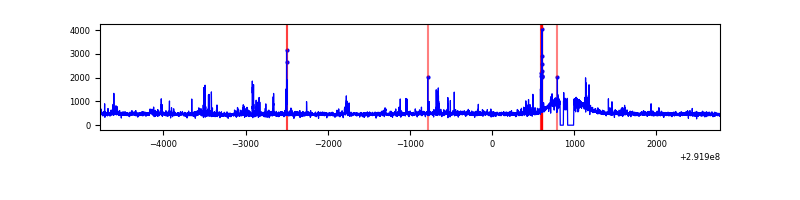 |
| D | 7544 | 7431 | 718 | 718 | 9.52% | 9.66% | 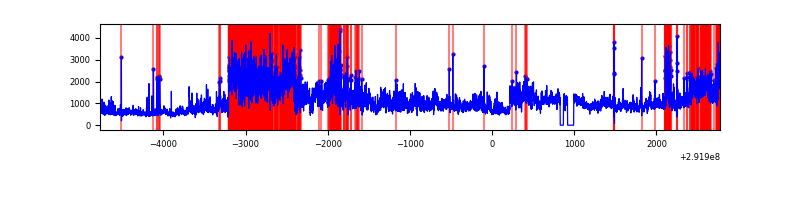 |
Top three noisy pixels from each quadrant. If the there are fewer than three noisy pixels in the level2.evt file, extra rows are filled as -1
| Pixel properties | Quadrant properties | ||||||
|---|---|---|---|---|---|---|---|
| Quadrant | DetID | PixID | Counts | Sigma | Mean | Median | Sigma |
| A | 5 | 98 | 61098 | 314.57 | 934 | 912 | 191.3 |
| A | 8 | 205 | 11017 | 52.81 | 934 | 912 | 191.3 |
| A | 0 | 226 | 8289 | 38.56 | 934 | 912 | 191.3 |
| B | 3 | 112 | 382189 | 2107.93 | 923 | 897 | 180.9 |
| B | 7 | 220 | 167228 | 919.54 | 923 | 897 | 180.9 |
| B | 0 | 197 | 28773 | 154.11 | 923 | 897 | 180.9 |
| C | 0 | 207 | 211410 | 995.21 | 895 | 903 | 211.5 |
| C | 14 | 238 | 136389 | 640.53 | 895 | 903 | 211.5 |
| C | 3 | 233 | 8793 | 37.3 | 895 | 903 | 211.5 |
| D | 7 | 238 | 3215781 | 15032.16 | 874 | 849 | 213.9 |
| D | 12 | 218 | 1042438 | 4870.19 | 874 | 849 | 213.9 |
| D | 9 | 68 | 434073 | 2025.64 | 874 | 849 | 213.9 |
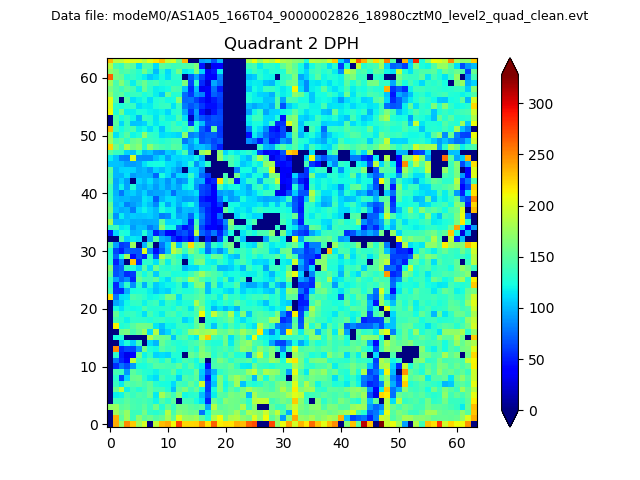
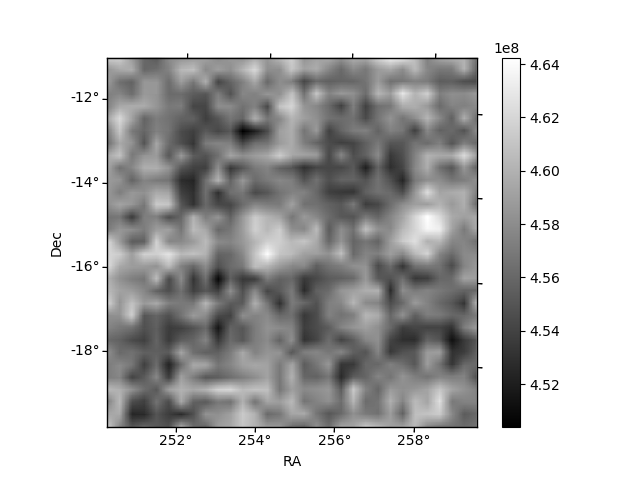
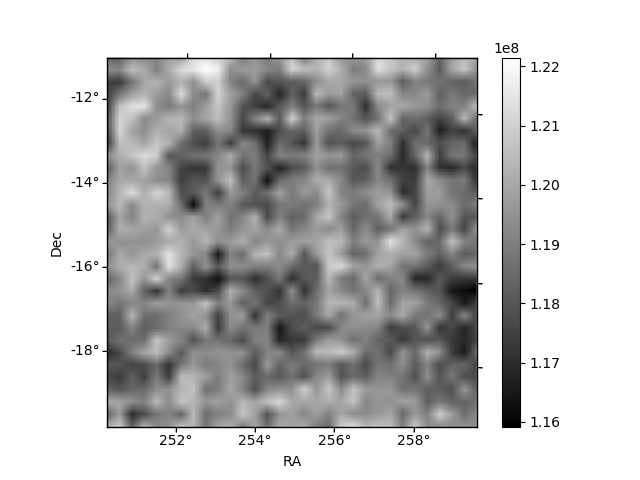
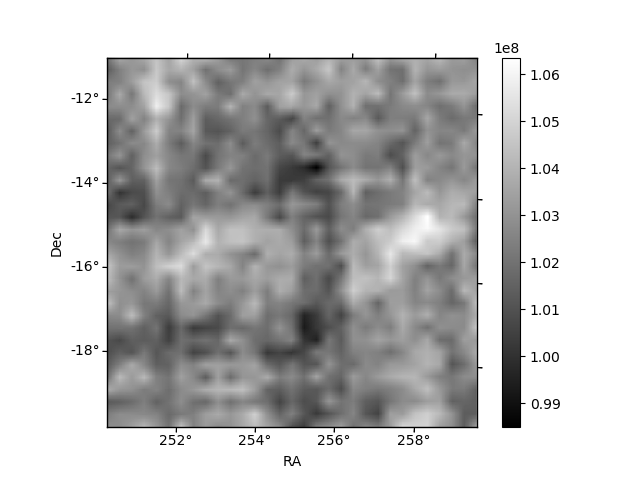
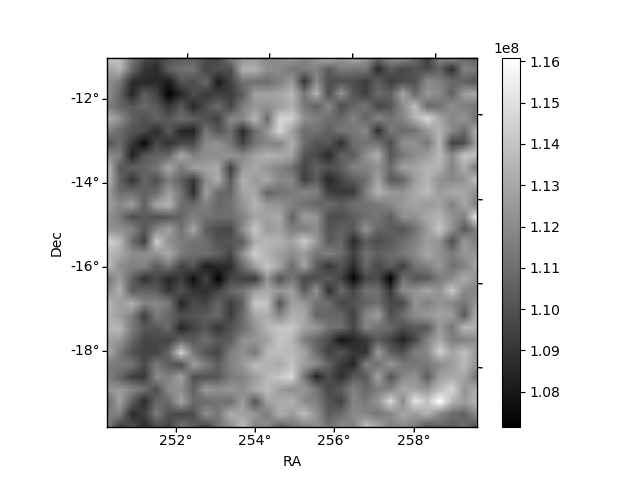
Histogram calculated using DETX and DETY for each event in the final _common_clean file
| Quadrant A | 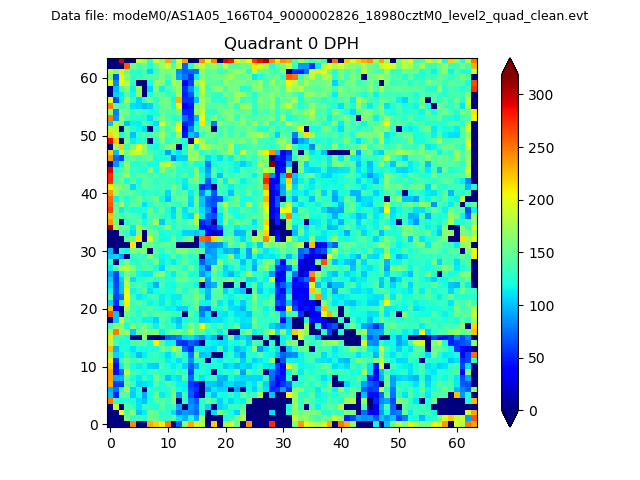 |
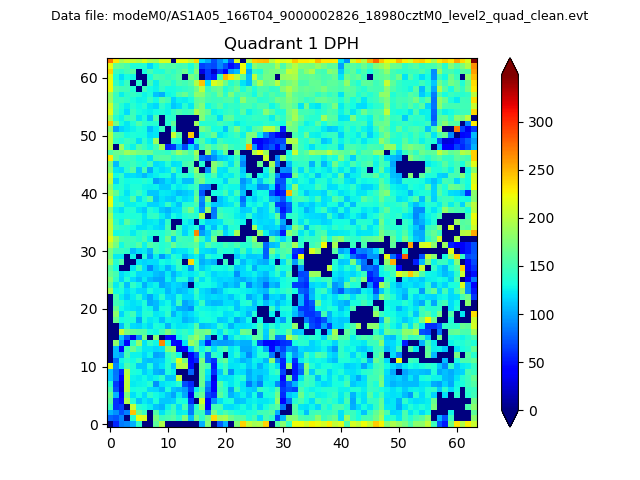 |
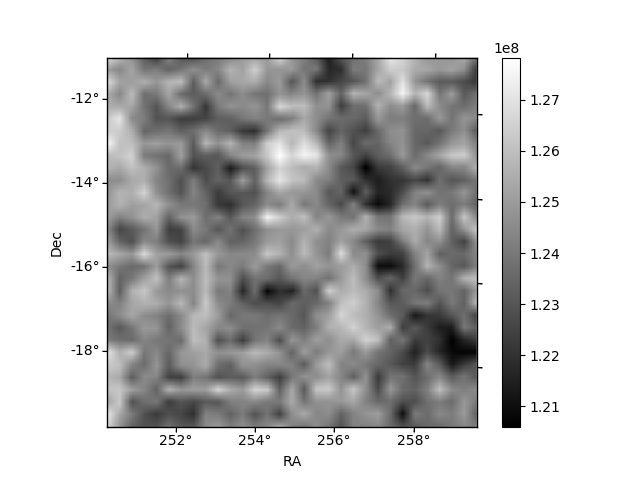
Quadrant B |
|---|---|---|---|
| Quadrant D | 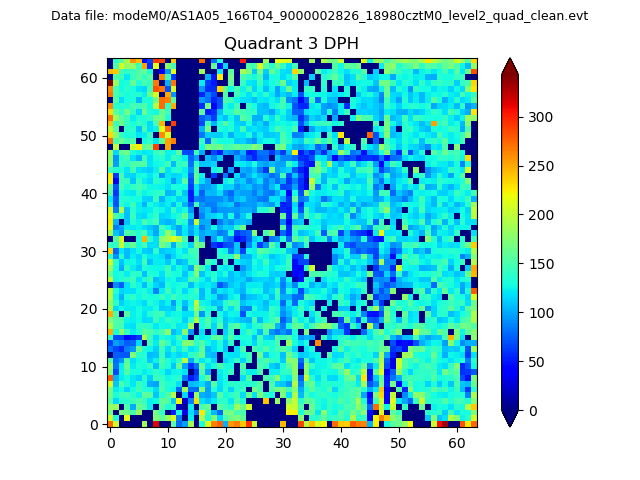 |
 |
Quadrant C |
| Plot type | Count rate plots | Images |
|---|---|---|
| Comparison with Poisson distribution Blue bars denote a histogram of data divided into 1 sec bins. Red curve is a Poisson curve with rate = median count rate of data. |
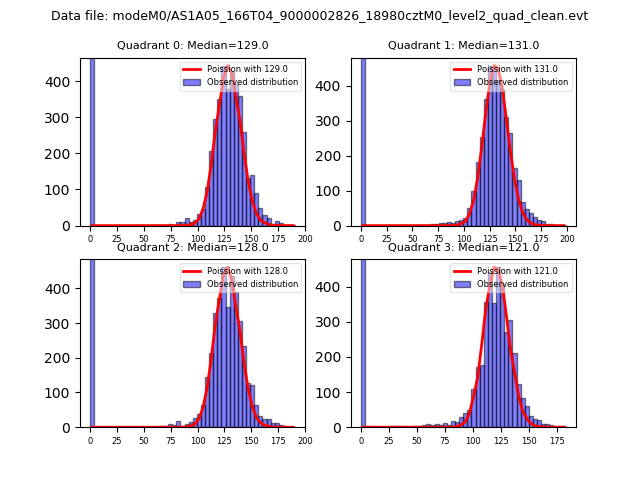 |
 |
| Quadrant-wise count rates Data is divided into 100 sec bins |
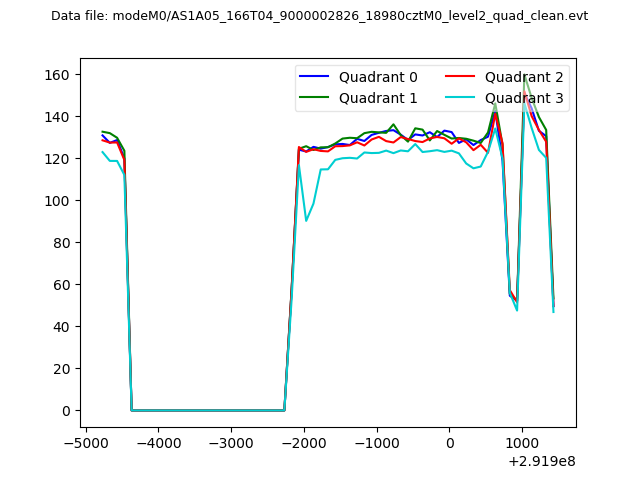 |
|
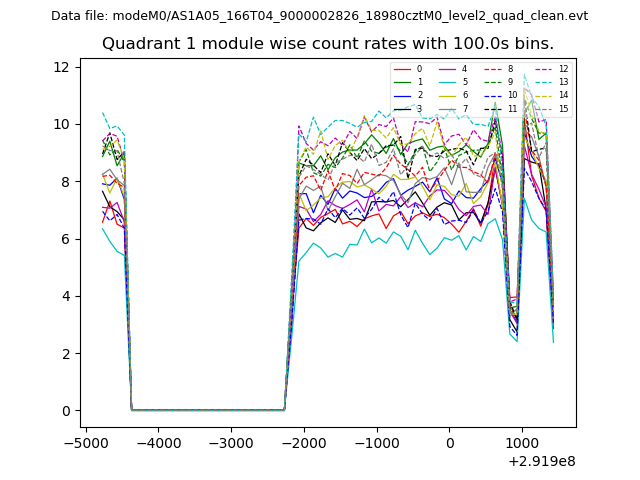
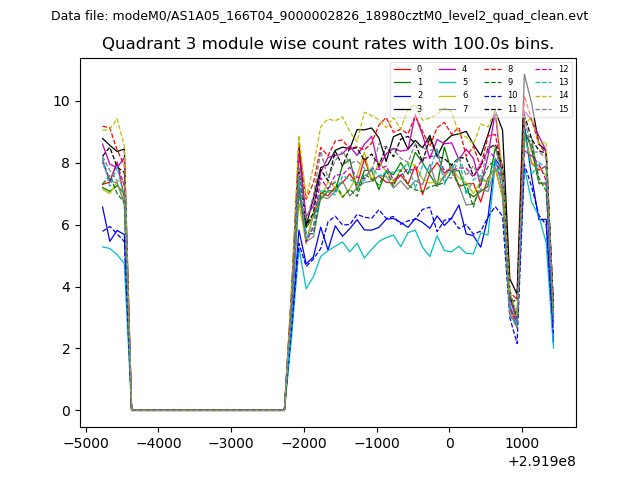
| Module-wise count rates for Quadrant A Data is divided into 100 sec bins |
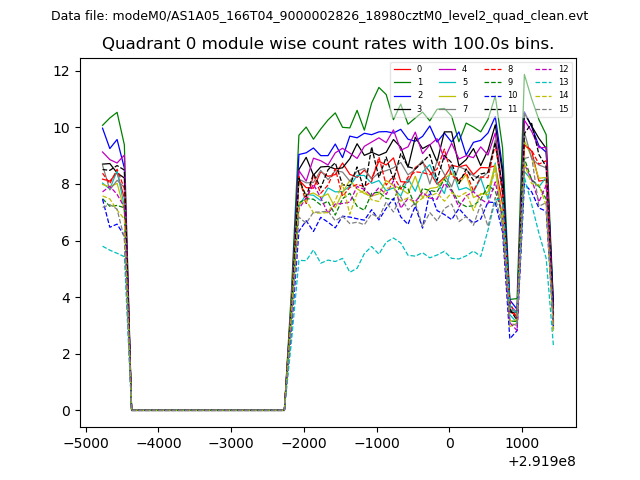 |
 |
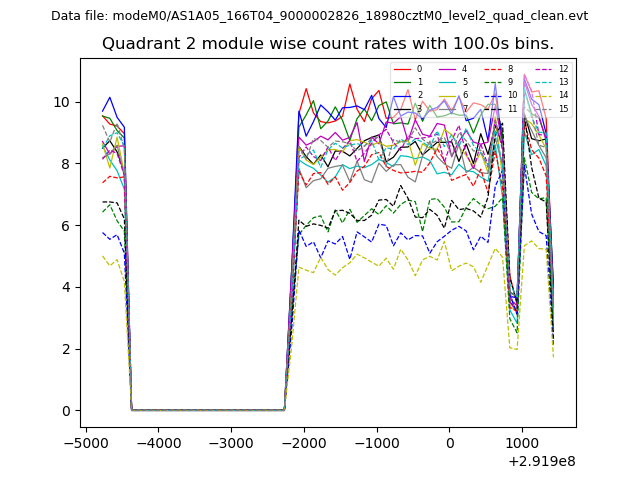
| Module-wise count rates for Quadrant B Data is divided into 100 sec bins |
 |
 |
| Module-wise count rates for Quadrant C Data is divided into 100 sec bins |
 |
 |
| Module-wise count rates for Quadrant D Data is divided into 100 sec bins |
 |
 |
| Parameter | Plot |
|---|---|
| CZT HV Monitor | 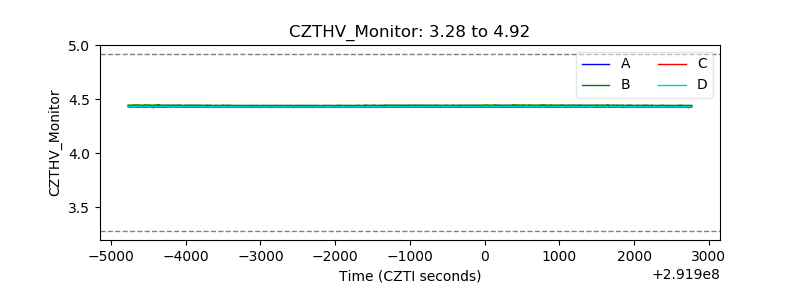 |
| D_VDD | 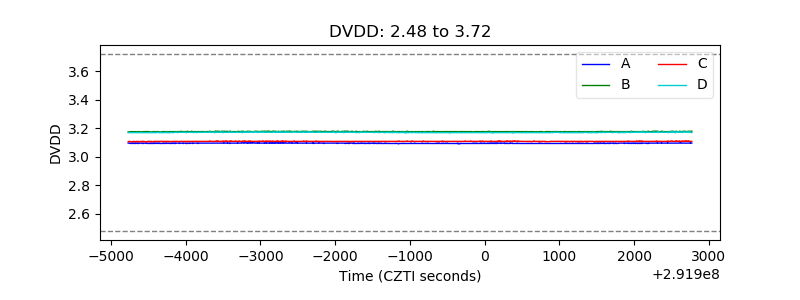 |
| Temperature 1 |  |
| Veto HV Monitor | 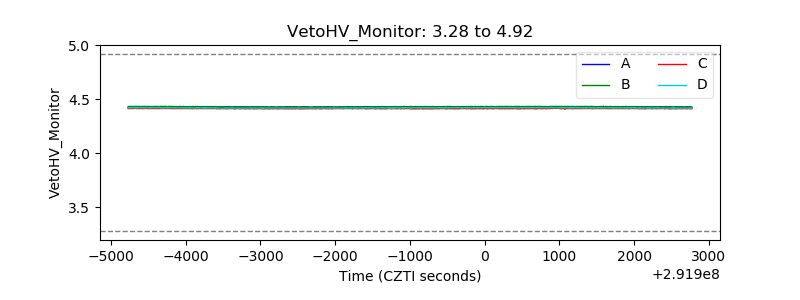 |
| Veto LLD | 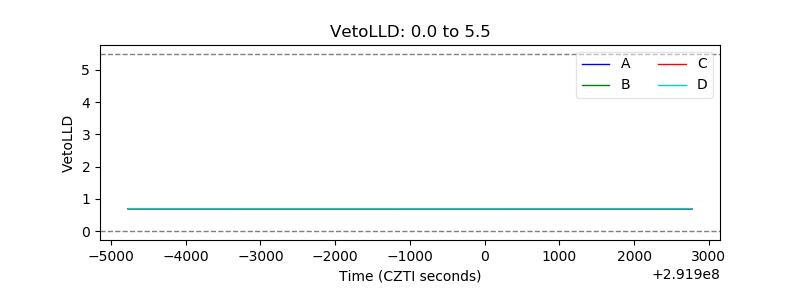 |
| Alpha Counter | 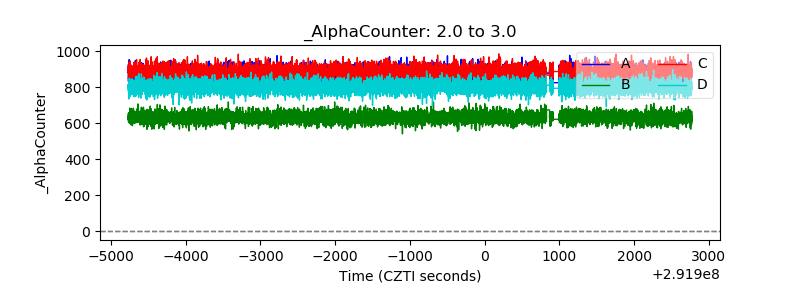 |
| _CPM_Rate | 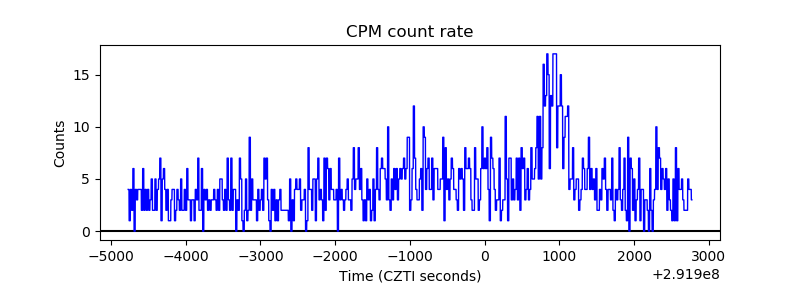 |
| CZT Counter | 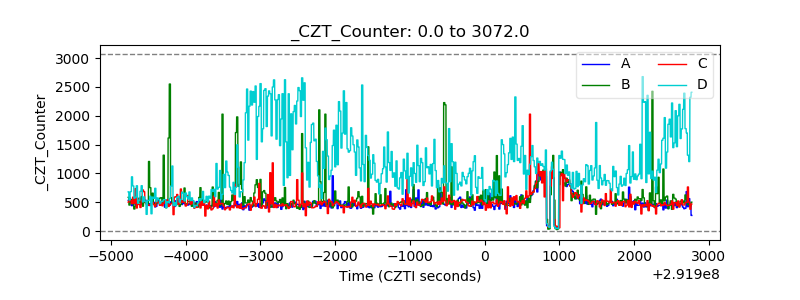 |
| +2.5 Volts monitor |  |
| +5 Volts monitor |  |
| _ROLL_ROT | 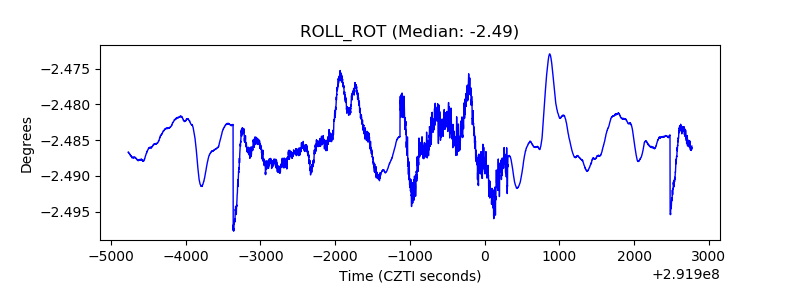 |
| _Roll_DEC |  |
| _Roll_RA | 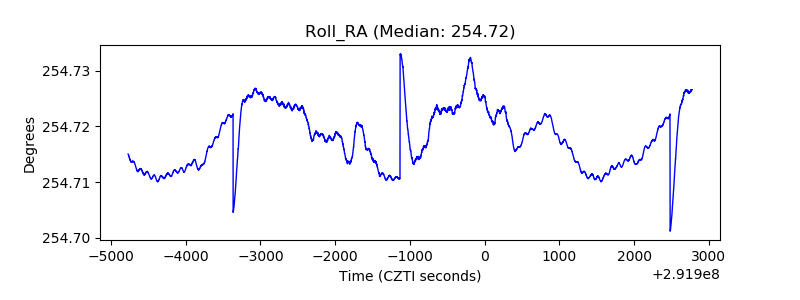 |
| Veto Counter | 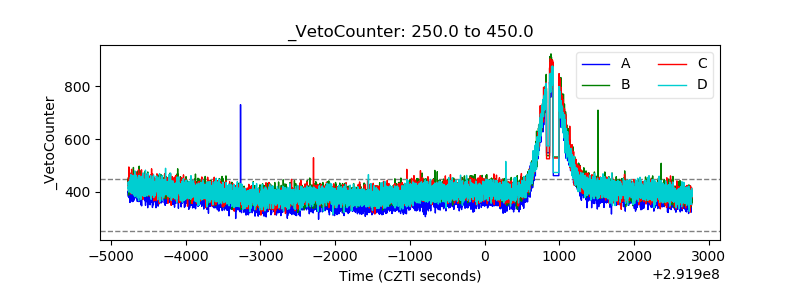 |