| Param | Original file | Final file |
|---|---|---|
| Filename | modeM0/AS1A05_166T04_9000002826_18981cztM0_level2.evt | modeM0/AS1A05_166T04_9000002826_18981cztM0_level2_quad_clean.evt |
| Size (bytes) | 742,089,600 | 81,089,280 |
| Size | 707.7 MB | 77.3 MB |
| Events in quadrant A | 3,763,925 | 487,273 |
| Events in quadrant B | 4,957,943 | 488,872 |
| Events in quadrant C | 3,997,683 | 477,928 |
| Events in quadrant D | 9,225,414 | 456,207 |
| Mode SS | |||
|---|---|---|---|
| Quadrant | BADHDUFLAG | Total packets | Discarded packets |
| A | 0 | 160 | 0 |
| B | 0 | 160 | 0 |
| C | 0 | 160 | 0 |
| D | 0 | 160 | 0 |
| Mode M9 | |||
|---|---|---|---|
| Quadrant | BADHDUFLAG | Total packets | Discarded packets |
| A | 0 | 2 | 0 |
| B | 0 | 2 | 0 |
| C | 0 | 2 | 0 |
| D | 0 | 2 | 0 |
| Mode M0 | |||
|---|---|---|---|
| Quadrant | BADHDUFLAG | Total packets | Discarded packets |
| A | 0 | 16269 | 2 |
| B | 0 | 19693 | 2 |
| C | 0 | 16803 | 2 |
| D | 0 | 32967 | 6 |
| Quadrant | Total seconds | Saturated seconds | Saturation percentage |
|---|---|---|---|
| A | 7831 | 115 | 1.468523% |
| B | 7832 | 375 | 4.788049% |
| C | 7832 | 212 | 2.706844% |
| D | 7831 | 917 | 11.709871% |
Noise dominated data is calculated using 1-second bins in cleaned event files. If a bin has >2000 counts, and if more than 50% of those come from <1% of pixels, then it is considered to be noise-dominated and hence unusable.
| Quadrant | # 1 sec bins | Bins with >0 counts | Bins with >2000 counts | High rate bins dominated by noise | Noise dominated (total time) | Noise dominated (detector-on time) | Marked lightcurve |
|---|---|---|---|---|---|---|---|
| A | 8046 | 7832 | 0 | 0 | 0.00% | 0.00% | 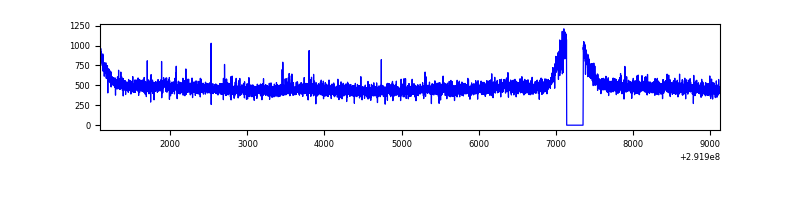 |
| B | 8047 | 7833 | 180 | 180 | 2.24% | 2.30% | 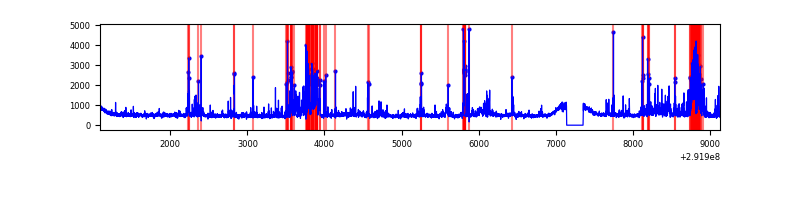 |
| C | 8047 | 7833 | 45 | 45 | 0.56% | 0.57% | 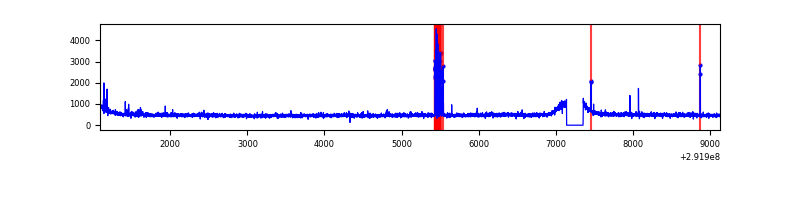 |
| D | 8047 | 7833 | 681 | 681 | 8.46% | 8.69% | 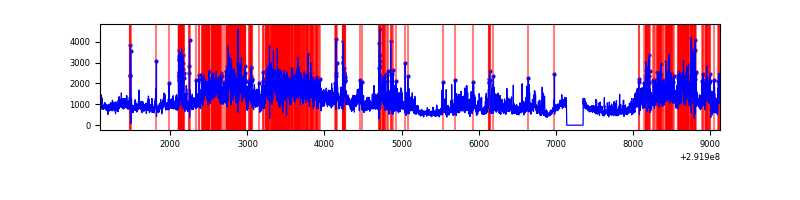 |
Top three noisy pixels from each quadrant. If the there are fewer than three noisy pixels in the level2.evt file, extra rows are filled as -1
| Pixel properties | Quadrant properties | ||||||
|---|---|---|---|---|---|---|---|
| Quadrant | DetID | PixID | Counts | Sigma | Mean | Median | Sigma |
| A | 5 | 98 | 13870 | 65.37 | 972 | 950 | 197.6 |
| A | 0 | 226 | 8619 | 38.8 | 972 | 950 | 197.6 |
| A | 13 | 254 | 7830 | 34.81 | 972 | 950 | 197.6 |
| B | 3 | 112 | 973677 | 5199.56 | 956 | 930 | 187.1 |
| B | 7 | 220 | 174878 | 929.79 | 956 | 930 | 187.1 |
| B | 12 | 111 | 22068 | 112.99 | 956 | 930 | 187.1 |
| C | 0 | 207 | 193352 | 877.02 | 929 | 936 | 219.4 |
| C | 14 | 238 | 142818 | 646.69 | 929 | 936 | 219.4 |
| C | 3 | 233 | 26651 | 117.21 | 929 | 936 | 219.4 |
| D | 7 | 238 | 4602364 | 20401.29 | 922 | 897 | 225.5 |
| D | 1 | 52 | 533648 | 2362.03 | 922 | 897 | 225.5 |
| D | 12 | 218 | 316571 | 1399.59 | 922 | 897 | 225.5 |
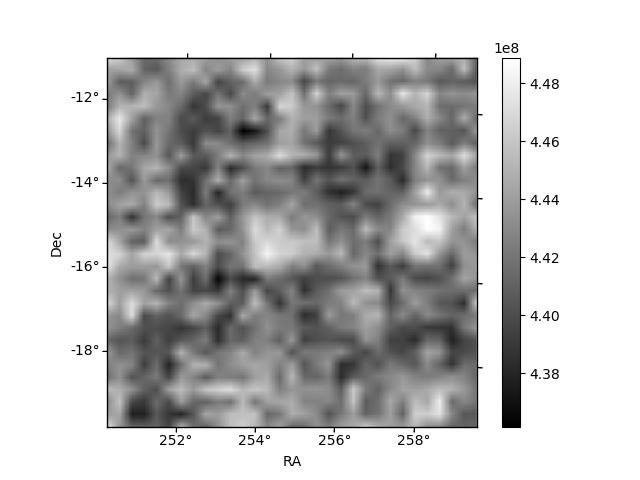
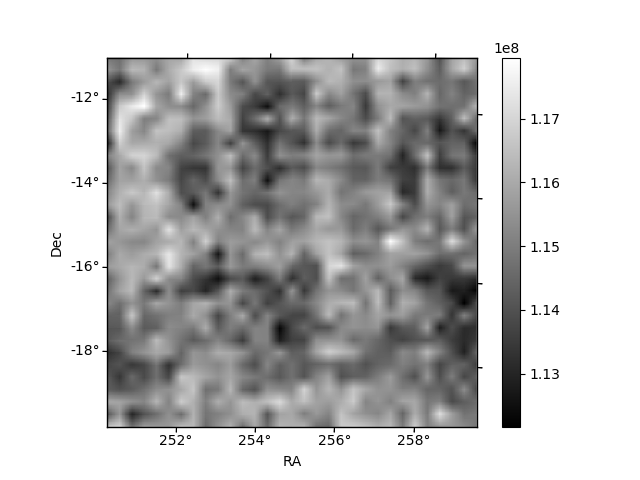
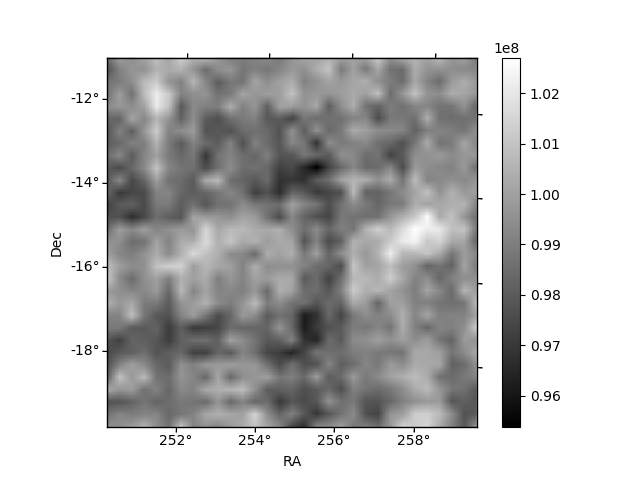
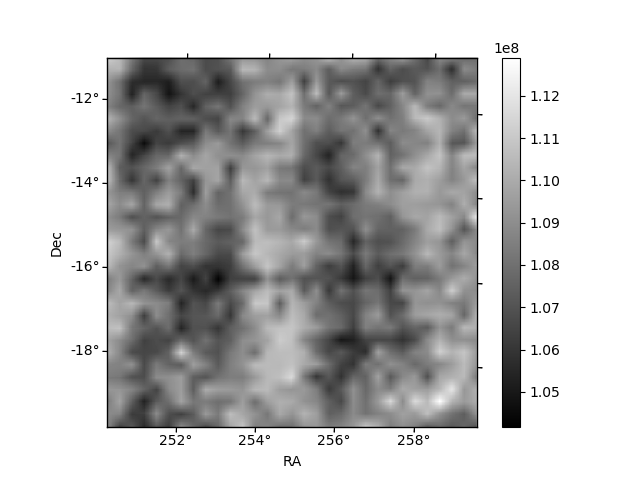
Histogram calculated using DETX and DETY for each event in the final _common_clean file
| Quadrant A | 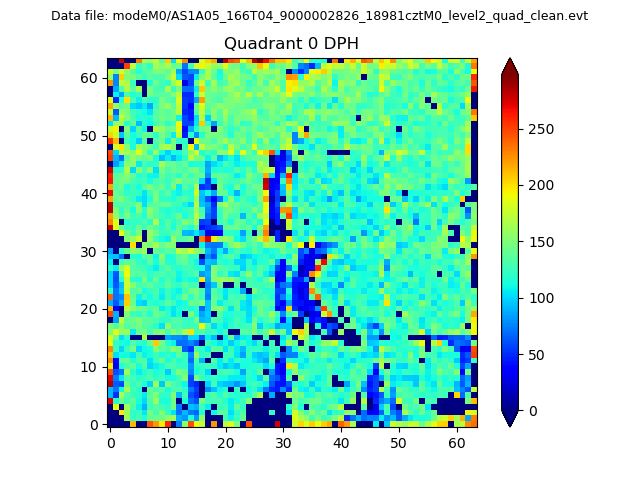 |
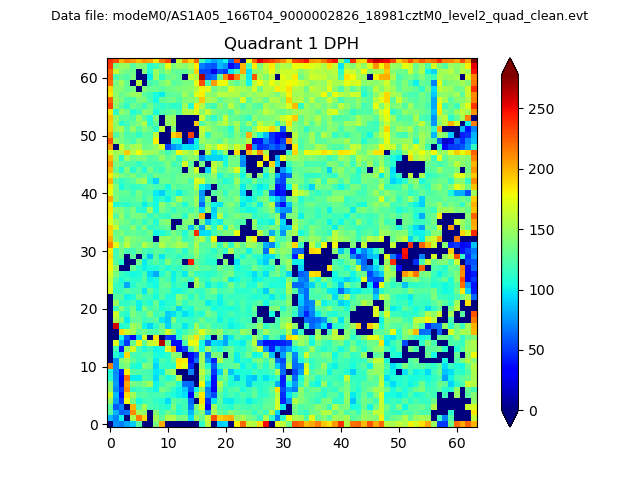 |
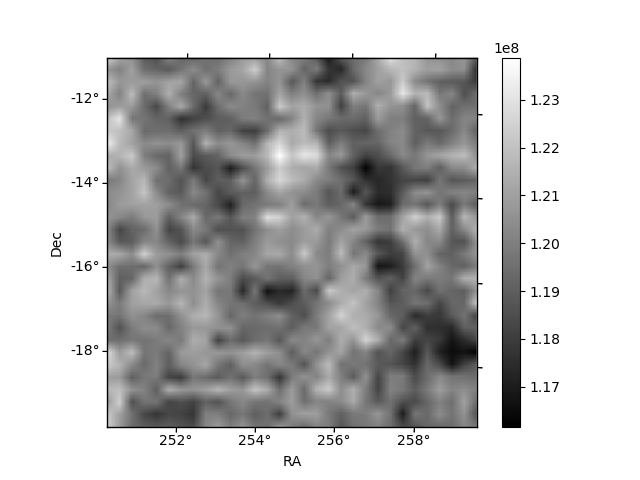
Quadrant B |
|---|---|---|---|
| Quadrant D | 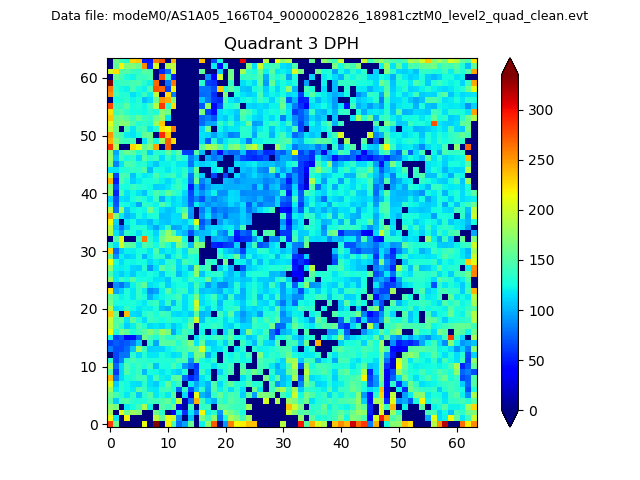 |
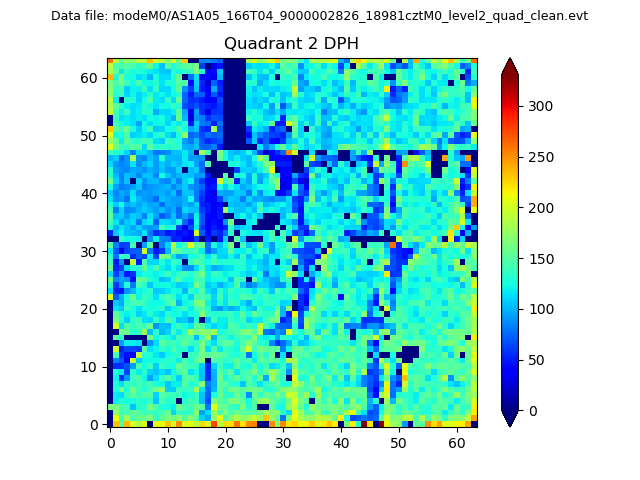 |
Quadrant C |
| Plot type | Count rate plots | Images |
|---|---|---|
| Comparison with Poisson distribution Blue bars denote a histogram of data divided into 1 sec bins. Red curve is a Poisson curve with rate = median count rate of data. |
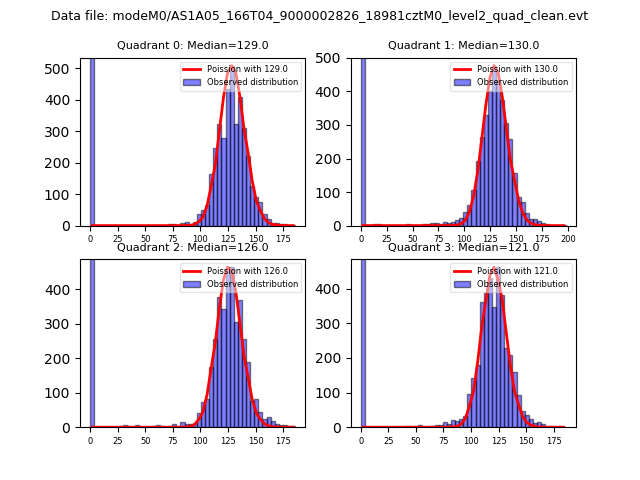 |
 |
| Quadrant-wise count rates Data is divided into 100 sec bins |
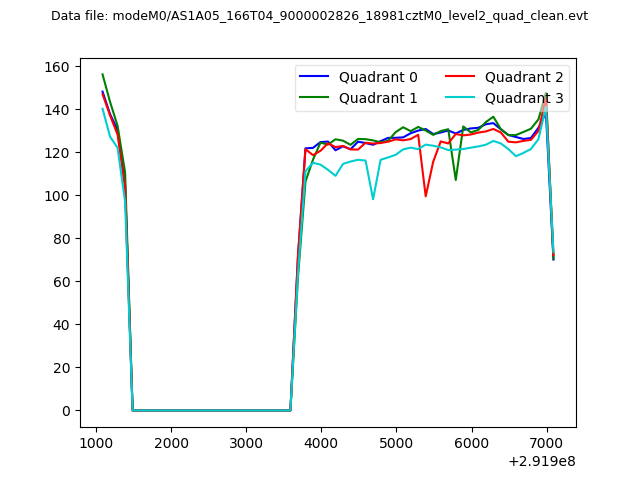 |
|
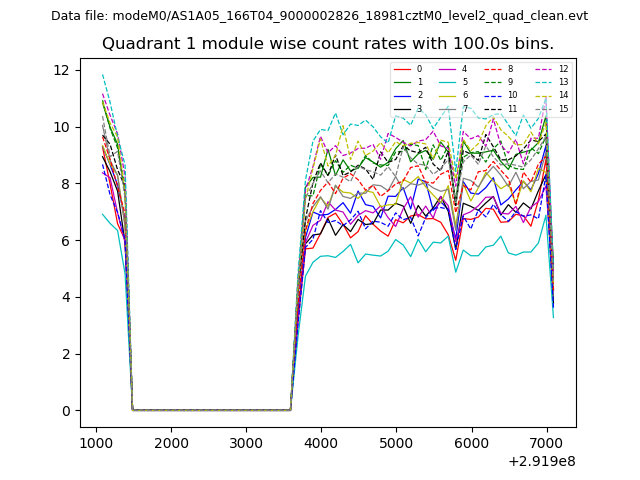
| Module-wise count rates for Quadrant A Data is divided into 100 sec bins |
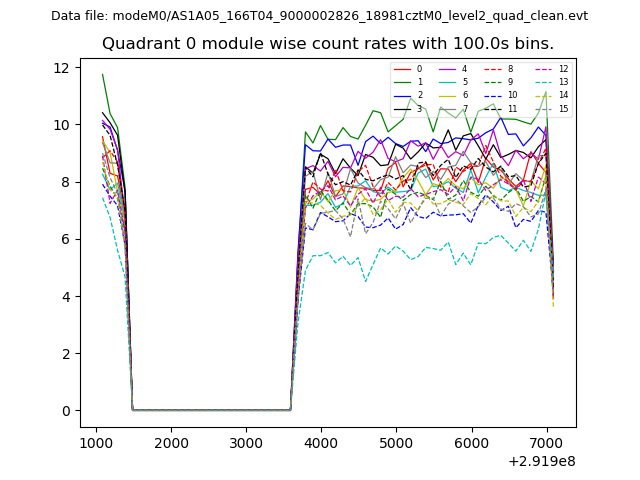 |
 |
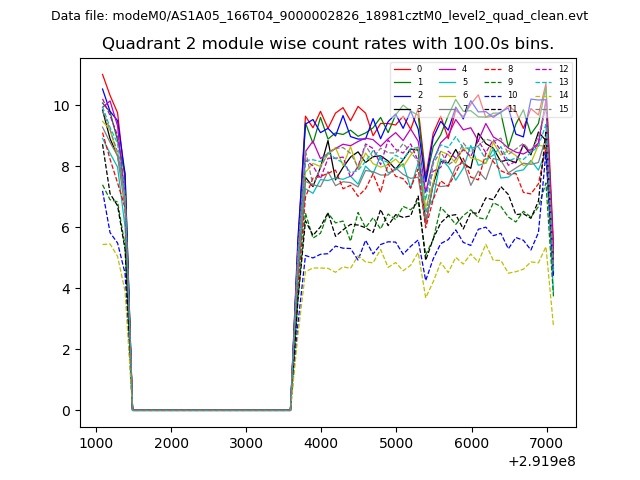
| Module-wise count rates for Quadrant B Data is divided into 100 sec bins |
 |
 |
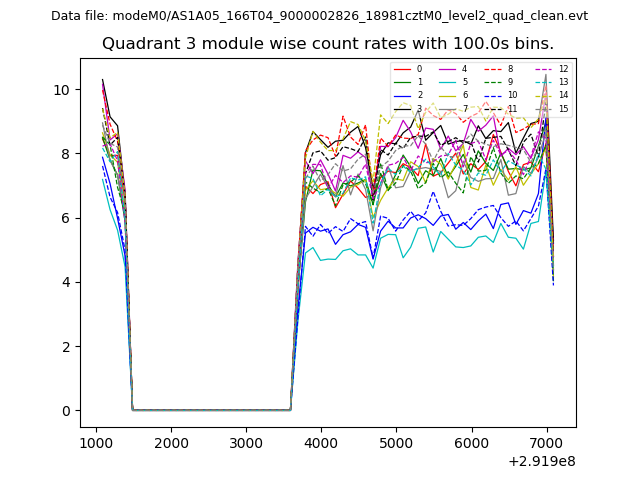
| Module-wise count rates for Quadrant C Data is divided into 100 sec bins |
 |
 |
| Module-wise count rates for Quadrant D Data is divided into 100 sec bins |
 |
 |
| Parameter | Plot |
|---|---|
| CZT HV Monitor | 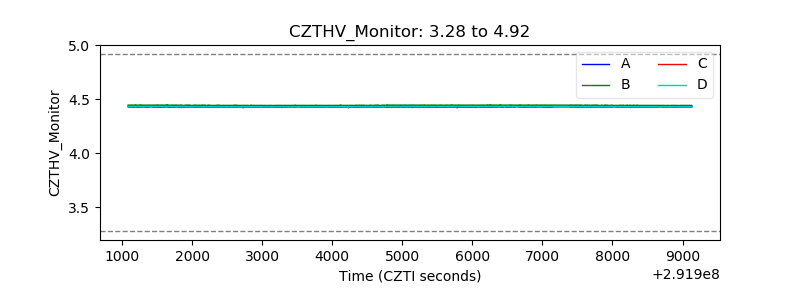 |
| D_VDD | 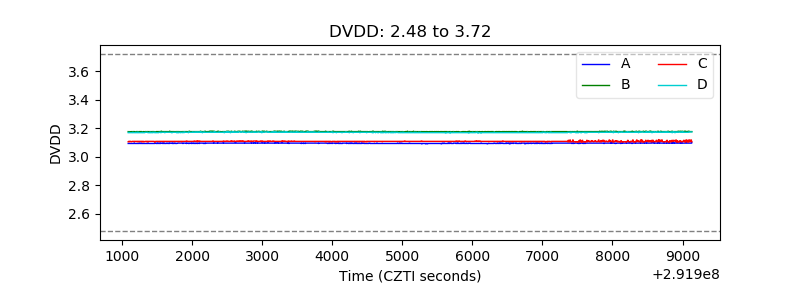 |
| Temperature 1 | 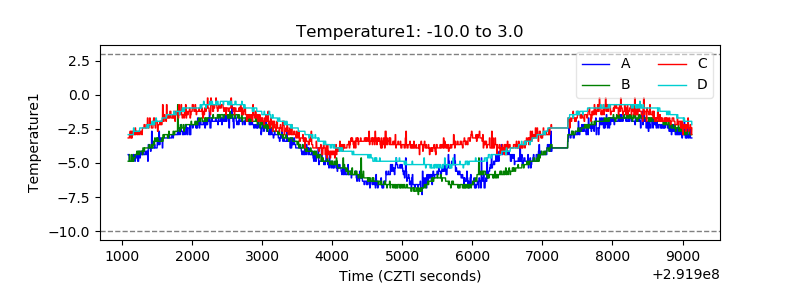 |
| Veto HV Monitor | 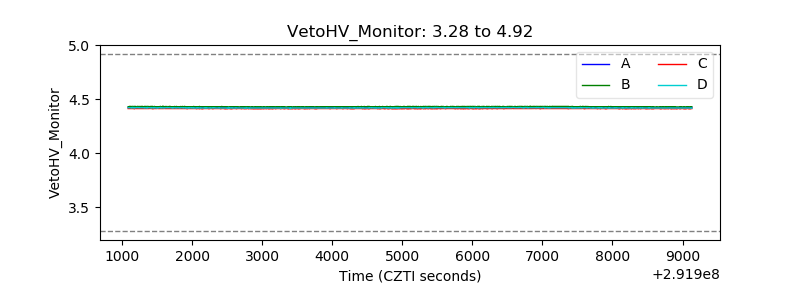 |
| Veto LLD | 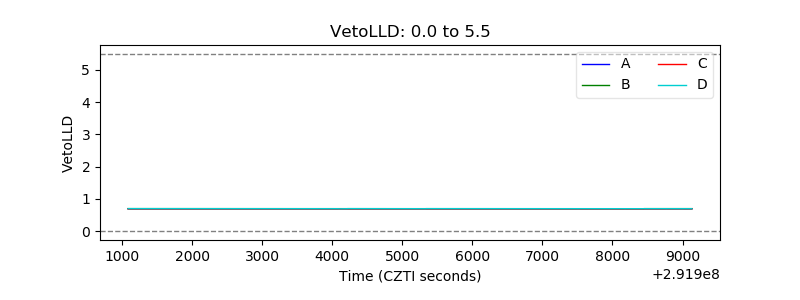 |
| Alpha Counter | 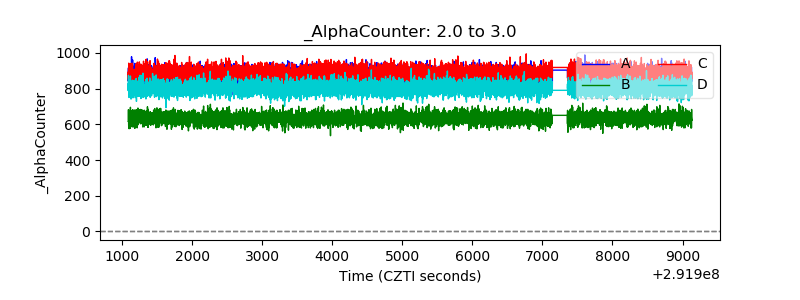 |
| _CPM_Rate | 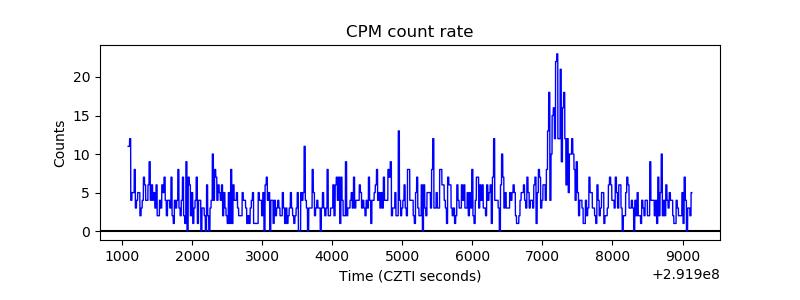 |
| CZT Counter | 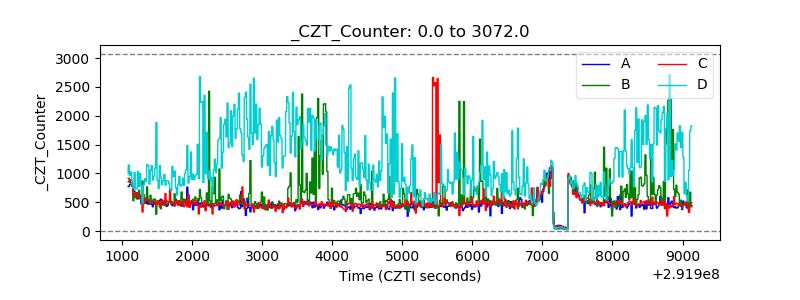 |
| +2.5 Volts monitor |  |
| +5 Volts monitor | 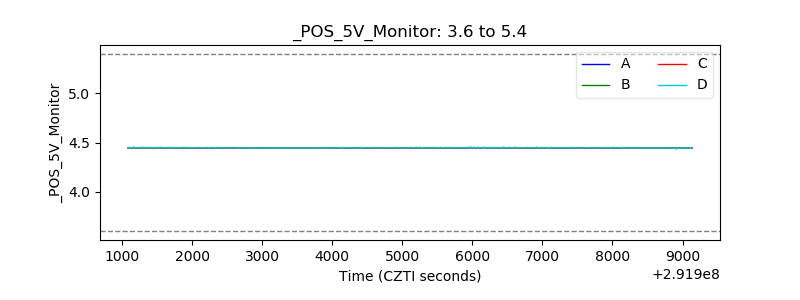 |
| _ROLL_ROT | 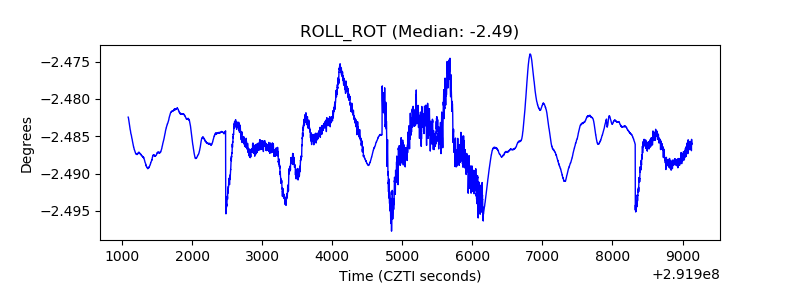 |
| _Roll_DEC |  |
| _Roll_RA | 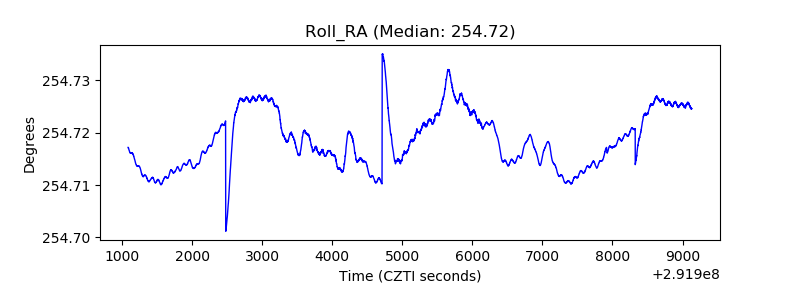 |
| Veto Counter | 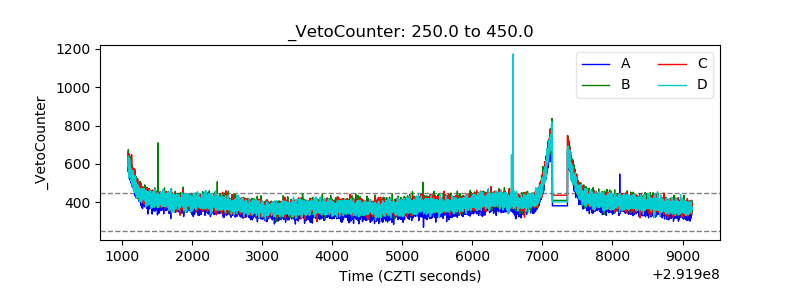 |