| Param | Original file | Final file |
|---|---|---|
| Filename | modeM0/AS1A05_166T04_9000002826_18982cztM0_level2.evt | modeM0/AS1A05_166T04_9000002826_18982cztM0_level2_quad_clean.evt |
| Size (bytes) | 728,922,240 | 81,005,760 |
| Size | 695.2 MB | 77.3 MB |
| Events in quadrant A | 3,788,970 | 483,452 |
| Events in quadrant B | 5,283,700 | 489,678 |
| Events in quadrant C | 4,175,757 | 475,686 |
| Events in quadrant D | 8,297,729 | 459,611 |
| Mode SS | |||
|---|---|---|---|
| Quadrant | BADHDUFLAG | Total packets | Discarded packets |
| A | 0 | 162 | 0 |
| B | 0 | 162 | 0 |
| C | 0 | 162 | 0 |
| D | 0 | 162 | 0 |
| Mode M9 | |||
|---|---|---|---|
| Quadrant | BADHDUFLAG | Total packets | Discarded packets |
| A | 0 | 6 | 0 |
| B | 0 | 6 | 0 |
| C | 0 | 6 | 0 |
| D | 0 | 6 | 0 |
| Mode M0 | |||
|---|---|---|---|
| Quadrant | BADHDUFLAG | Total packets | Discarded packets |
| A | 0 | 16350 | 2 |
| B | 0 | 20804 | 3 |
| C | 0 | 17186 | 2 |
| D | 0 | 30169 | 2 |
| Quadrant | Total seconds | Saturated seconds | Saturation percentage |
|---|---|---|---|
| A | 7824 | 177 | 2.262270% |
| B | 7824 | 502 | 6.416155% |
| C | 7824 | 223 | 2.850204% |
| D | 7824 | 902 | 11.528630% |
Noise dominated data is calculated using 1-second bins in cleaned event files. If a bin has >2000 counts, and if more than 50% of those come from <1% of pixels, then it is considered to be noise-dominated and hence unusable.
| Quadrant | # 1 sec bins | Bins with >0 counts | Bins with >2000 counts | High rate bins dominated by noise | Noise dominated (total time) | Noise dominated (detector-on time) | Marked lightcurve |
|---|---|---|---|---|---|---|---|
| A | 8439 | 7826 | 0 | 0 | 0.00% | 0.00% | 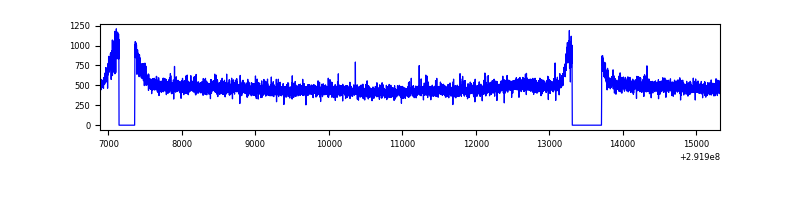 |
| B | 8439 | 7826 | 187 | 187 | 2.22% | 2.39% | 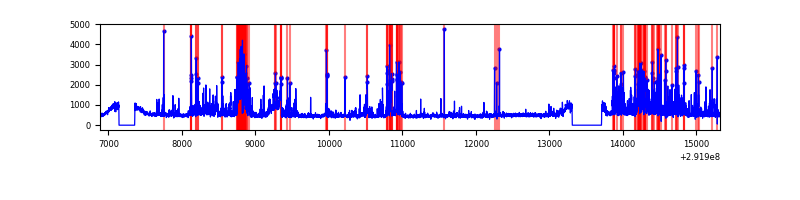 |
| C | 8439 | 7826 | 5 | 5 | 0.06% | 0.06% | 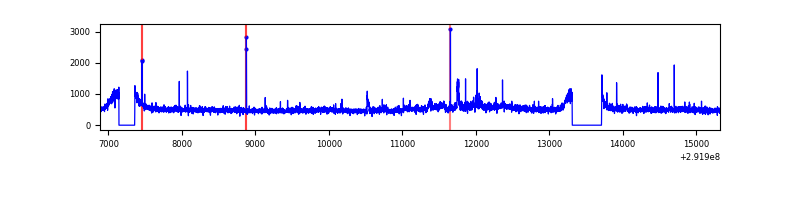 |
| D | 8439 | 7826 | 559 | 559 | 6.62% | 7.14% | 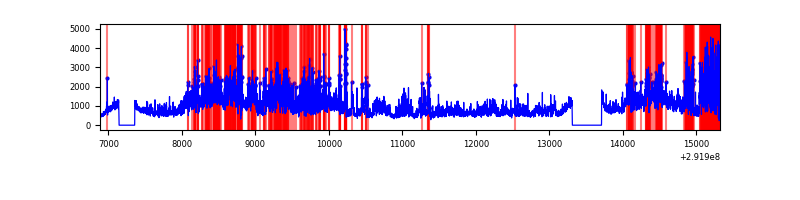 |
Top three noisy pixels from each quadrant. If the there are fewer than three noisy pixels in the level2.evt file, extra rows are filled as -1
| Pixel properties | Quadrant properties | ||||||
|---|---|---|---|---|---|---|---|
| Quadrant | DetID | PixID | Counts | Sigma | Mean | Median | Sigma |
| A | 11 | 29 | 10430 | 47.42 | 980 | 957 | 199.8 |
| A | 0 | 226 | 8551 | 38.01 | 980 | 957 | 199.8 |
| A | 13 | 254 | 8361 | 37.06 | 980 | 957 | 199.8 |
| B | 3 | 112 | 1119393 | 5922.01 | 963 | 937 | 188.9 |
| B | 7 | 220 | 305678 | 1613.55 | 963 | 937 | 188.9 |
| B | 0 | 245 | 37825 | 195.31 | 963 | 937 | 188.9 |
| C | 3 | 233 | 196265 | 872.71 | 941 | 948 | 223.8 |
| C | 14 | 238 | 141851 | 629.58 | 941 | 948 | 223.8 |
| C | 8 | 208 | 83570 | 369.17 | 941 | 948 | 223.8 |
| D | 7 | 238 | 3734095 | 16382.42 | 930 | 902 | 227.9 |
| D | 9 | 68 | 308890 | 1351.55 | 930 | 902 | 227.9 |
| D | 1 | 52 | 230027 | 1005.47 | 930 | 902 | 227.9 |
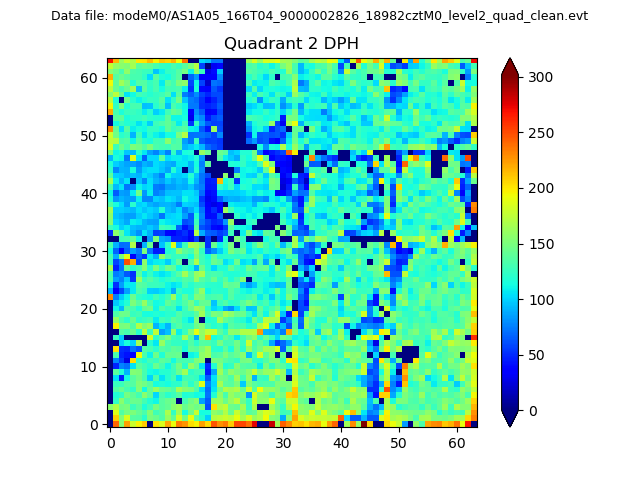
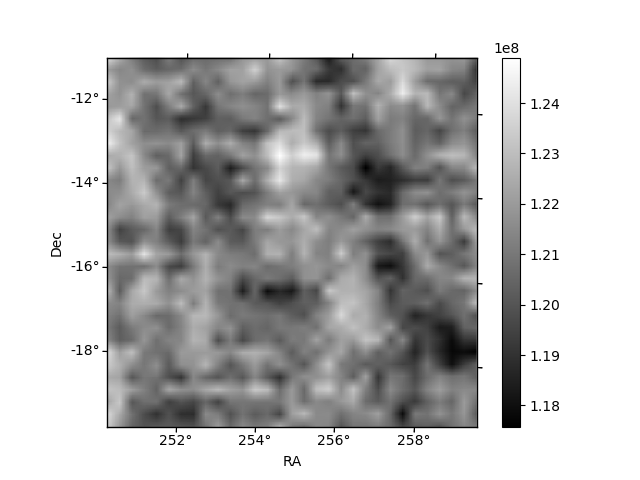
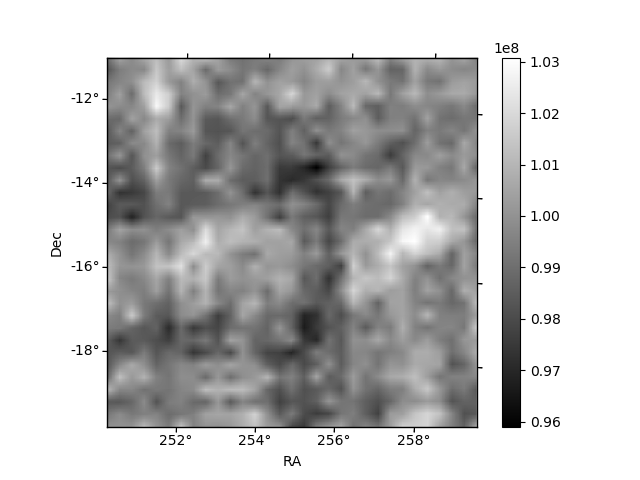
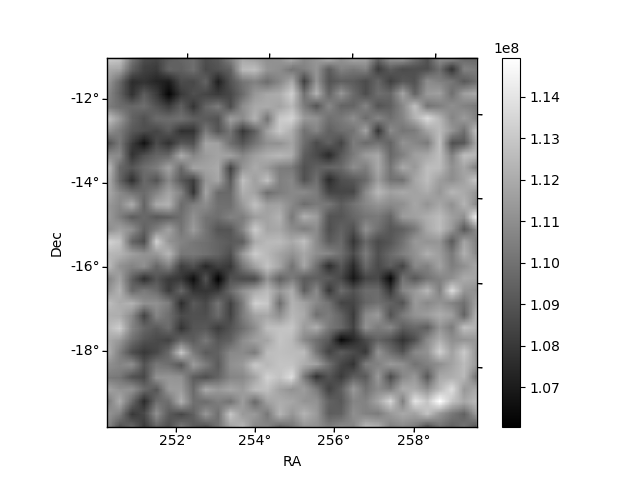
Histogram calculated using DETX and DETY for each event in the final _common_clean file
| Quadrant A | 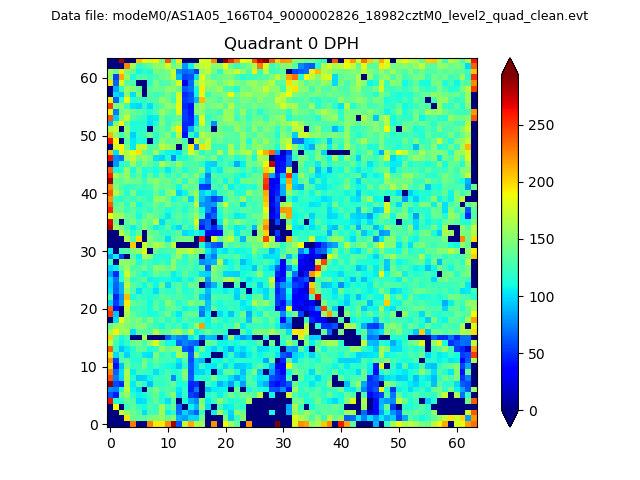 |
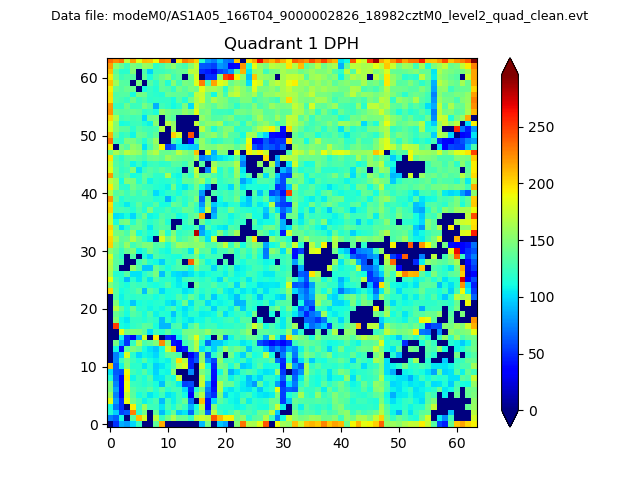 |
Quadrant B |
|---|---|---|---|
| Quadrant D | 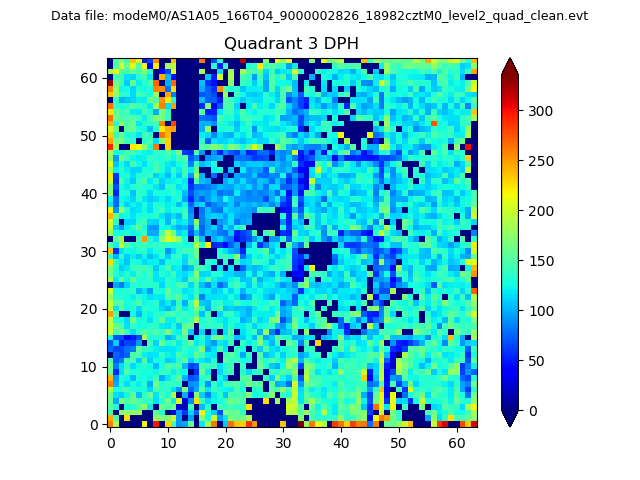 |
 |
Quadrant C |
| Plot type | Count rate plots | Images |
|---|---|---|
| Comparison with Poisson distribution Blue bars denote a histogram of data divided into 1 sec bins. Red curve is a Poisson curve with rate = median count rate of data. |
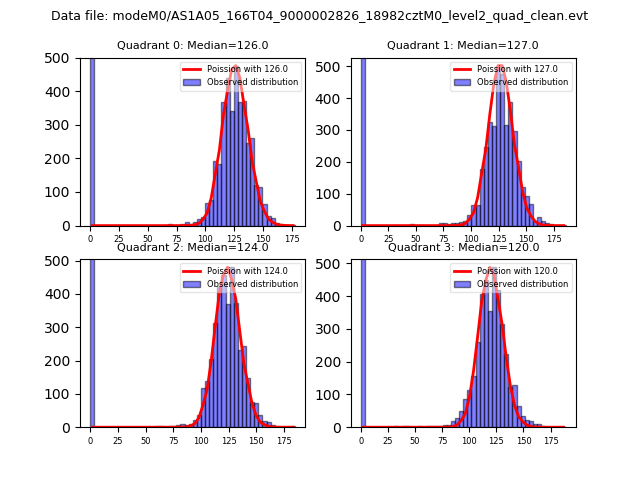 |
 |
| Quadrant-wise count rates Data is divided into 100 sec bins |
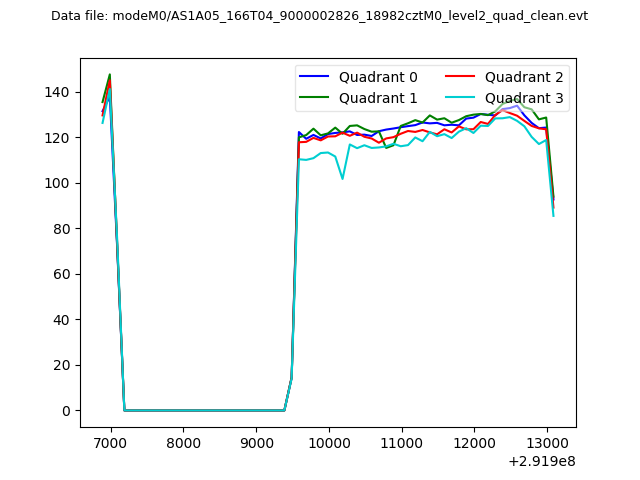 |
|
| Module-wise count rates for Quadrant A Data is divided into 100 sec bins |
 |
 |
| Module-wise count rates for Quadrant B Data is divided into 100 sec bins |
 |
 |
| Module-wise count rates for Quadrant C Data is divided into 100 sec bins |
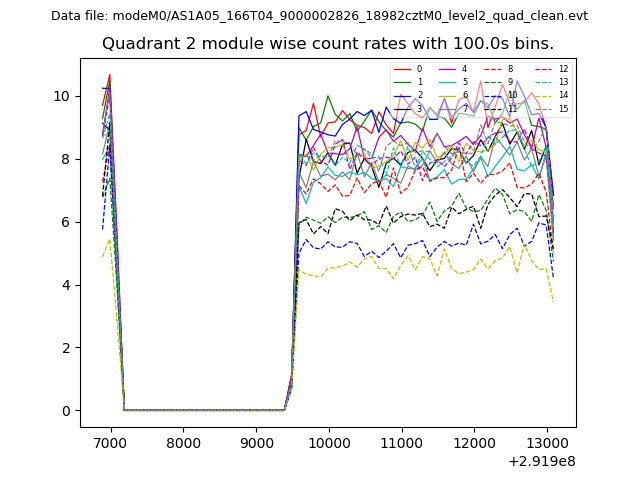 |
 |
| Module-wise count rates for Quadrant D Data is divided into 100 sec bins |
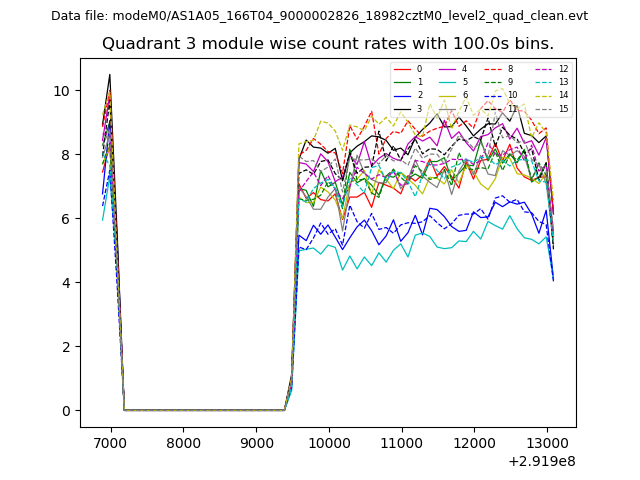 |
 |
| Parameter | Plot |
|---|---|
| CZT HV Monitor | 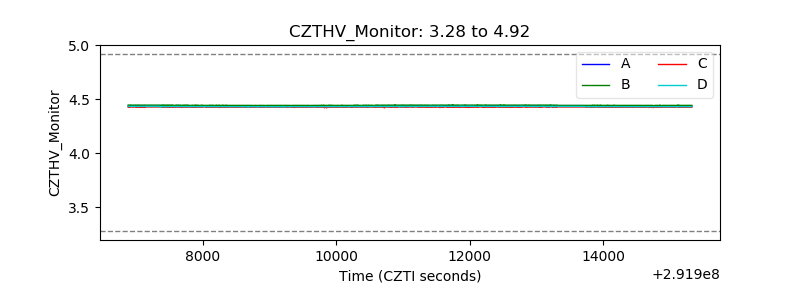 |
| D_VDD |  |
| Temperature 1 | 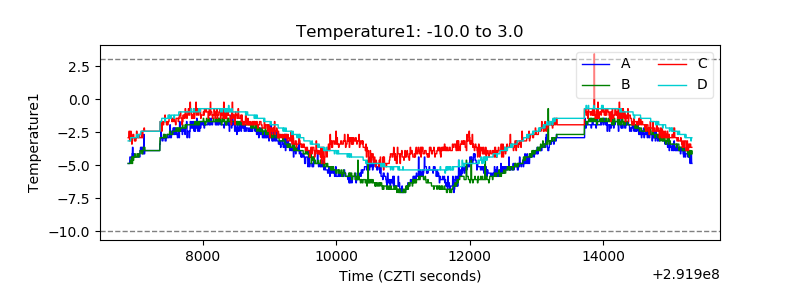 |
| Veto HV Monitor | 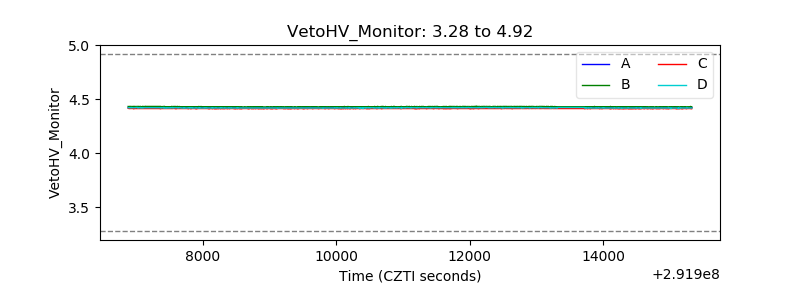 |
| Veto LLD |  |
| Alpha Counter | 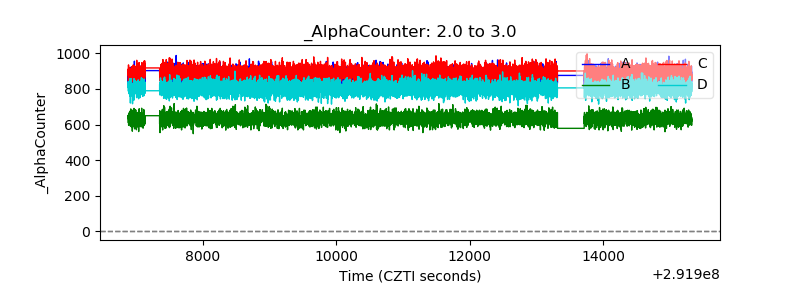 |
| _CPM_Rate | 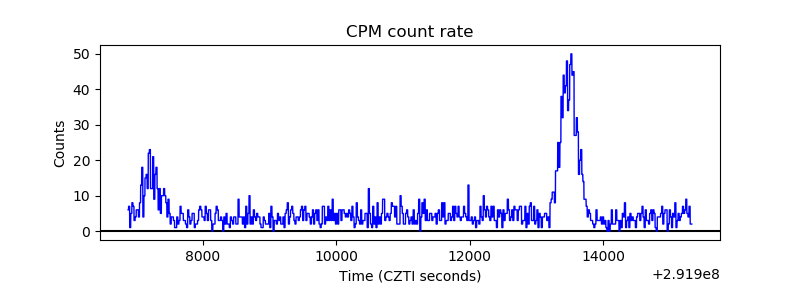 |
| CZT Counter | 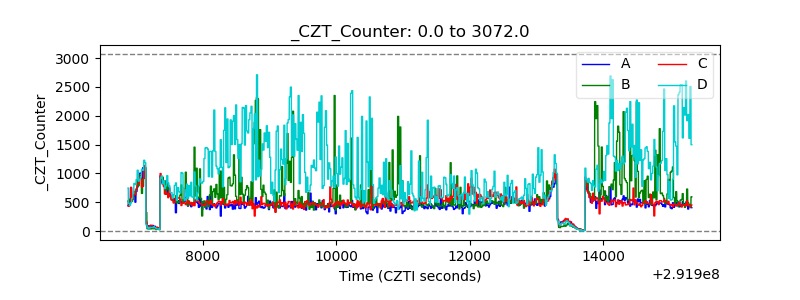 |
| +2.5 Volts monitor |  |
| +5 Volts monitor |  |
| _ROLL_ROT |  |
| _Roll_DEC | 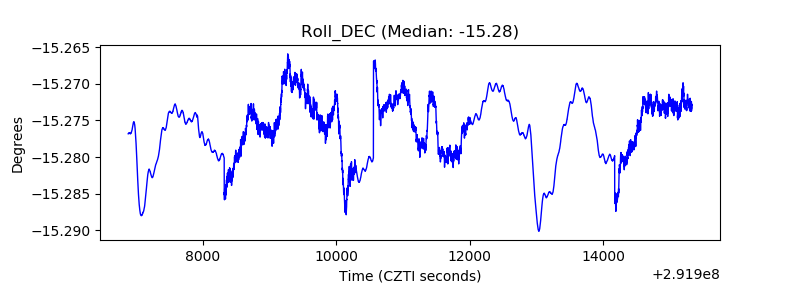 |
| _Roll_RA | 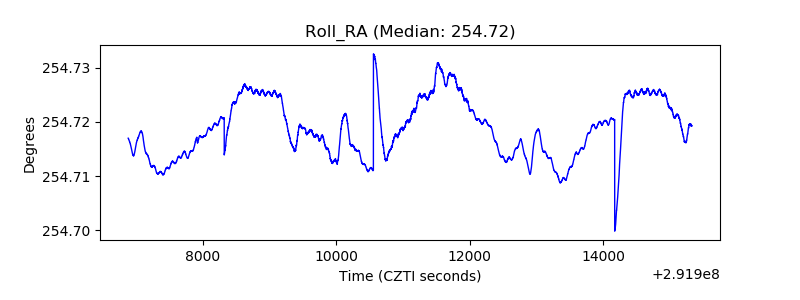 |
| Veto Counter | 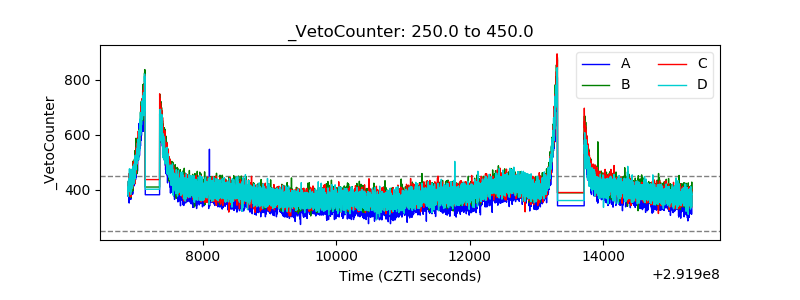 |