| Param | Original file | Final file |
|---|---|---|
| Filename | modeM0/AS1A05_166T04_9000002826_18984cztM0_level2.evt | modeM0/AS1A05_166T04_9000002826_18984cztM0_level2_quad_clean.evt |
| Size (bytes) | 675,740,160 | 90,192,960 |
| Size | 644.4 MB | 86.0 MB |
| Events in quadrant A | 3,468,679 | 562,031 |
| Events in quadrant B | 4,444,980 | 566,531 |
| Events in quadrant C | 3,787,689 | 553,921 |
| Events in quadrant D | 8,254,644 | 525,397 |
| Mode SS | |||
|---|---|---|---|
| Quadrant | BADHDUFLAG | Total packets | Discarded packets |
| A | 0 | 152 | 0 |
| B | 0 | 152 | 0 |
| C | 0 | 152 | 0 |
| D | 0 | 152 | 0 |
| Mode M9 | |||
|---|---|---|---|
| Quadrant | BADHDUFLAG | Total packets | Discarded packets |
| A | 0 | 6 | 0 |
| B | 0 | 6 | 0 |
| C | 0 | 6 | 0 |
| D | 0 | 6 | 0 |
| Mode M0 | |||
|---|---|---|---|
| Quadrant | BADHDUFLAG | Total packets | Discarded packets |
| A | 0 | 15275 | 1 |
| B | 0 | 18108 | 1 |
| C | 0 | 15673 | 1 |
| D | 0 | 29807 | 1 |
| Quadrant | Total seconds | Saturated seconds | Saturation percentage |
|---|---|---|---|
| A | 7521 | 42 | 0.558436% |
| B | 7522 | 253 | 3.363467% |
| C | 7522 | 79 | 1.050253% |
| D | 7522 | 1104 | 14.676948% |
Noise dominated data is calculated using 1-second bins in cleaned event files. If a bin has >2000 counts, and if more than 50% of those come from <1% of pixels, then it is considered to be noise-dominated and hence unusable.
| Quadrant | # 1 sec bins | Bins with >0 counts | Bins with >2000 counts | High rate bins dominated by noise | Noise dominated (total time) | Noise dominated (detector-on time) | Marked lightcurve |
|---|---|---|---|---|---|---|---|
| A | 8096 | 7522 | 0 | 0 | 0.00% | 0.00% | 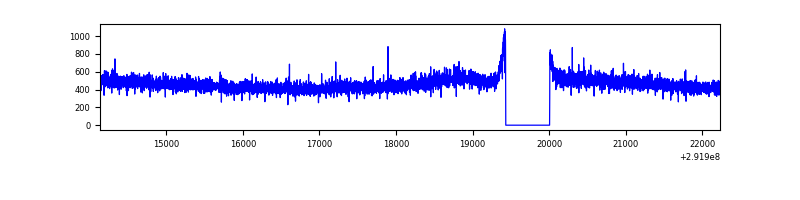 |
| B | 8097 | 7523 | 89 | 89 | 1.10% | 1.18% | 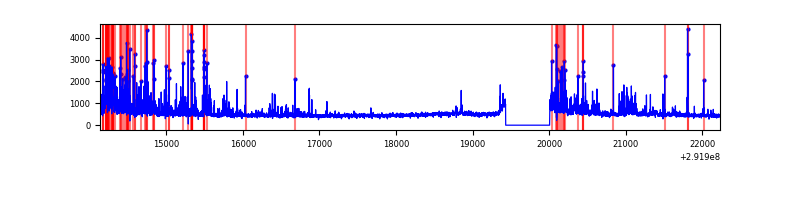 |
| C | 8097 | 7523 | 1 | 1 | 0.01% | 0.01% | 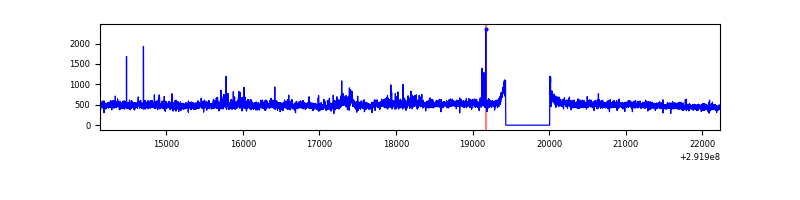 |
| D | 8097 | 7523 | 778 | 778 | 9.61% | 10.34% | 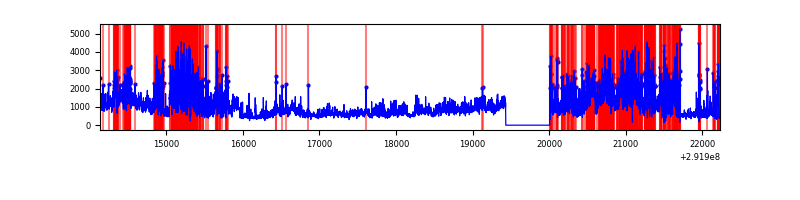 |
Top three noisy pixels from each quadrant. If the there are fewer than three noisy pixels in the level2.evt file, extra rows are filled as -1
| Pixel properties | Quadrant properties | ||||||
|---|---|---|---|---|---|---|---|
| Quadrant | DetID | PixID | Counts | Sigma | Mean | Median | Sigma |
| A | 13 | 254 | 8565 | 41.7 | 899 | 878 | 184.3 |
| A | 0 | 226 | 7829 | 37.71 | 899 | 878 | 184.3 |
| A | 3 | 137 | 6979 | 33.1 | 899 | 878 | 184.3 |
| B | 3 | 112 | 645475 | 3729.27 | 891 | 867 | 172.9 |
| B | 7 | 220 | 206860 | 1191.74 | 891 | 867 | 172.9 |
| B | 0 | 197 | 30382 | 170.75 | 891 | 867 | 172.9 |
| C | 3 | 233 | 241306 | 1181.08 | 866 | 873 | 203.6 |
| C | 14 | 238 | 134537 | 656.6 | 866 | 873 | 203.6 |
| C | 0 | 207 | 20538 | 96.6 | 866 | 873 | 203.6 |
| D | 7 | 238 | 4214739 | 20587.31 | 836 | 810 | 204.7 |
| D | 12 | 218 | 339112 | 1652.79 | 836 | 810 | 204.7 |
| D | 9 | 68 | 325653 | 1587.03 | 836 | 810 | 204.7 |
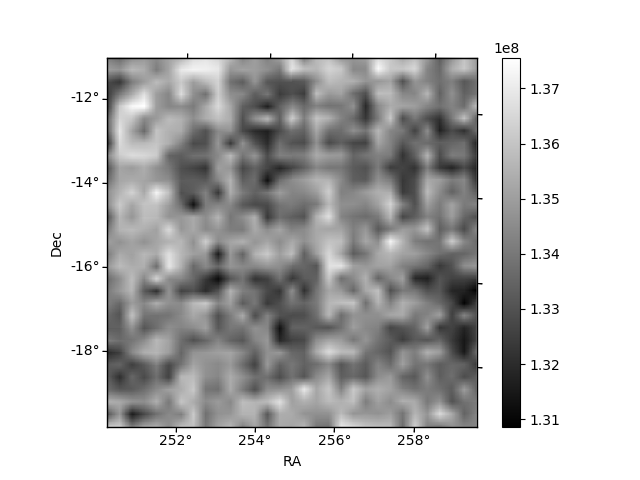
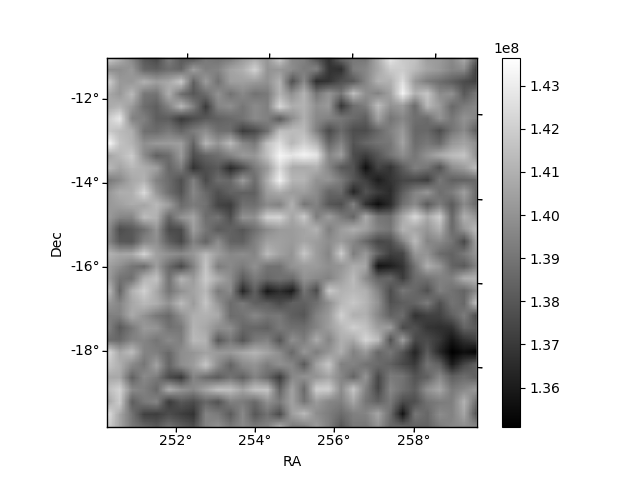
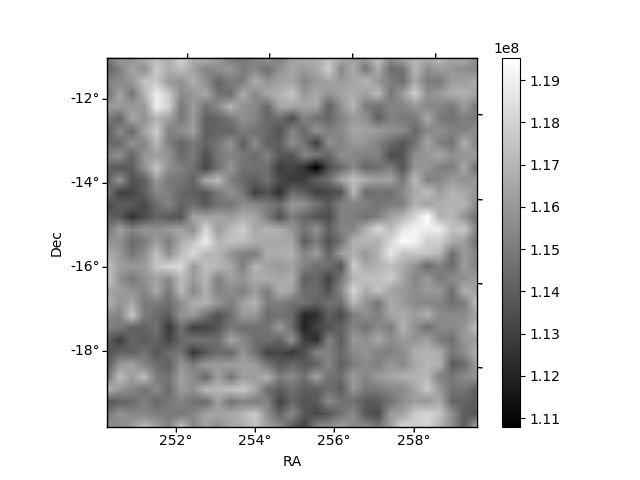
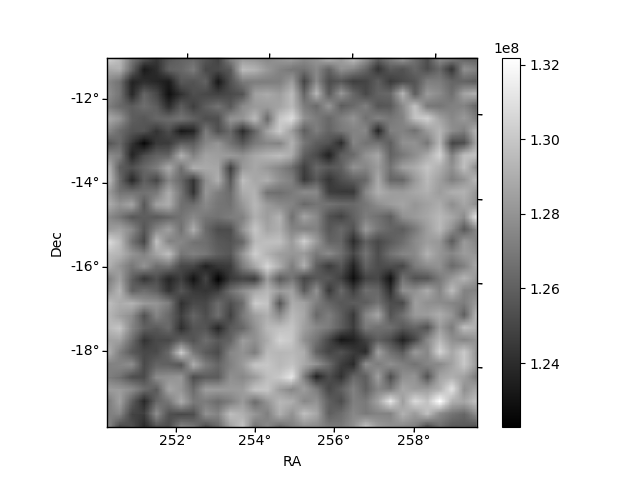
Histogram calculated using DETX and DETY for each event in the final _common_clean file
| Quadrant A | 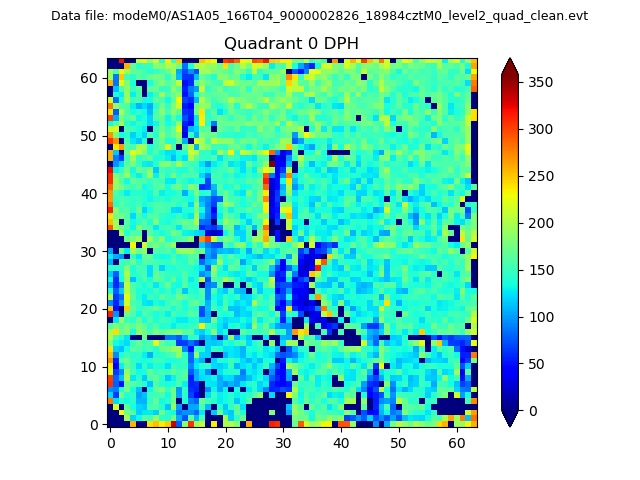 |
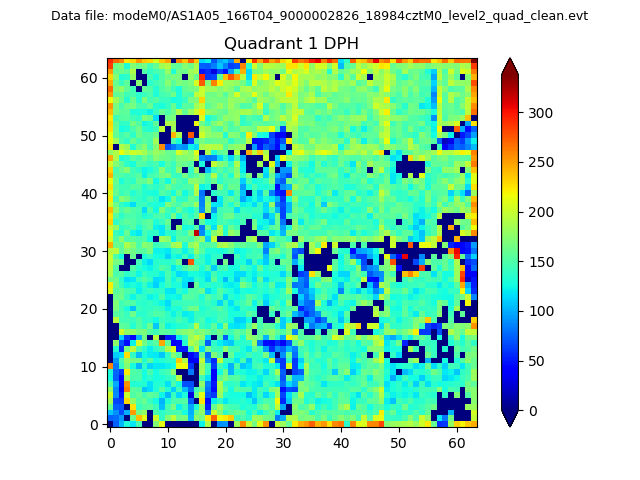 |
Quadrant B |
|---|---|---|---|
| Quadrant D | 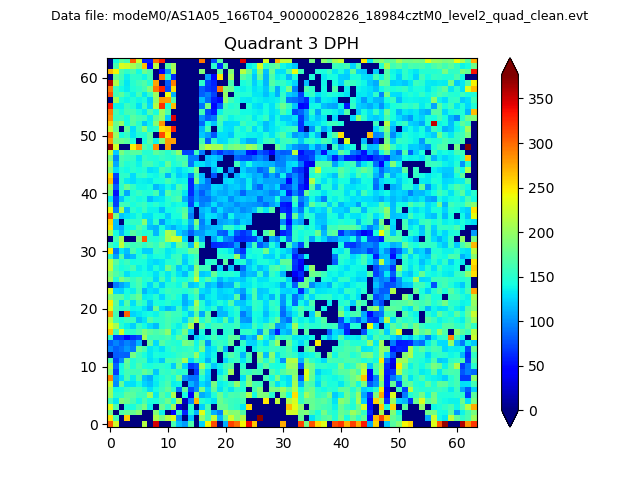 |
 |
Quadrant C |
| Plot type | Count rate plots | Images |
|---|---|---|
| Comparison with Poisson distribution Blue bars denote a histogram of data divided into 1 sec bins. Red curve is a Poisson curve with rate = median count rate of data. |
 |
 |
| Quadrant-wise count rates Data is divided into 100 sec bins |
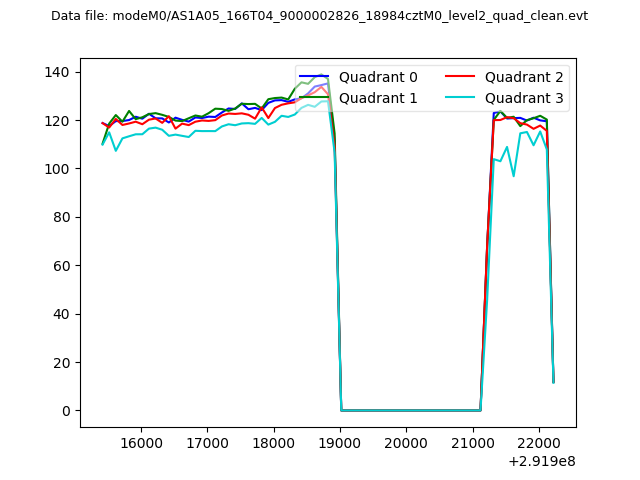 |
|
| Module-wise count rates for Quadrant A Data is divided into 100 sec bins |
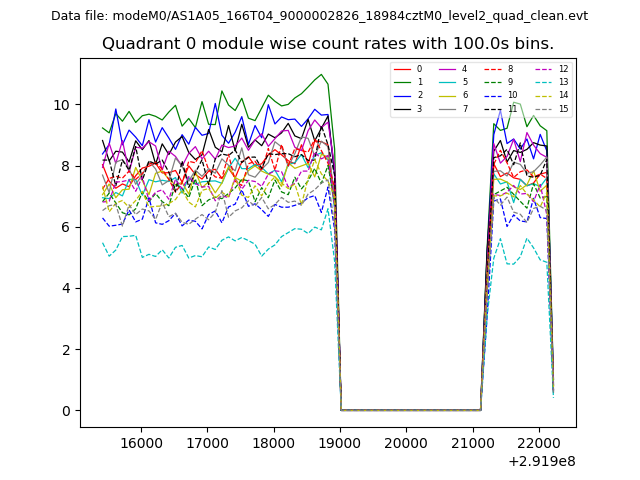 |
 |
| Module-wise count rates for Quadrant B Data is divided into 100 sec bins |
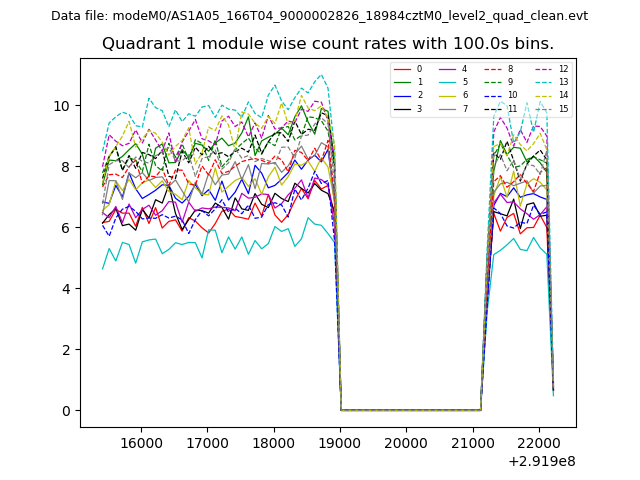 |
 |
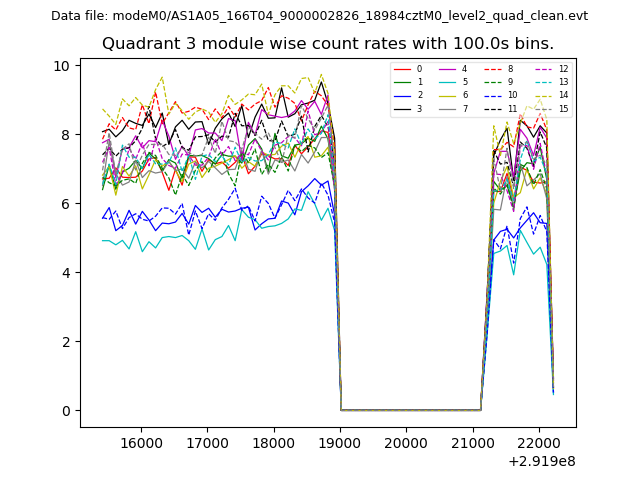
| Module-wise count rates for Quadrant C Data is divided into 100 sec bins |
 |
 |
| Module-wise count rates for Quadrant D Data is divided into 100 sec bins |
 |
 |
| Parameter | Plot |
|---|---|
| CZT HV Monitor | 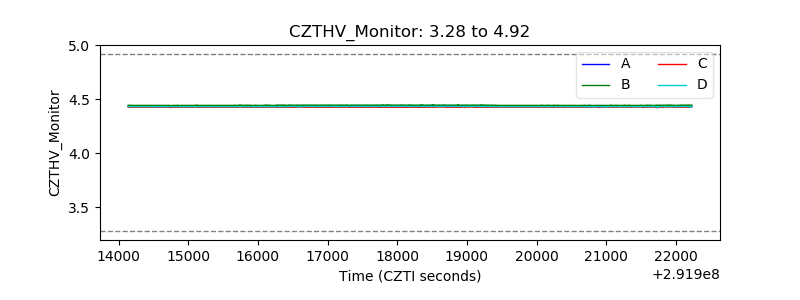 |
| D_VDD | 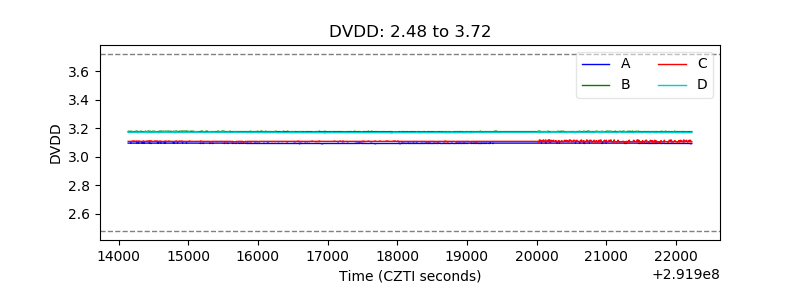 |
| Temperature 1 | 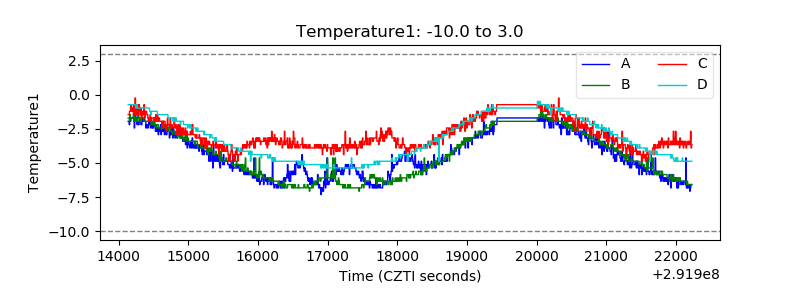 |
| Veto HV Monitor | 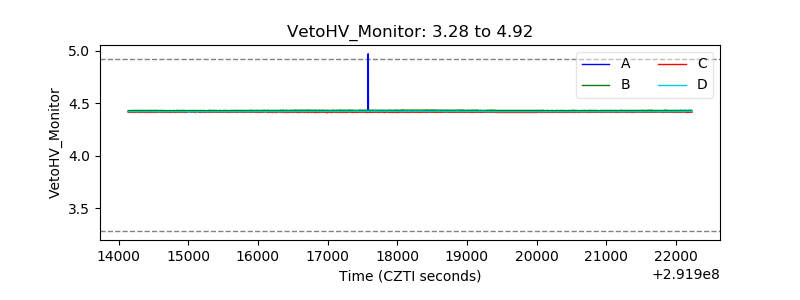 |
| Veto LLD | 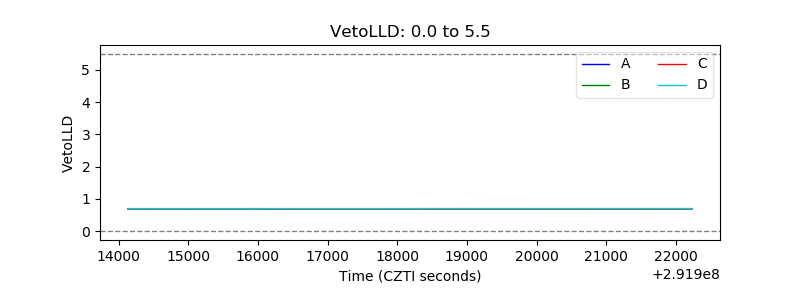 |
| Alpha Counter | 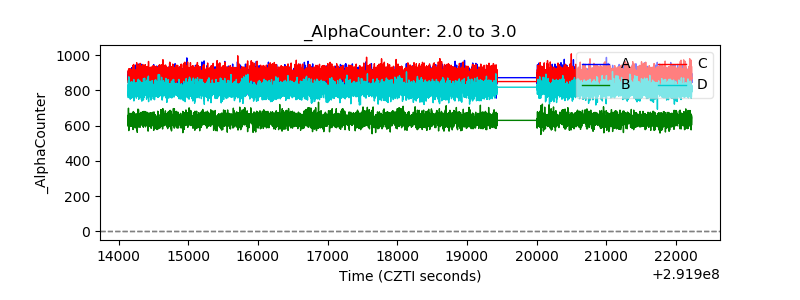 |
| _CPM_Rate | 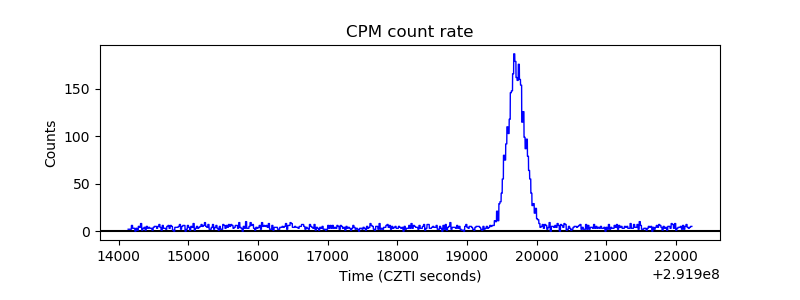 |
| CZT Counter |  |
| +2.5 Volts monitor |  |
| +5 Volts monitor |  |
| _ROLL_ROT | 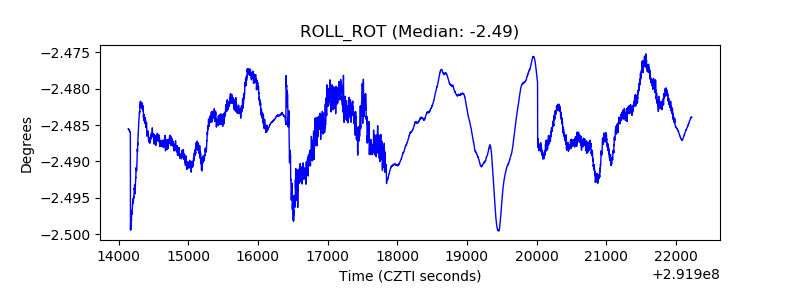 |
| _Roll_DEC | 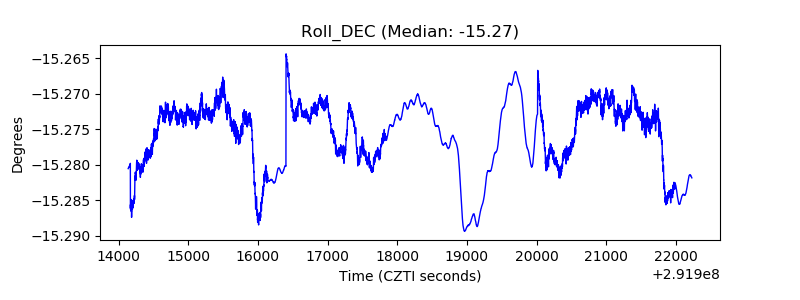 |
| _Roll_RA | 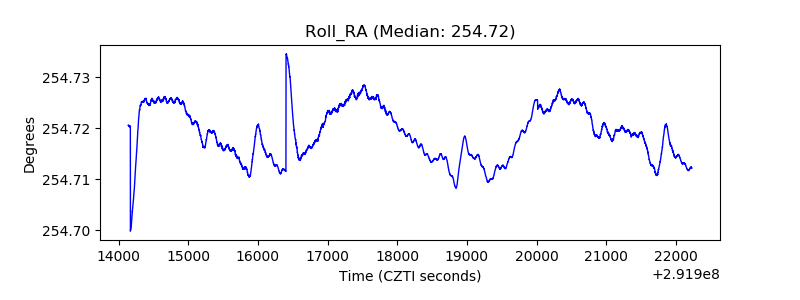 |
| Veto Counter | 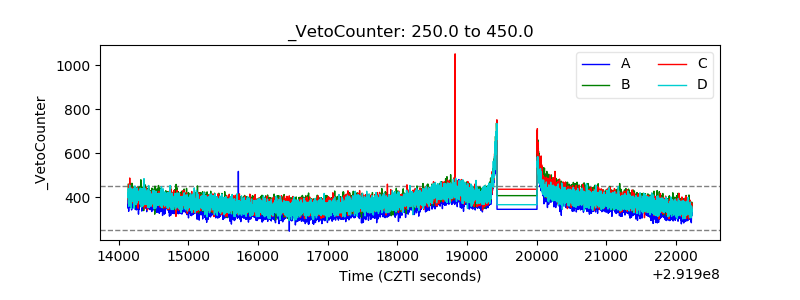 |