| Param | Original file | Final file |
|---|---|---|
| Filename | modeM0/AS1A05_132T01_9000002828cztM0_level2.fits | modeM0/AS1A05_132T01_9000002828cztM0_level2_quad_clean.evt |
| Size (bytes) | 462,136,320 | 329,238,720 |
| Size | 440.7 MB | 314.0 MB |
| Events in quadrant A | 2,891,372 | 1,809,579 |
| Events in quadrant B | 2,775,978 | 1,834,662 |
| Events in quadrant C | 2,858,232 | 1,758,663 |
| Events in quadrant D | 2,207,992 | 1,307,492 |
| Mode M0 | |||
|---|---|---|---|
| Quadrant | BADHDUFLAG | Total packets | Discarded packets |
| A | 0 | 98949 | 0 |
| B | 0 | 105446 | 0 |
| C | 0 | 104866 | 0 |
| D | 0 | 196575 | 0 |
| Mode SS | |||
|---|---|---|---|
| Quadrant | BADHDUFLAG | Total packets | Discarded packets |
| A | 0 | 968 | 0 |
| B | 0 | 968 | 0 |
| C | 0 | 968 | 0 |
| D | 0 | 968 | 0 |
| Mode M9 | |||
|---|---|---|---|
| Quadrant | BADHDUFLAG | Total packets | Discarded packets |
| A | 0 | 92 | 0 |
| B | 0 | 92 | 0 |
| C | 0 | 92 | 0 |
| D | 0 | 92 | 0 |
| Quadrant | Total seconds | Saturated seconds | Saturation percentage |
|---|---|---|---|
| A | 47475 | 373 | 0.785677% |
| B | 47476 | 802 | 1.689275% |
| C | 47476 | 739 | 1.556576% |
| D | 47475 | 9163 | 19.300685% |
Noise dominated data is calculated using 1-second bins in cleaned event files. If a bin has >2000 counts, and if more than 50% of those come from <1% of pixels, then it is considered to be noise-dominated and hence unusable.
| Quadrant | # 1 sec bins | Bins with >0 counts | Bins with >2000 counts | High rate bins dominated by noise | Noise dominated (total time) | Noise dominated (detector-on time) | Marked lightcurve |
|---|---|---|---|---|---|---|---|
| A | 53916 | 46011 | 0 | 0 | 0.00% | 0.00% |  |
| B | 53916 | 46009 | 0 | 0 | 0.00% | 0.00% |  |
| C | 53916 | 46010 | 0 | 0 | 0.00% | 0.00% |  |
| D | 53915 | 45900 | 0 | 0 | 0.00% | 0.00% | 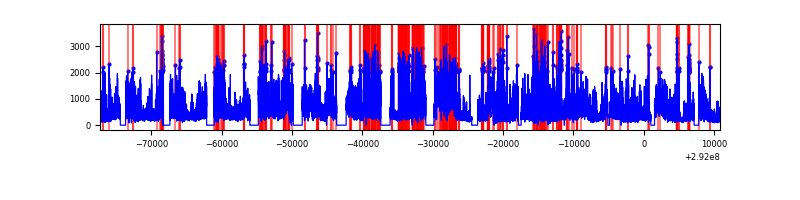 |
Top three noisy pixels from each quadrant. If the there are fewer than three noisy pixels in the level2.evt file, extra rows are filled as -1
| Pixel properties | Quadrant properties | ||||||
|---|---|---|---|---|---|---|---|
| Quadrant | DetID | PixID | Counts | Sigma | Mean | Median | Sigma |
| A | 0 | 29 | 2382 | 9.1 | 752 | 706 | 184.1 |
| A | 7 | 110 | 2260 | 8.44 | 752 | 706 | 184.1 |
| A | 9 | 19 | 2148 | 7.83 | 752 | 706 | 184.1 |
| B | 2 | 9 | 2204 | 10.4 | 734 | 700 | 144.7 |
| B | 3 | 17 | 1883 | 8.18 | 734 | 700 | 144.7 |
| B | 2 | 8 | 1877 | 8.14 | 734 | 700 | 144.7 |
| C | 12 | 250 | 2011 | 6.68 | 755 | 708 | 194.9 |
| C | 3 | 158 | 1973 | 6.49 | 755 | 708 | 194.9 |
| C | 12 | 241 | 1965 | 6.45 | 755 | 708 | 194.9 |
| D | 10 | 190 | 1693 | 6.65 | 631 | 575 | 168.2 |
| D | 10 | 189 | 1573 | 5.93 | 631 | 575 | 168.2 |
| D | 6 | 231 | 1565 | 5.89 | 631 | 575 | 168.2 |
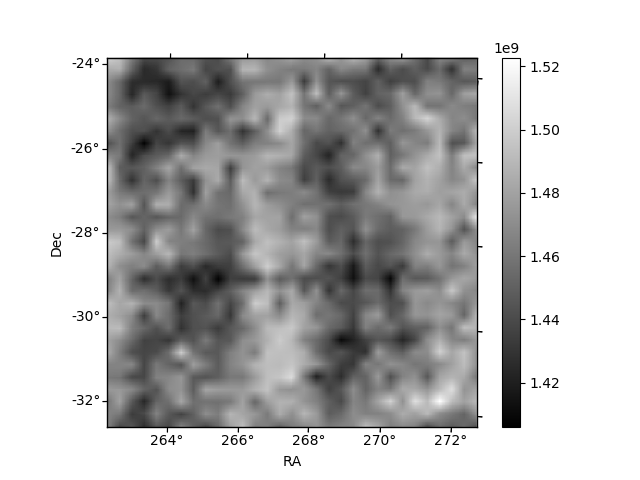
Histogram calculated using DETX and DETY for each event in the final _common_clean file
| Quadrant A |  |
 |
Quadrant B |
|---|---|---|---|
| Quadrant D | 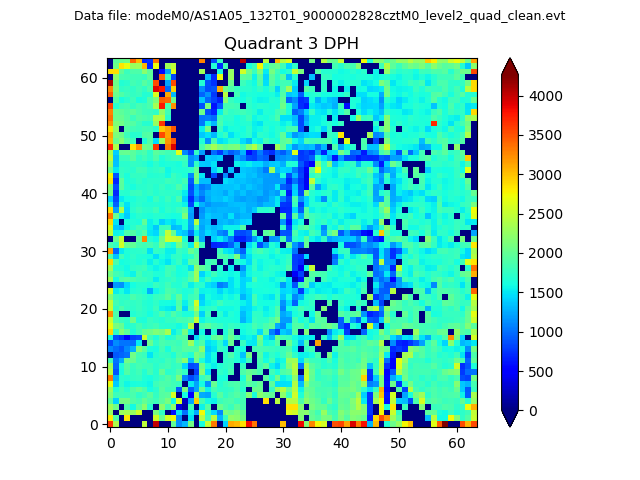 |
 |
Quadrant C |
| Plot type | Count rate plots | Images |
|---|---|---|
| Comparison with Poisson distribution Blue bars denote a histogram of data divided into 1 sec bins. Red curve is a Poisson curve with rate = median count rate of data. |
 |
 |
| Quadrant-wise count rates Data is divided into 100 sec bins |
 |
|
| Module-wise count rates for Quadrant A Data is divided into 100 sec bins |
 |
 |
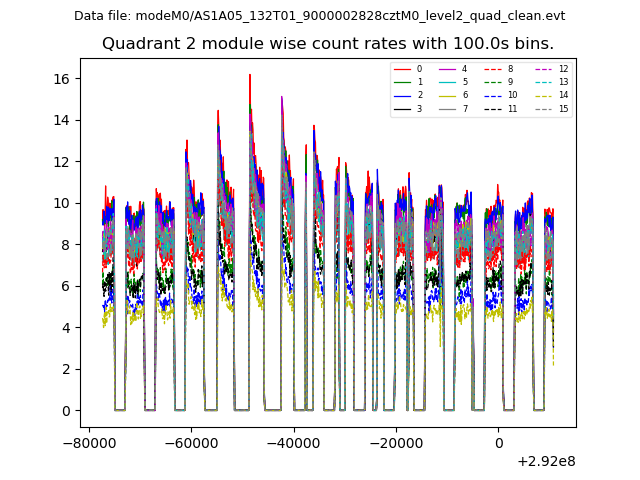
| Module-wise count rates for Quadrant B Data is divided into 100 sec bins |
 |
 |
| Module-wise count rates for Quadrant C Data is divided into 100 sec bins |
 |
 |
| Module-wise count rates for Quadrant D Data is divided into 100 sec bins |
 |
 |
| Parameter | Plot |
|---|---|
| CZT HV Monitor |  |
| D_VDD |  |
| Temperature 1 |  |
| Veto HV Monitor |  |
| Veto LLD | 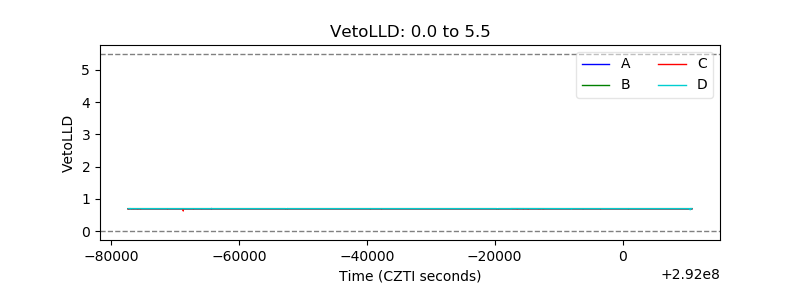 |
| Alpha Counter |  |
| _CPM_Rate |  |
| CZT Counter | 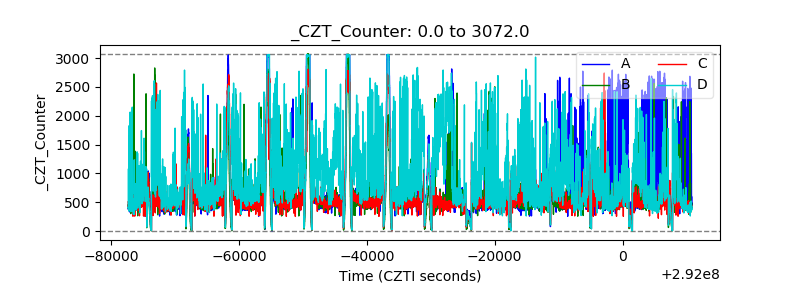 |
| +2.5 Volts monitor |  |
| +5 Volts monitor |  |
| _ROLL_ROT | 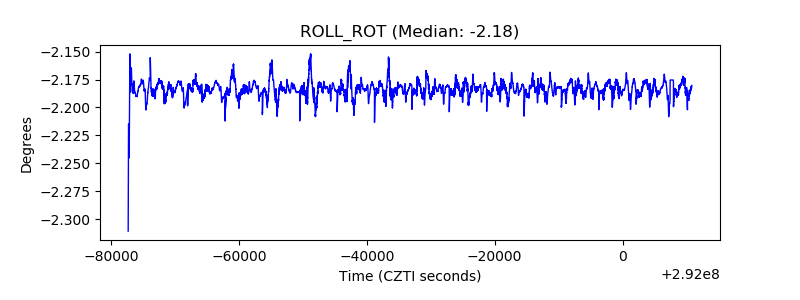 |
| _Roll_DEC | 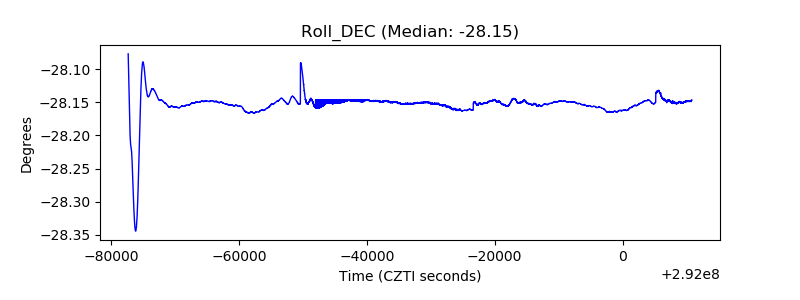 |
| _Roll_RA |  |
| Veto Counter |  |