| Param | Original file | Final file |
|---|---|---|
| Filename | modeM0/AS1A05_132T01_9000002828_18984cztM0_level2.evt | modeM0/AS1A05_132T01_9000002828_18984cztM0_level2_quad_clean.evt |
| Size (bytes) | 356,186,880 | 56,675,520 |
| Size | 339.7 MB | 54.0 MB |
| Events in quadrant A | 2,012,636 | 361,249 |
| Events in quadrant B | 2,571,646 | 362,937 |
| Events in quadrant C | 2,161,358 | 352,383 |
| Events in quadrant D | 3,751,229 | 339,285 |
| Mode M0 | |||
|---|---|---|---|
| Quadrant | BADHDUFLAG | Total packets | Discarded packets |
| A | 0 | 8670 | 1 |
| B | 0 | 10406 | 1 |
| C | 0 | 8882 | 1 |
| D | 0 | 14214 | 1 |
| Mode SS | |||
|---|---|---|---|
| Quadrant | BADHDUFLAG | Total packets | Discarded packets |
| A | 0 | 88 | 0 |
| B | 0 | 88 | 0 |
| C | 0 | 88 | 0 |
| D | 0 | 88 | 0 |
| Mode M9 | |||
|---|---|---|---|
| Quadrant | BADHDUFLAG | Total packets | Discarded packets |
| A | 0 | 8 | 0 |
| B | 0 | 8 | 0 |
| C | 0 | 8 | 0 |
| D | 0 | 8 | 0 |
| Quadrant | Total seconds | Saturated seconds | Saturation percentage |
|---|---|---|---|
| A | 4260 | 25 | 0.586854% |
| B | 4260 | 180 | 4.225352% |
| C | 4260 | 50 | 1.173709% |
| D | 4260 | 335 | 7.863850% |
Noise dominated data is calculated using 1-second bins in cleaned event files. If a bin has >2000 counts, and if more than 50% of those come from <1% of pixels, then it is considered to be noise-dominated and hence unusable.
| Quadrant | # 1 sec bins | Bins with >0 counts | Bins with >2000 counts | High rate bins dominated by noise | Noise dominated (total time) | Noise dominated (detector-on time) | Marked lightcurve |
|---|---|---|---|---|---|---|---|
| A | 5020 | 4261 | 0 | 0 | 0.00% | 0.00% | 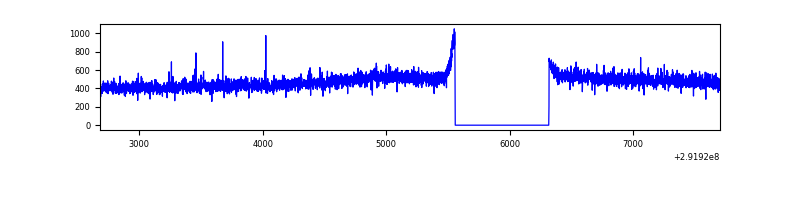 |
| B | 5020 | 4261 | 102 | 102 | 2.03% | 2.39% | 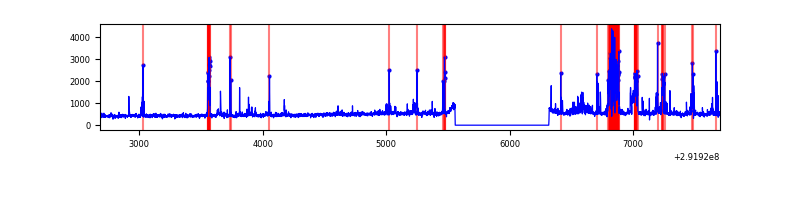 |
| C | 5020 | 4261 | 5 | 5 | 0.10% | 0.12% | 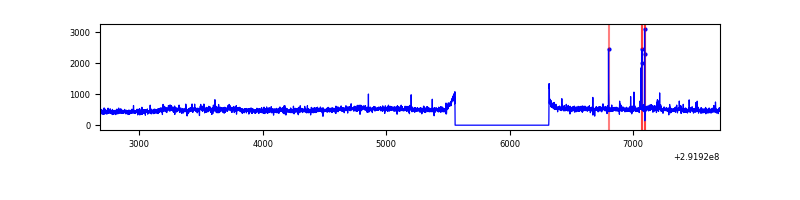 |
| D | 5020 | 4261 | 239 | 239 | 4.76% | 5.61% | 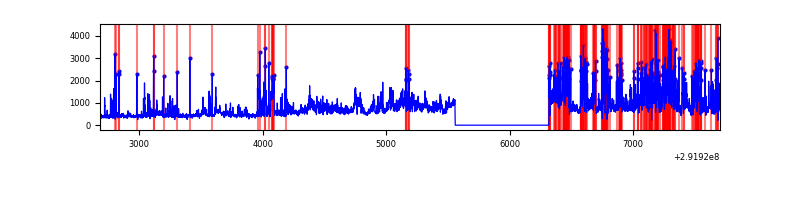 |
Top three noisy pixels from each quadrant. If the there are fewer than three noisy pixels in the level2.evt file, extra rows are filled as -1
| Pixel properties | Quadrant properties | ||||||
|---|---|---|---|---|---|---|---|
| Quadrant | DetID | PixID | Counts | Sigma | Mean | Median | Sigma |
| A | 13 | 254 | 5539 | 47.36 | 521 | 509 | 106.2 |
| A | 0 | 226 | 4651 | 39.0 | 521 | 509 | 106.2 |
| A | 3 | 137 | 4182 | 34.58 | 521 | 509 | 106.2 |
| B | 3 | 112 | 505839 | 5046.76 | 512 | 499 | 100.1 |
| B | 7 | 220 | 23272 | 227.43 | 512 | 499 | 100.1 |
| B | 12 | 111 | 11810 | 112.96 | 512 | 499 | 100.1 |
| C | 14 | 238 | 77436 | 646.47 | 502 | 505 | 119.0 |
| C | 3 | 233 | 76375 | 637.56 | 502 | 505 | 119.0 |
| C | 0 | 207 | 38640 | 320.46 | 502 | 505 | 119.0 |
| D | 7 | 238 | 1752290 | 14346.77 | 496 | 481 | 122.1 |
| D | 1 | 52 | 41262 | 333.98 | 496 | 481 | 122.1 |
| D | 12 | 110 | 30397 | 245.0 | 496 | 481 | 122.1 |
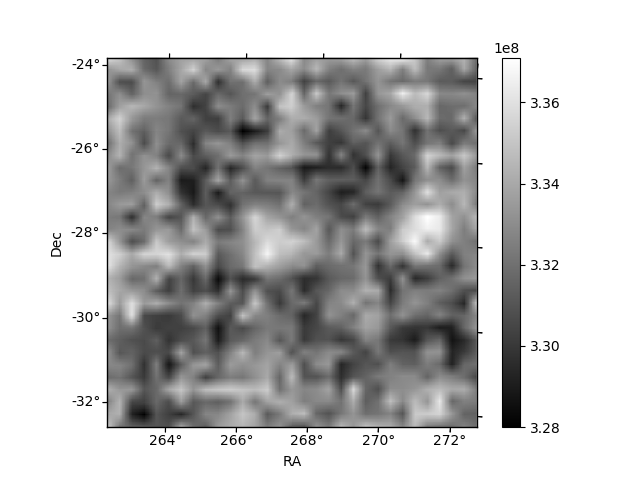
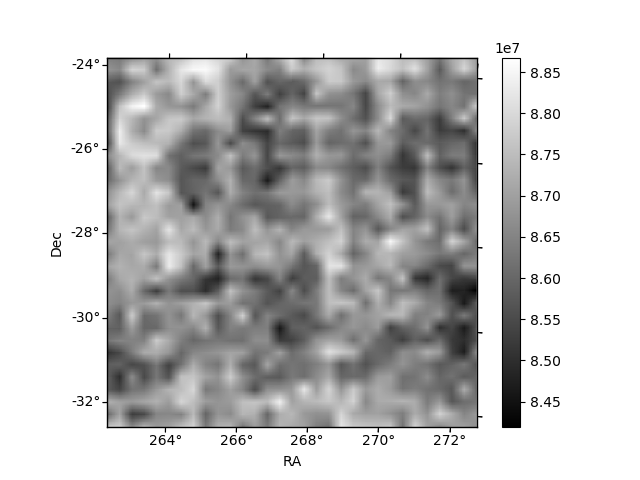
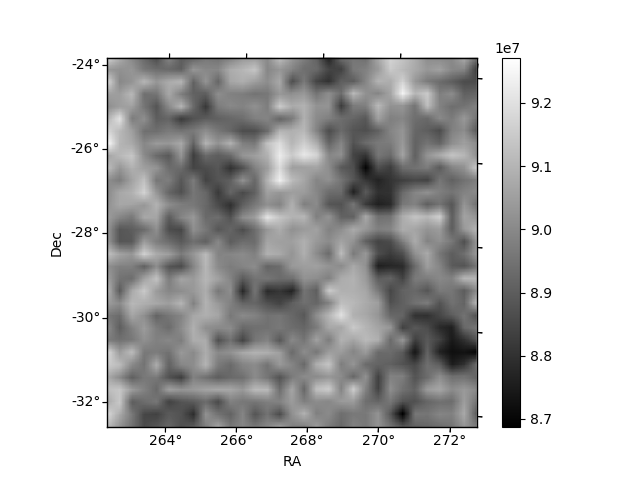
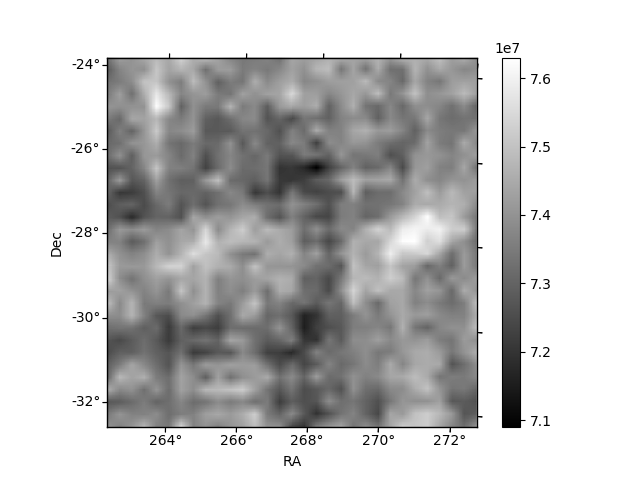
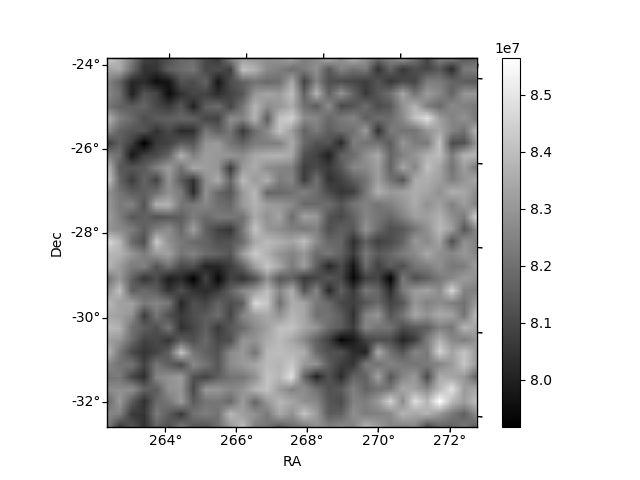
Histogram calculated using DETX and DETY for each event in the final _common_clean file
| Quadrant A | 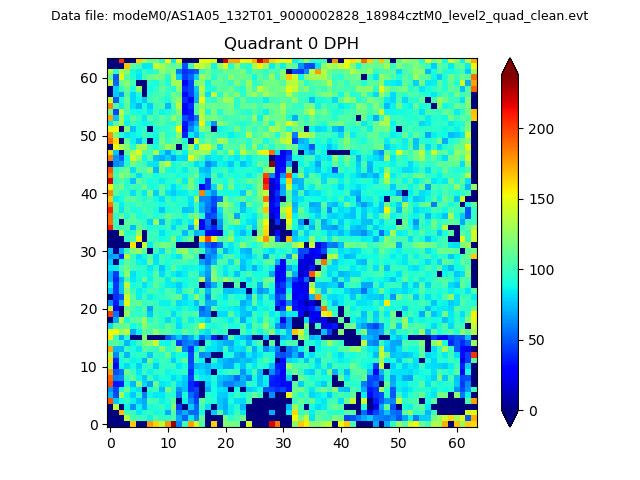 |
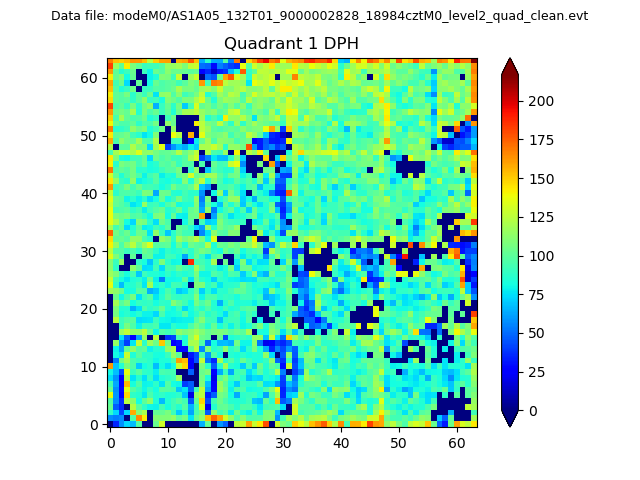 |
Quadrant B |
|---|---|---|---|
| Quadrant D | 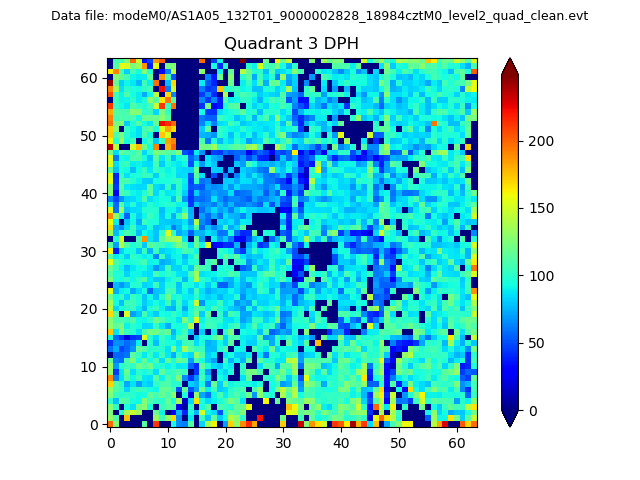 |
 |
Quadrant C |
| Plot type | Count rate plots | Images |
|---|---|---|
| Comparison with Poisson distribution Blue bars denote a histogram of data divided into 1 sec bins. Red curve is a Poisson curve with rate = median count rate of data. |
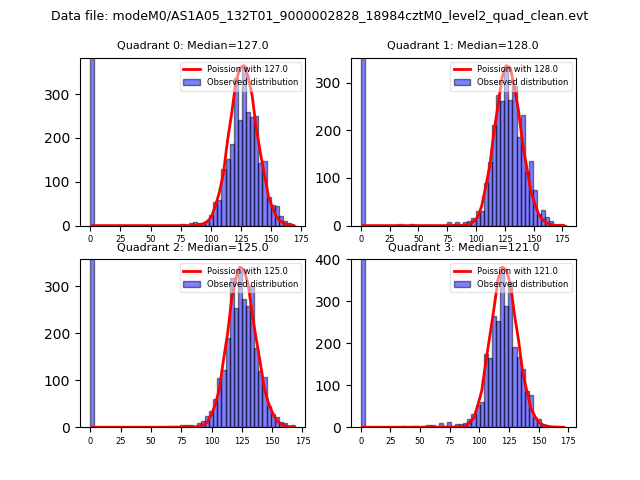 |
 |
| Quadrant-wise count rates Data is divided into 100 sec bins |
 |
|
| Module-wise count rates for Quadrant A Data is divided into 100 sec bins |
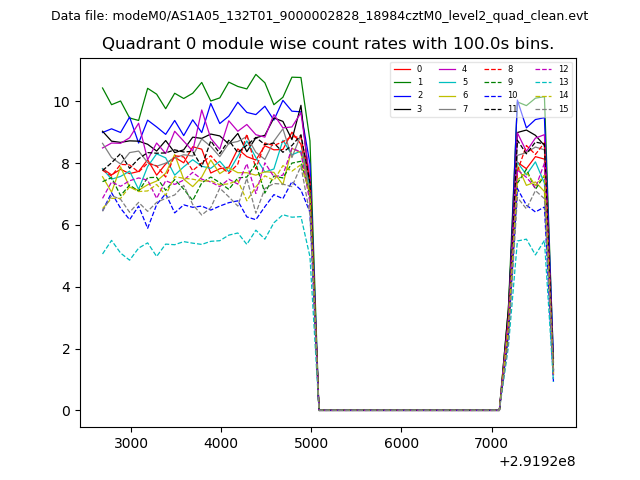 |
 |
| Module-wise count rates for Quadrant B Data is divided into 100 sec bins |
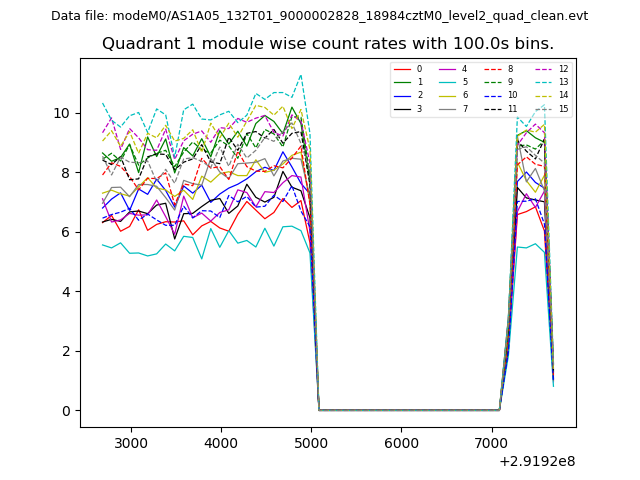 |
 |
| Module-wise count rates for Quadrant C Data is divided into 100 sec bins |
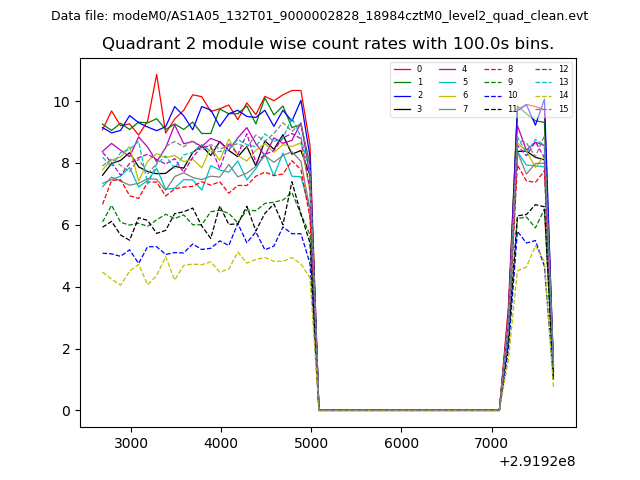 |
 |
| Module-wise count rates for Quadrant D Data is divided into 100 sec bins |
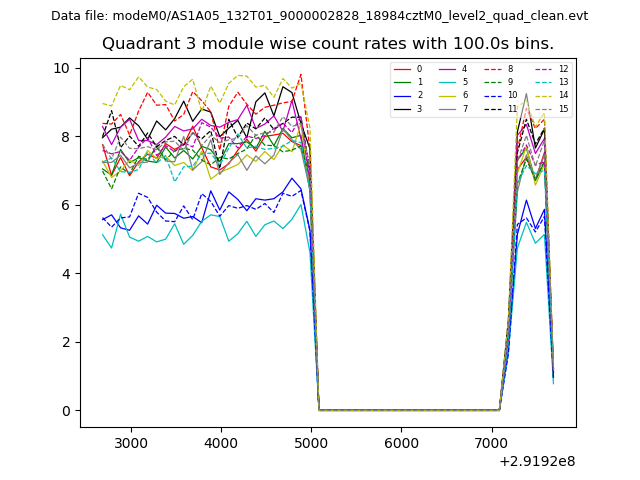 |
 |
| Parameter | Plot |
|---|---|
| CZT HV Monitor | 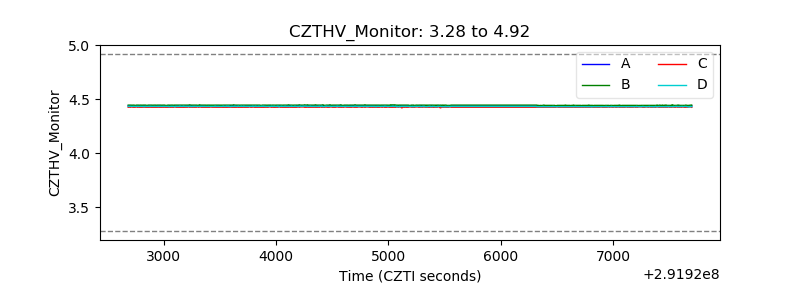 |
| D_VDD | 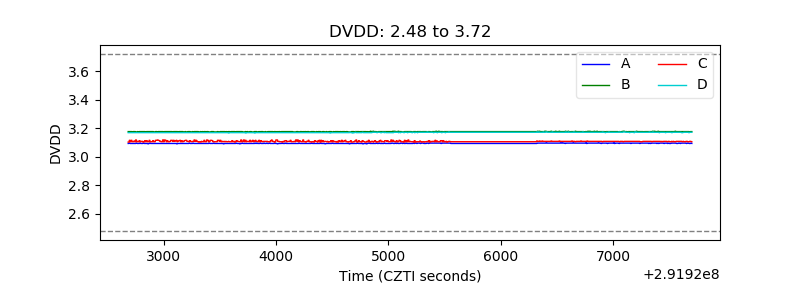 |
| Temperature 1 | 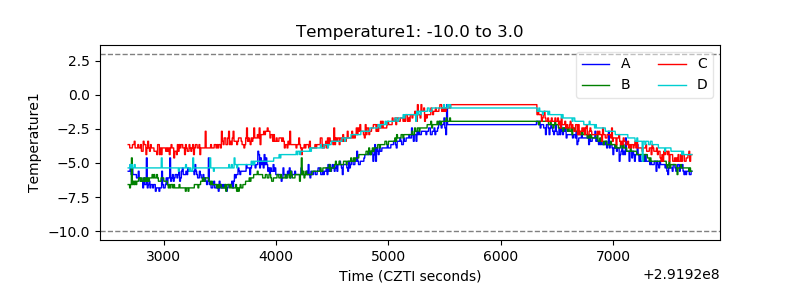 |
| Veto HV Monitor |  |
| Veto LLD | 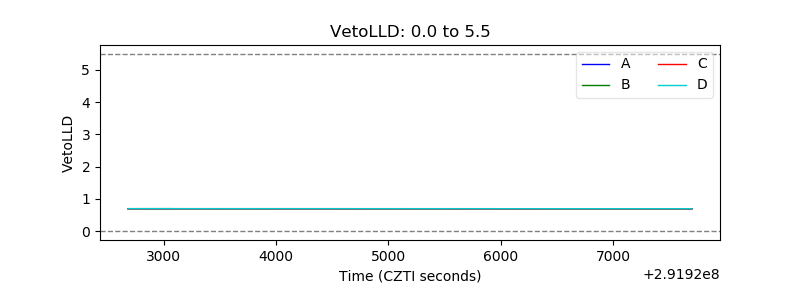 |
| Alpha Counter | 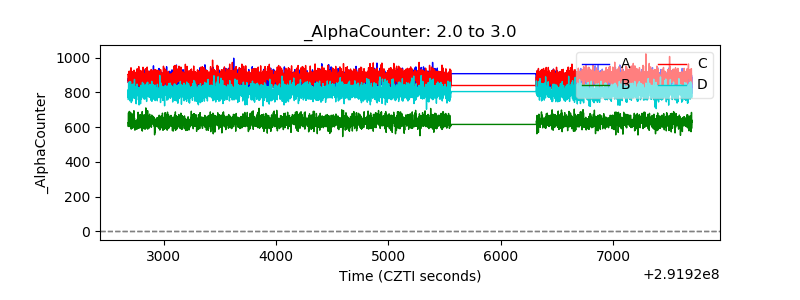 |
| _CPM_Rate | 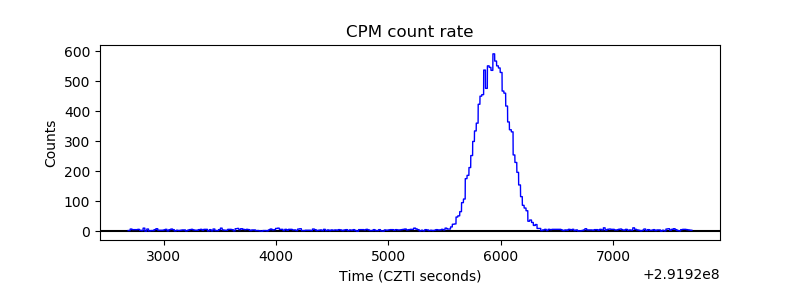 |
| CZT Counter | 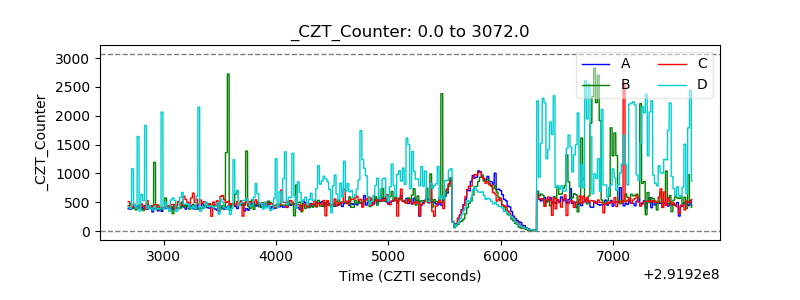 |
| +2.5 Volts monitor | 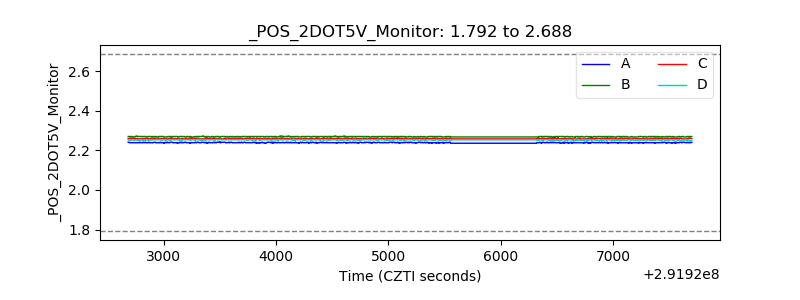 |
| +5 Volts monitor |  |
| _ROLL_ROT | 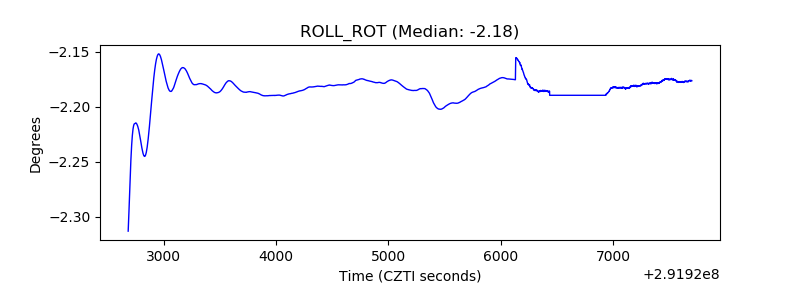 |
| _Roll_DEC | 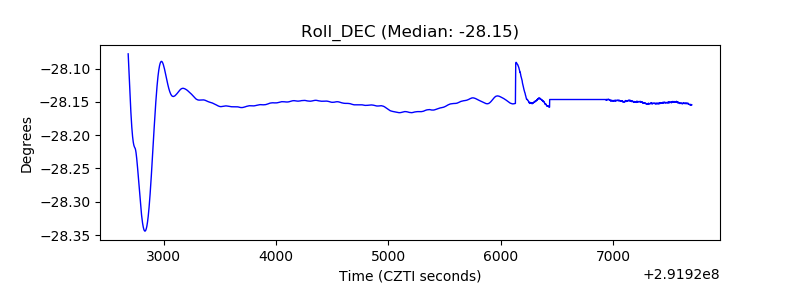 |
| _Roll_RA | 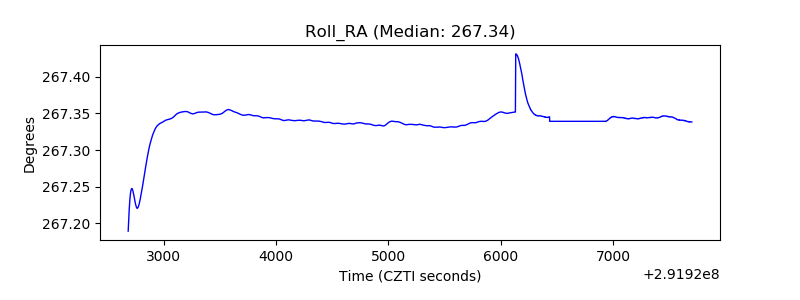 |
| Veto Counter | 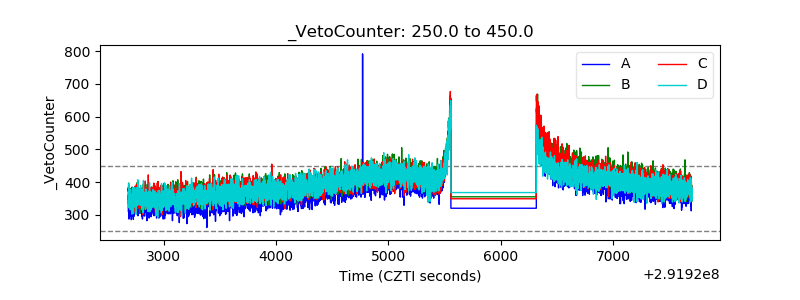 |