| Param | Original file | Final file |
|---|---|---|
| Filename | modeM0/AS1A05_132T01_9000002828_18986cztM0_level2.evt | modeM0/AS1A05_132T01_9000002828_18986cztM0_level2_quad_clean.evt |
| Size (bytes) | 557,328,960 | 100,537,920 |
| Size | 531.5 MB | 95.9 MB |
| Events in quadrant A | 3,296,197 | 655,971 |
| Events in quadrant B | 3,664,388 | 672,071 |
| Events in quadrant C | 3,595,666 | 649,121 |
| Events in quadrant D | 5,881,539 | 613,597 |
| Mode M0 | |||
|---|---|---|---|
| Quadrant | BADHDUFLAG | Total packets | Discarded packets |
| A | 0 | 13929 | 2 |
| B | 0 | 15111 | 3 |
| C | 0 | 14559 | 2 |
| D | 0 | 22114 | 2 |
| Mode SS | |||
|---|---|---|---|
| Quadrant | BADHDUFLAG | Total packets | Discarded packets |
| A | 0 | 132 | 0 |
| B | 0 | 132 | 0 |
| C | 0 | 132 | 0 |
| D | 0 | 132 | 0 |
| Mode M9 | |||
|---|---|---|---|
| Quadrant | BADHDUFLAG | Total packets | Discarded packets |
| A | 0 | 12 | 0 |
| B | 0 | 13 | 0 |
| C | 0 | 13 | 0 |
| D | 0 | 13 | 0 |
| Quadrant | Total seconds | Saturated seconds | Saturation percentage |
|---|---|---|---|
| A | 6512 | 44 | 0.675676% |
| B | 6511 | 121 | 1.858393% |
| C | 6511 | 58 | 0.890800% |
| D | 6511 | 488 | 7.495008% |
Noise dominated data is calculated using 1-second bins in cleaned event files. If a bin has >2000 counts, and if more than 50% of those come from <1% of pixels, then it is considered to be noise-dominated and hence unusable.
| Quadrant | # 1 sec bins | Bins with >0 counts | Bins with >2000 counts | High rate bins dominated by noise | Noise dominated (total time) | Noise dominated (detector-on time) | Marked lightcurve |
|---|---|---|---|---|---|---|---|
| A | 7597 | 6513 | 7 | 7 | 0.09% | 0.11% | 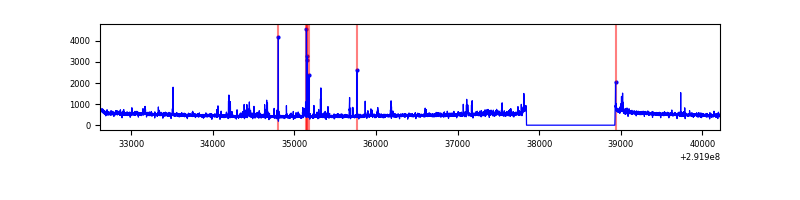 |
| B | 7596 | 6512 | 44 | 44 | 0.58% | 0.68% | 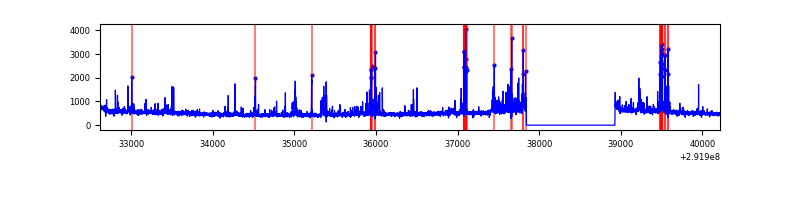 |
| C | 7596 | 6512 | 0 | 0 | 0.00% | 0.00% | 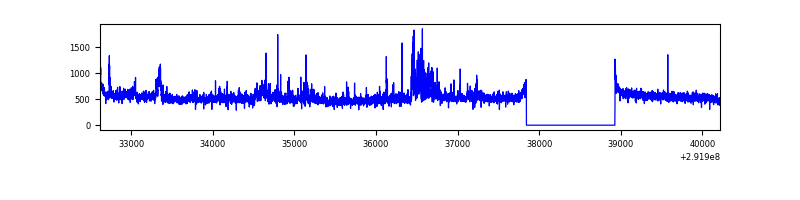 |
| D | 7596 | 6512 | 300 | 300 | 3.95% | 4.61% | 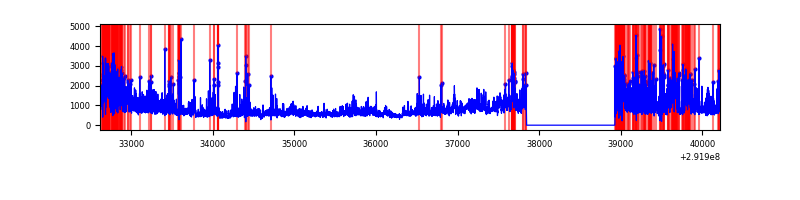 |
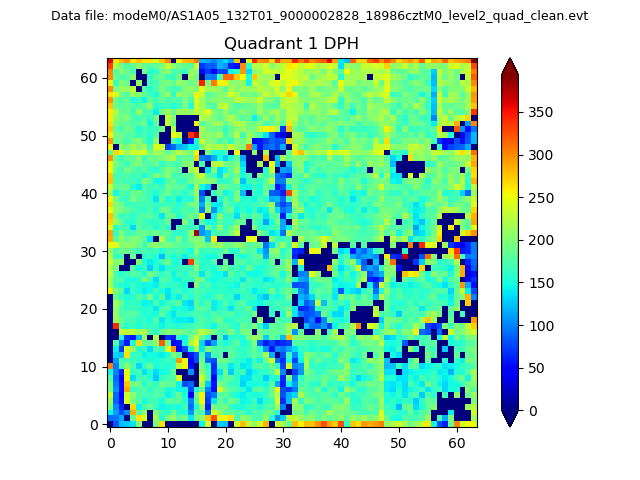
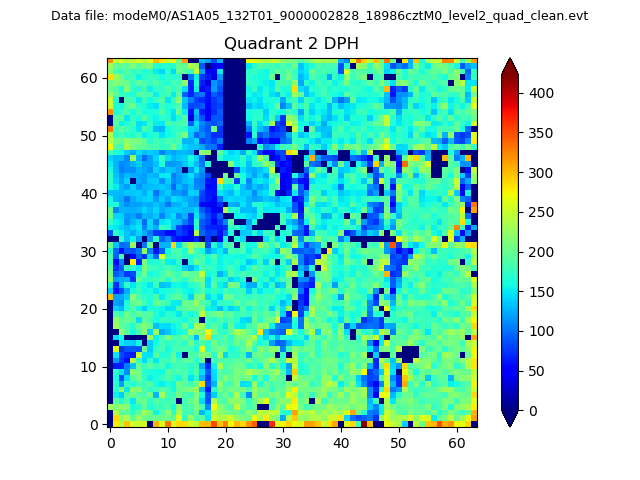
Top three noisy pixels from each quadrant. If the there are fewer than three noisy pixels in the level2.evt file, extra rows are filled as -1
| Pixel properties | Quadrant properties | ||||||
|---|---|---|---|---|---|---|---|
| Quadrant | DetID | PixID | Counts | Sigma | Mean | Median | Sigma |
| A | 4 | 2 | 183402 | 1113.69 | 805 | 790 | 164.0 |
| A | 13 | 254 | 7432 | 40.51 | 805 | 790 | 164.0 |
| A | 0 | 226 | 6988 | 37.8 | 805 | 790 | 164.0 |
| B | 3 | 112 | 405562 | 2605.42 | 808 | 789 | 155.4 |
| B | 7 | 220 | 62861 | 399.54 | 808 | 789 | 155.4 |
| B | 12 | 111 | 18304 | 112.74 | 808 | 789 | 155.4 |
| C | 3 | 233 | 202986 | 1095.42 | 783 | 790 | 184.6 |
| C | 8 | 208 | 147940 | 797.21 | 783 | 790 | 184.6 |
| C | 14 | 238 | 121253 | 652.63 | 783 | 790 | 184.6 |
| D | 7 | 238 | 2360662 | 12725.36 | 764 | 744 | 185.5 |
| D | 1 | 52 | 293052 | 1576.21 | 764 | 744 | 185.5 |
| D | 12 | 218 | 231837 | 1246.12 | 764 | 744 | 185.5 |
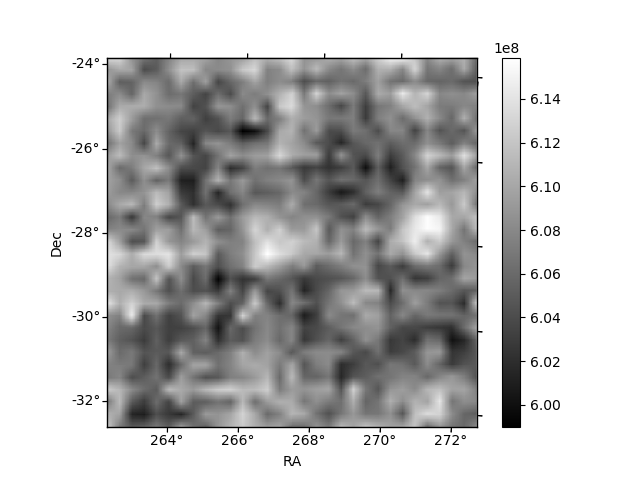
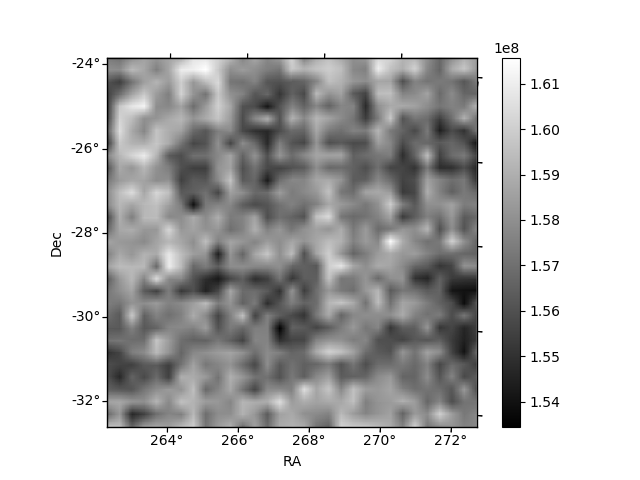
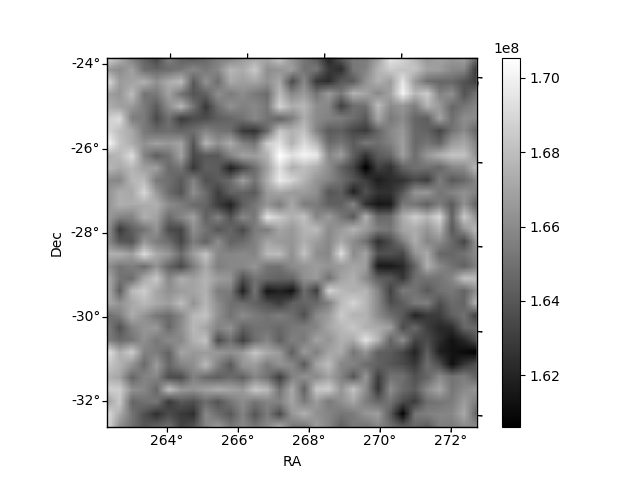
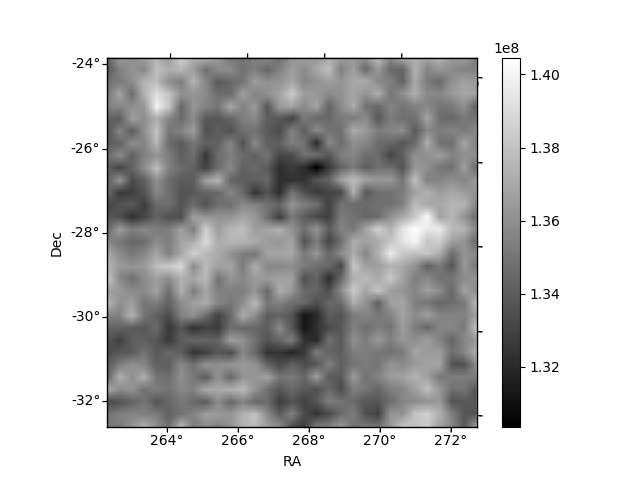
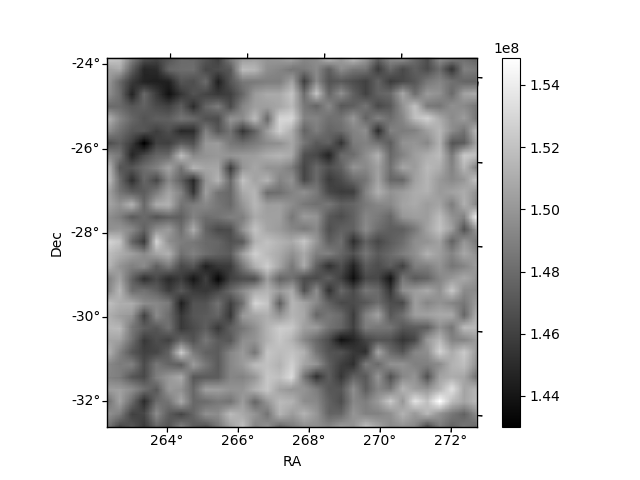
Histogram calculated using DETX and DETY for each event in the final _common_clean file
| Quadrant A | 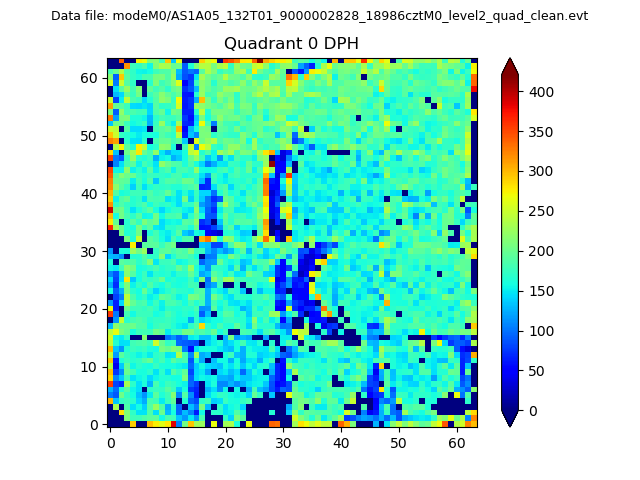 |
 |
Quadrant B |
|---|---|---|---|
| Quadrant D | 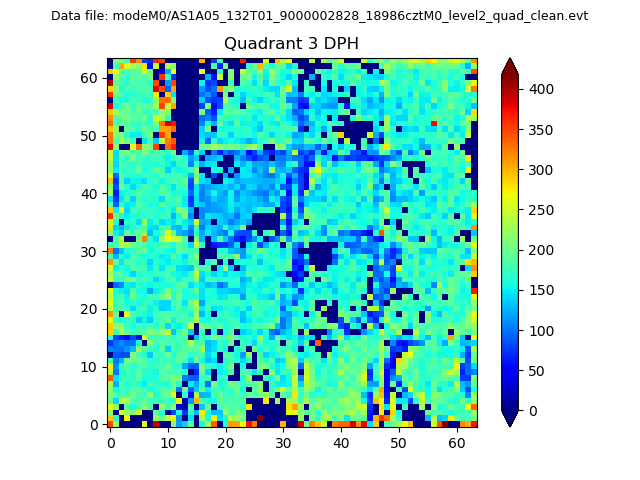 |
 |
Quadrant C |
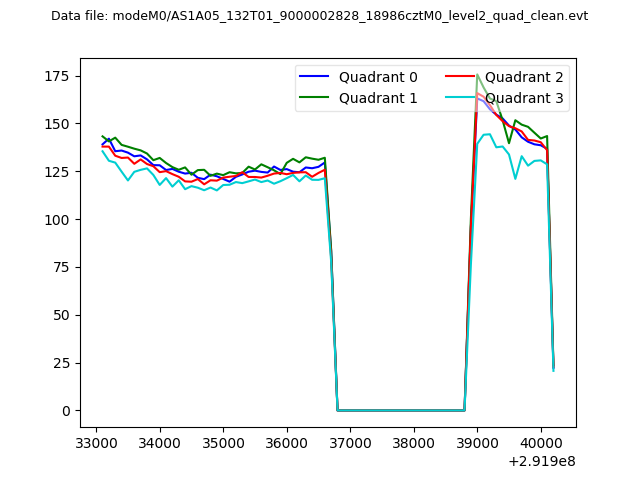
| Plot type | Count rate plots | Images |
|---|---|---|
| Comparison with Poisson distribution Blue bars denote a histogram of data divided into 1 sec bins. Red curve is a Poisson curve with rate = median count rate of data. |
 |
 |
| Quadrant-wise count rates Data is divided into 100 sec bins |
 |
|
| Module-wise count rates for Quadrant A Data is divided into 100 sec bins |
 |
 |
| Module-wise count rates for Quadrant B Data is divided into 100 sec bins |
 |
 |
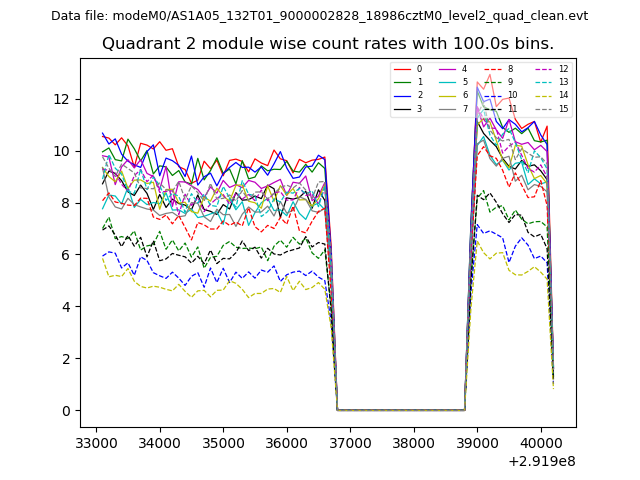
| Module-wise count rates for Quadrant C Data is divided into 100 sec bins |
 |
 |
| Module-wise count rates for Quadrant D Data is divided into 100 sec bins |
 |
 |
| Parameter | Plot |
|---|---|
| CZT HV Monitor |  |
| D_VDD | 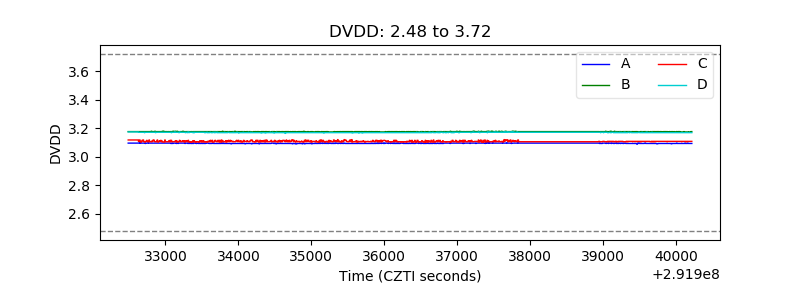 |
| Temperature 1 | 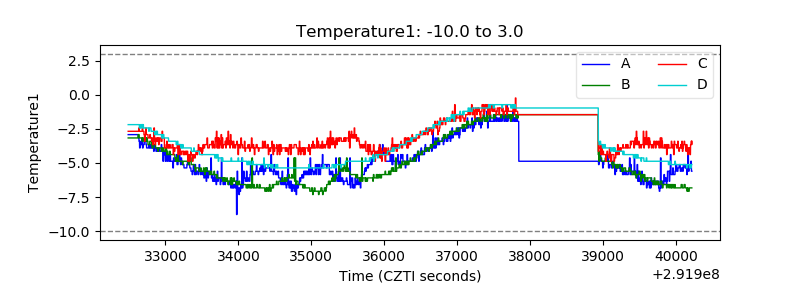 |
| Veto HV Monitor | 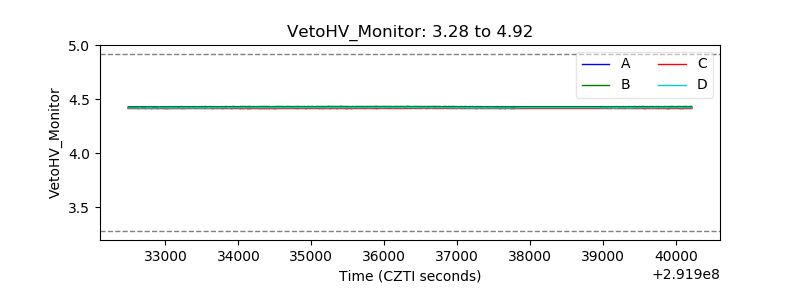 |
| Veto LLD | 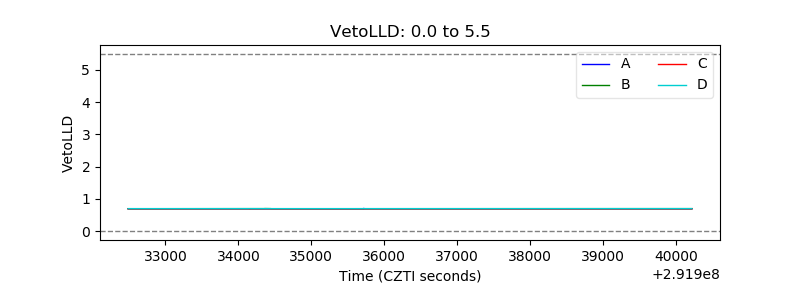 |
| Alpha Counter | 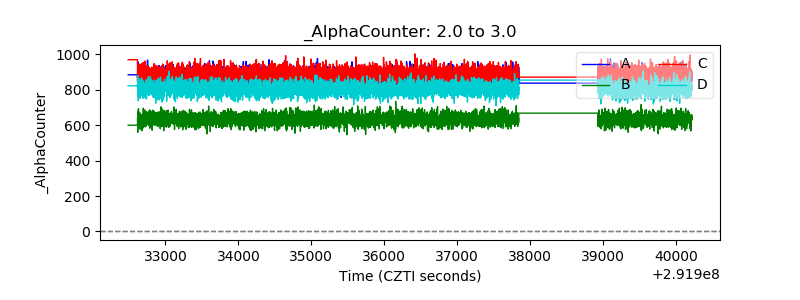 |
| _CPM_Rate | 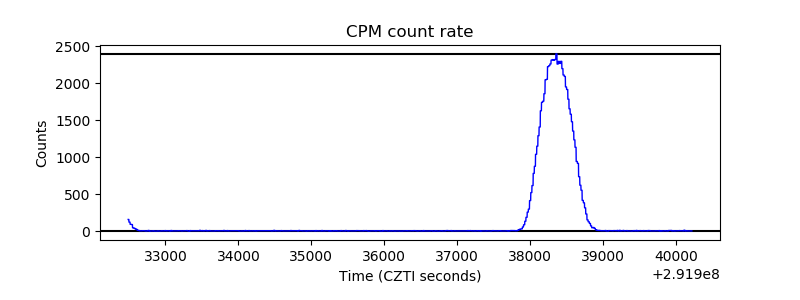 |
| CZT Counter | 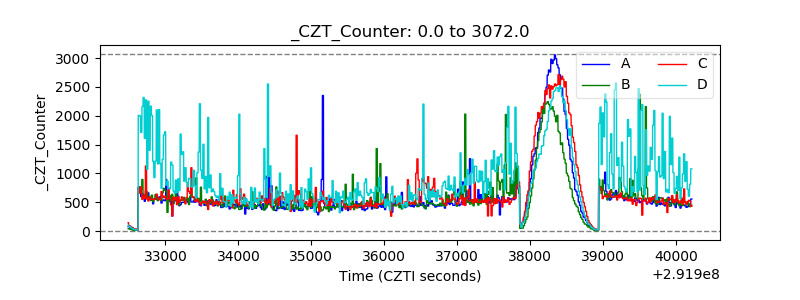 |
| +2.5 Volts monitor |  |
| +5 Volts monitor |  |
| _ROLL_ROT | 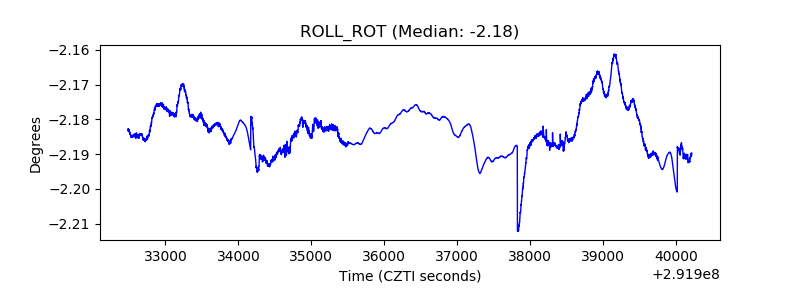 |
| _Roll_DEC | 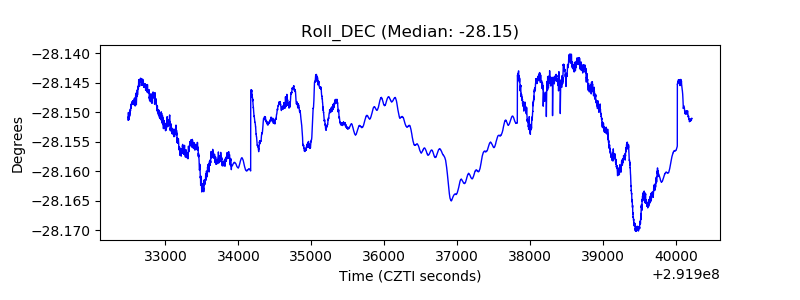 |
| _Roll_RA | 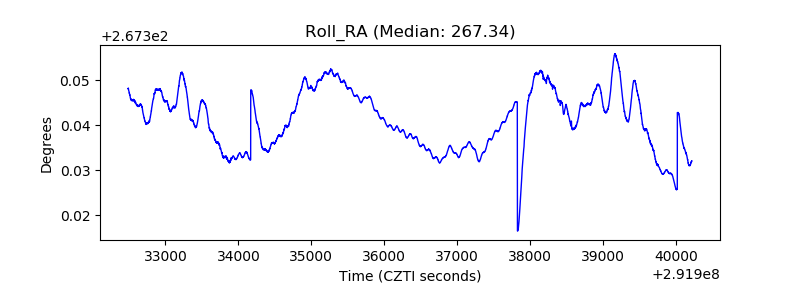 |
| Veto Counter |  |