| Param | Original file | Final file |
|---|---|---|
| Filename | modeM0/AS1A05_132T01_9000002828_18988cztM0_level2.evt | modeM0/AS1A05_132T01_9000002828_18988cztM0_level2_quad_clean.evt |
| Size (bytes) | 545,984,640 | 105,750,720 |
| Size | 520.7 MB | 100.9 MB |
| Events in quadrant A | 3,161,872 | 700,094 |
| Events in quadrant B | 3,560,074 | 720,663 |
| Events in quadrant C | 3,247,134 | 701,073 |
| Events in quadrant D | 6,139,966 | 641,600 |
| Mode M0 | |||
|---|---|---|---|
| Quadrant | BADHDUFLAG | Total packets | Discarded packets |
| A | 0 | 13351 | 2 |
| B | 0 | 14738 | 2 |
| C | 0 | 13535 | 2 |
| D | 0 | 22714 | 2 |
| Mode SS | |||
|---|---|---|---|
| Quadrant | BADHDUFLAG | Total packets | Discarded packets |
| A | 0 | 128 | 0 |
| B | 0 | 128 | 0 |
| C | 0 | 128 | 0 |
| D | 0 | 128 | 0 |
| Mode M9 | |||
|---|---|---|---|
| Quadrant | BADHDUFLAG | Total packets | Discarded packets |
| A | 0 | 16 | 0 |
| B | 0 | 17 | 0 |
| C | 0 | 17 | 0 |
| D | 0 | 17 | 0 |
| Quadrant | Total seconds | Saturated seconds | Saturation percentage |
|---|---|---|---|
| A | 6293 | 32 | 0.508502% |
| B | 6293 | 116 | 1.843318% |
| C | 6293 | 52 | 0.826315% |
| D | 6293 | 453 | 7.198474% |
Noise dominated data is calculated using 1-second bins in cleaned event files. If a bin has >2000 counts, and if more than 50% of those come from <1% of pixels, then it is considered to be noise-dominated and hence unusable.
| Quadrant | # 1 sec bins | Bins with >0 counts | Bins with >2000 counts | High rate bins dominated by noise | Noise dominated (total time) | Noise dominated (detector-on time) | Marked lightcurve |
|---|---|---|---|---|---|---|---|
| A | 7493 | 6294 | 2 | 2 | 0.03% | 0.03% | 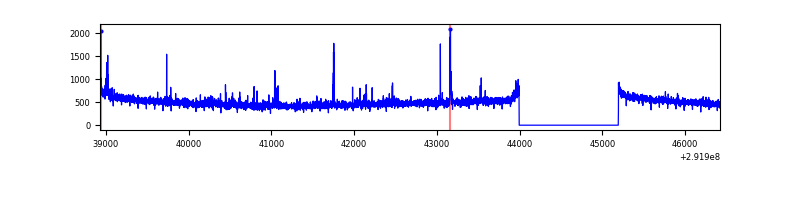 |
| B | 7493 | 6294 | 43 | 43 | 0.57% | 0.68% | 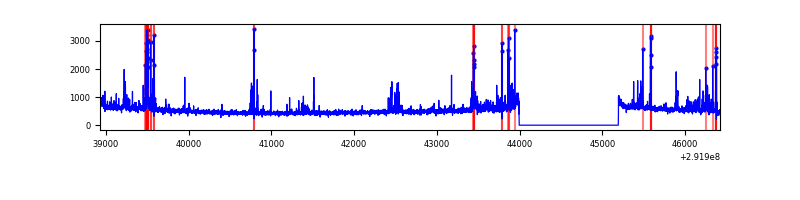 |
| C | 7493 | 6294 | 0 | 0 | 0.00% | 0.00% |  |
| D | 7493 | 6294 | 334 | 334 | 4.46% | 5.31% | 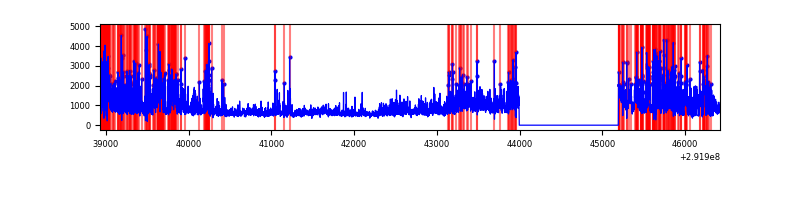 |
Top three noisy pixels from each quadrant. If the there are fewer than three noisy pixels in the level2.evt file, extra rows are filled as -1
| Pixel properties | Quadrant properties | ||||||
|---|---|---|---|---|---|---|---|
| Quadrant | DetID | PixID | Counts | Sigma | Mean | Median | Sigma |
| A | 4 | 2 | 85430 | 524.75 | 796 | 781 | 161.3 |
| A | 0 | 226 | 6790 | 37.25 | 796 | 781 | 161.3 |
| A | 13 | 254 | 6187 | 33.51 | 796 | 781 | 161.3 |
| B | 3 | 112 | 286910 | 1867.69 | 804 | 784 | 153.2 |
| B | 7 | 220 | 71405 | 460.98 | 804 | 784 | 153.2 |
| B | 0 | 183 | 39186 | 250.67 | 804 | 784 | 153.2 |
| C | 14 | 238 | 122174 | 662.1 | 783 | 790 | 183.3 |
| C | 3 | 233 | 66969 | 360.98 | 783 | 790 | 183.3 |
| C | 13 | 61 | 5517 | 25.78 | 783 | 790 | 183.3 |
| D | 7 | 238 | 2279690 | 12350.7 | 762 | 742 | 184.5 |
| D | 1 | 52 | 898710 | 4866.51 | 762 | 742 | 184.5 |
| D | 7 | 38 | 31380 | 166.04 | 762 | 742 | 184.5 |
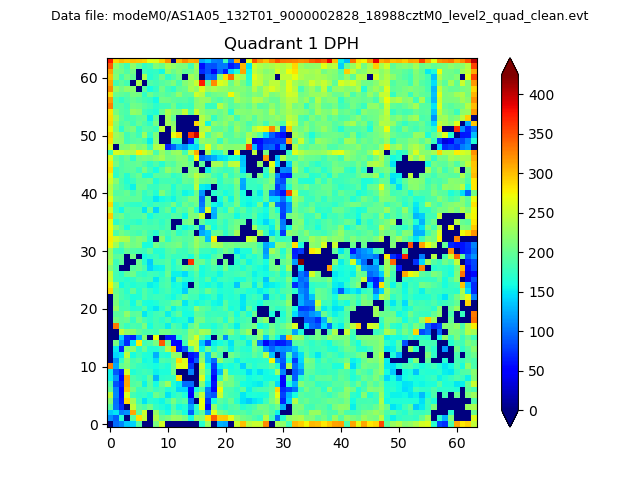
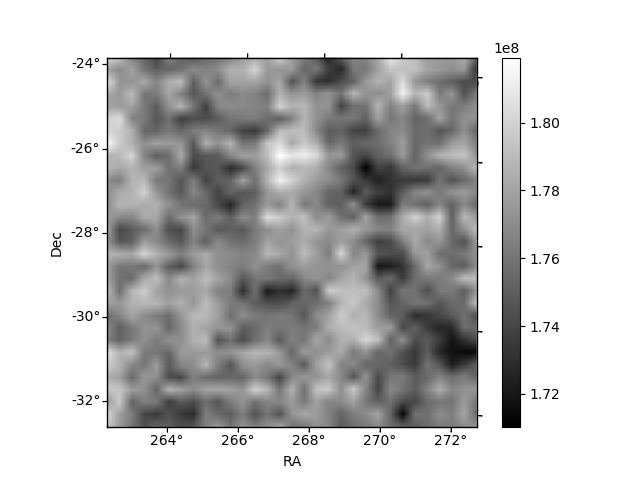
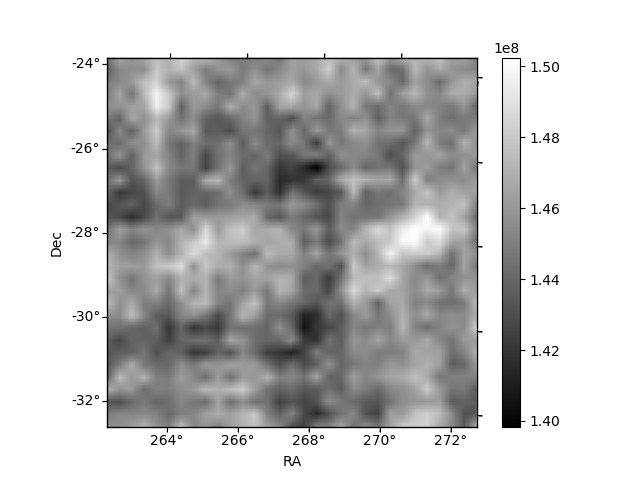
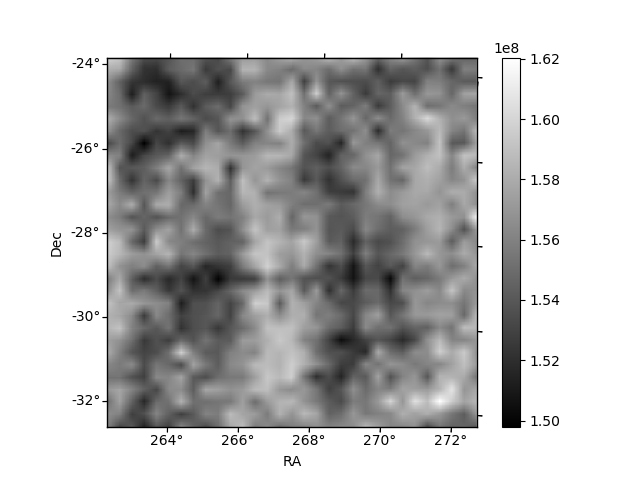
Histogram calculated using DETX and DETY for each event in the final _common_clean file
| Quadrant A | 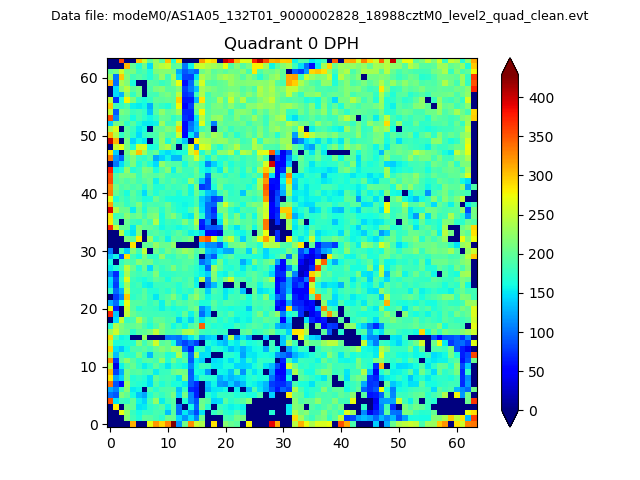 |
 |
Quadrant B |
|---|---|---|---|
| Quadrant D | 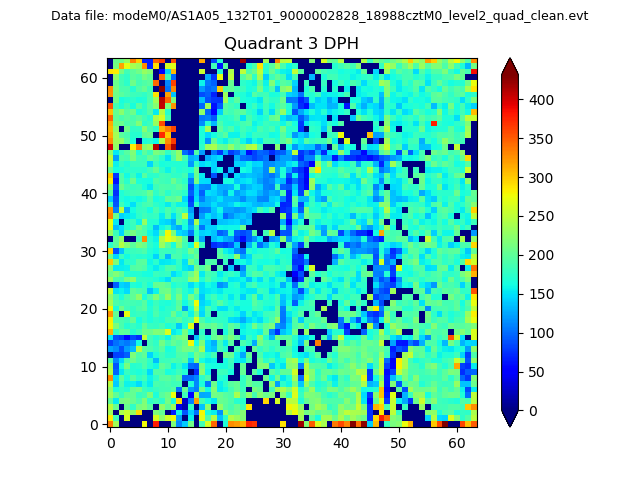 |
 |
Quadrant C |
| Plot type | Count rate plots | Images |
|---|---|---|
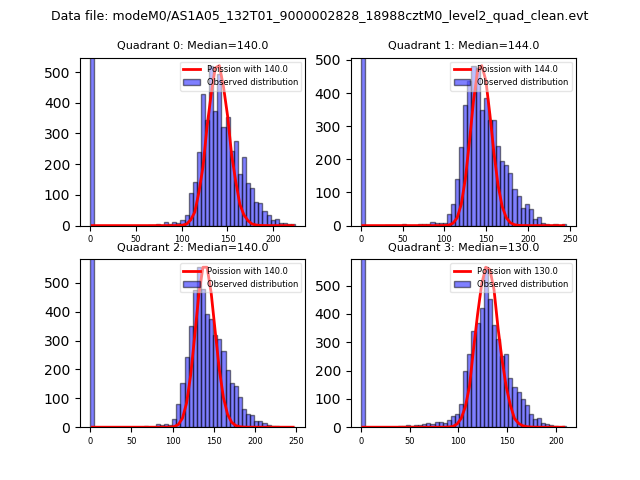
| Comparison with Poisson distribution Blue bars denote a histogram of data divided into 1 sec bins. Red curve is a Poisson curve with rate = median count rate of data. |
 |
 |
| Quadrant-wise count rates Data is divided into 100 sec bins |
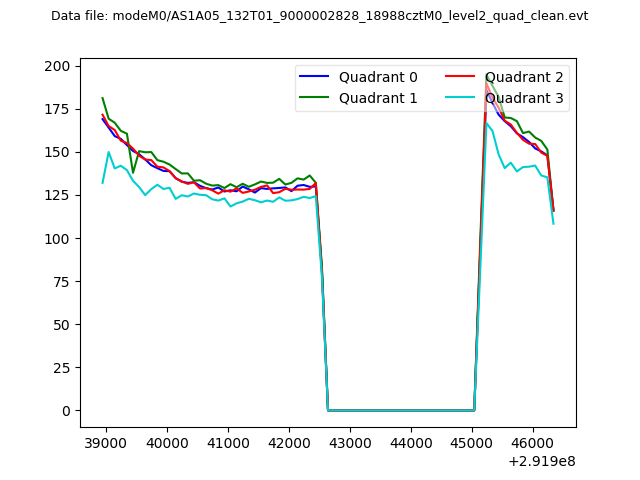 |
|
| Module-wise count rates for Quadrant A Data is divided into 100 sec bins |
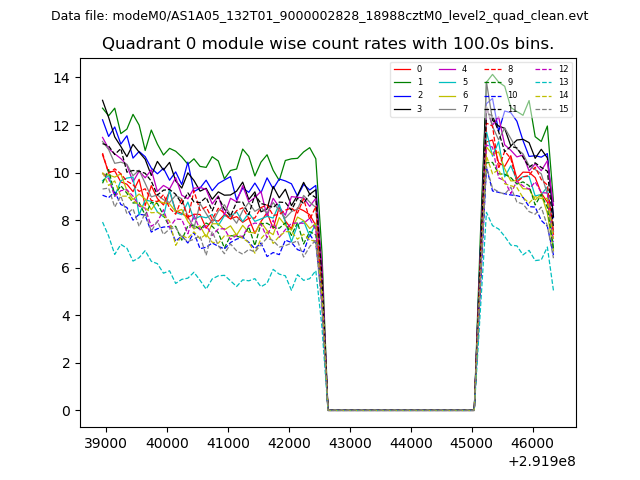 |
 |
| Module-wise count rates for Quadrant B Data is divided into 100 sec bins |
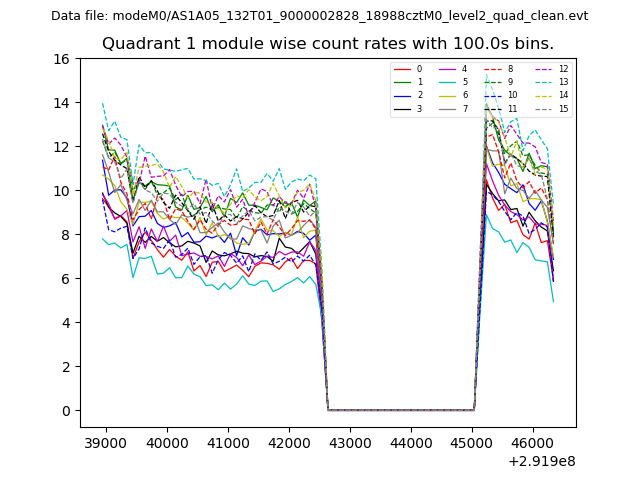 |
 |
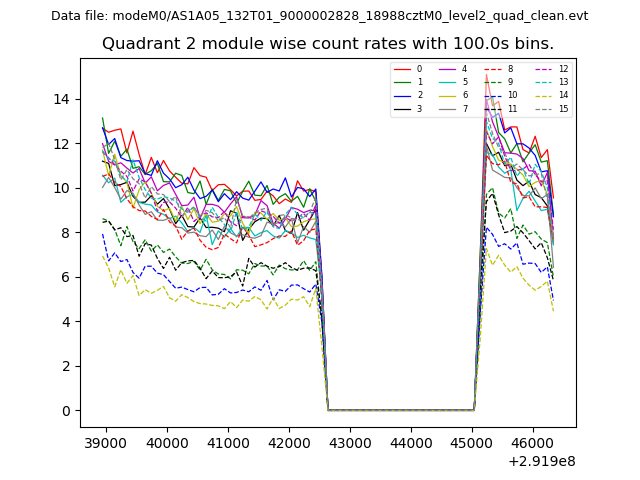
| Module-wise count rates for Quadrant C Data is divided into 100 sec bins |
 |
 |
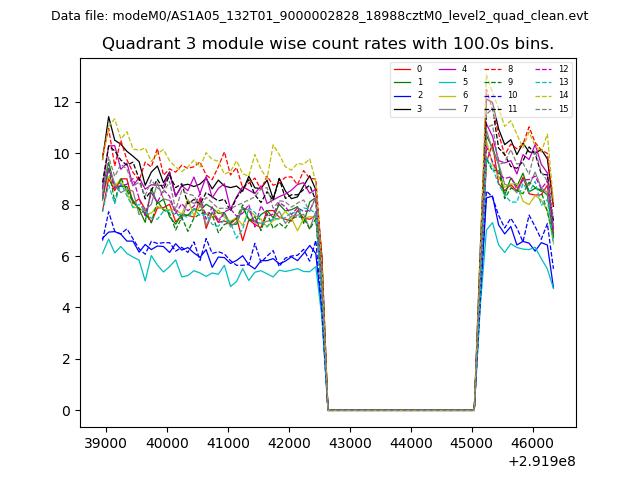
| Module-wise count rates for Quadrant D Data is divided into 100 sec bins |
 |
 |
| Parameter | Plot |
|---|---|
| CZT HV Monitor | 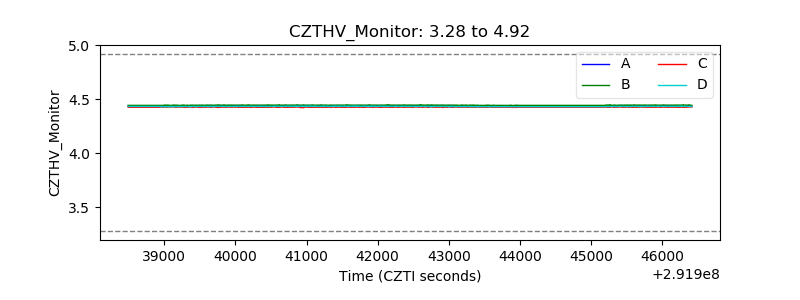 |
| D_VDD | 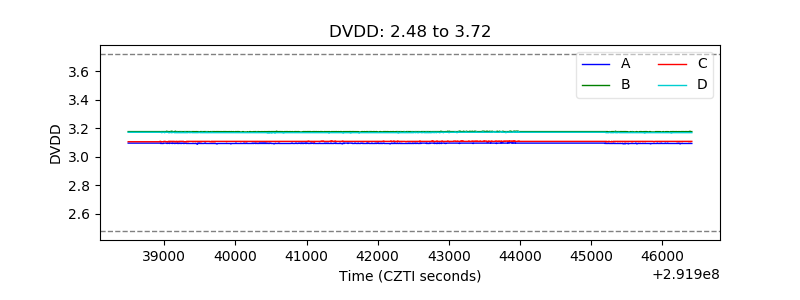 |
| Temperature 1 |  |
| Veto HV Monitor | 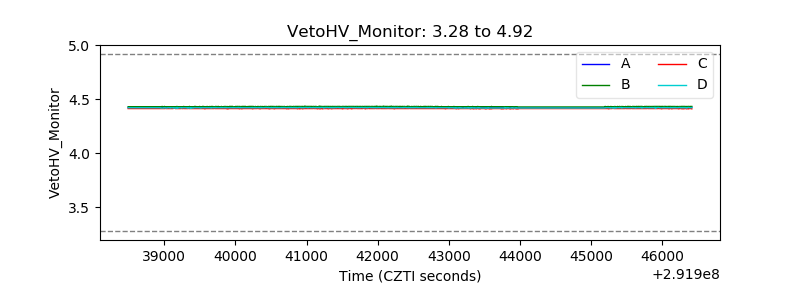 |
| Veto LLD | 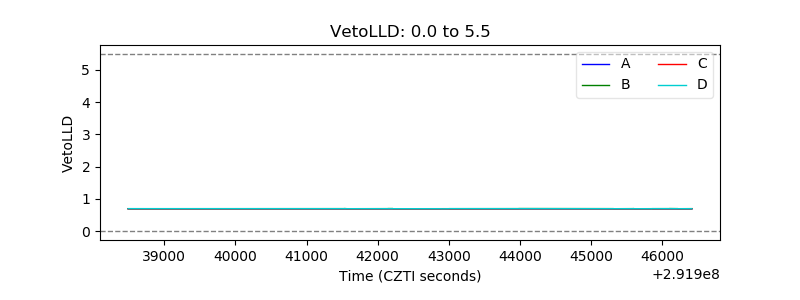 |
| Alpha Counter | 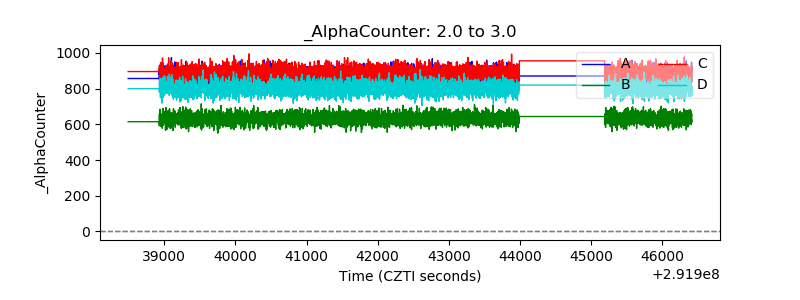 |
| _CPM_Rate | 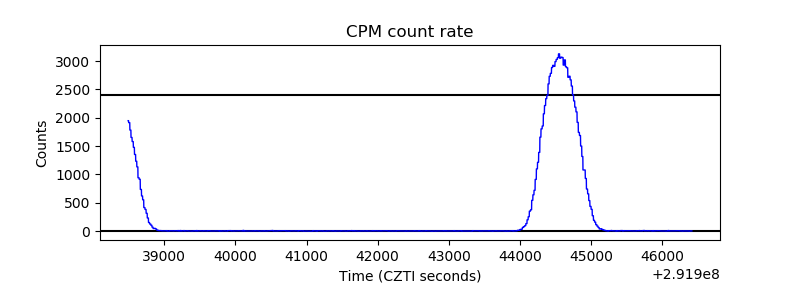 |
| CZT Counter | 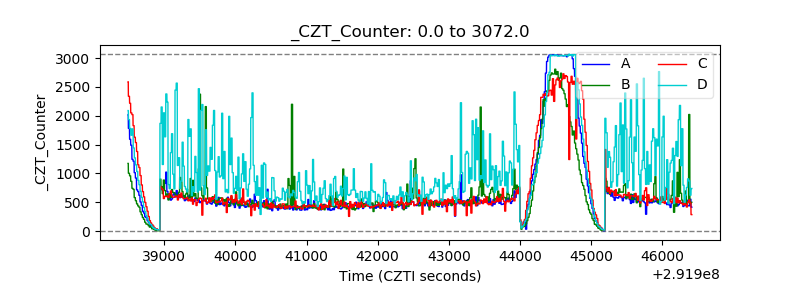 |
| +2.5 Volts monitor | 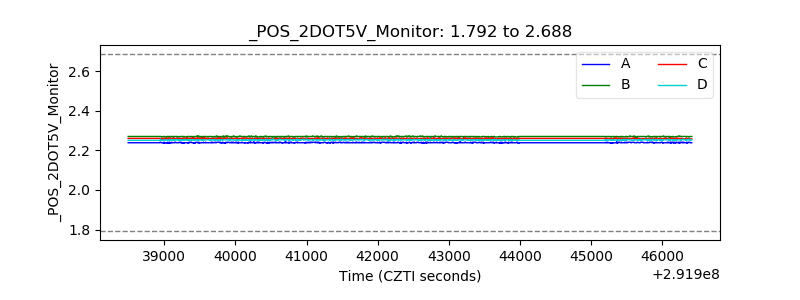 |
| +5 Volts monitor | 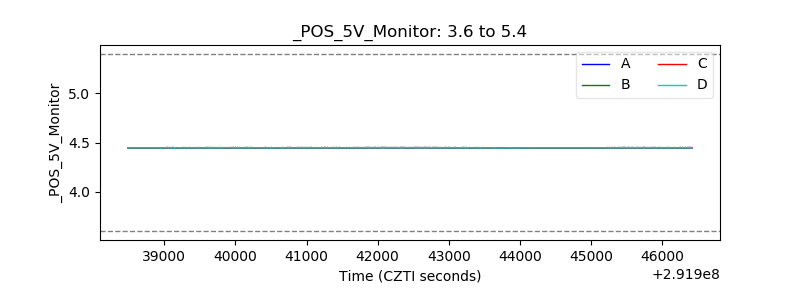 |
| _ROLL_ROT | 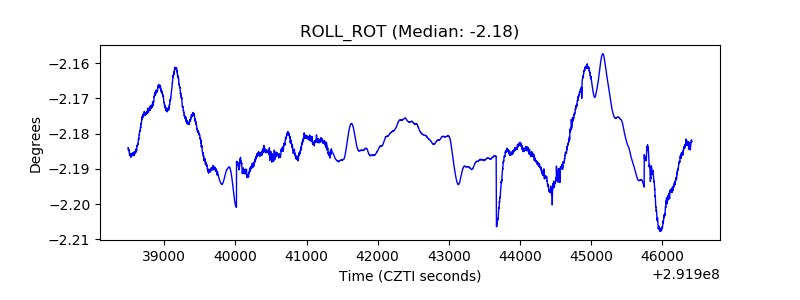 |
| _Roll_DEC | 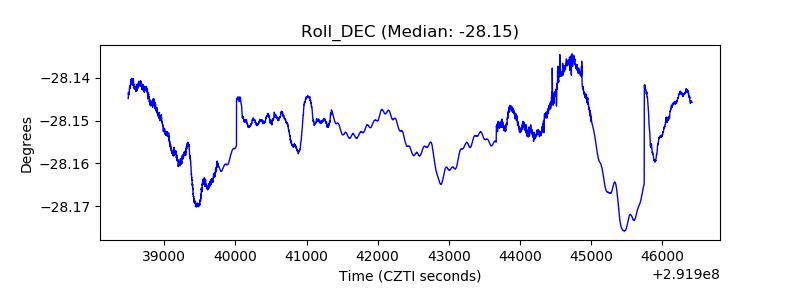 |
| _Roll_RA | 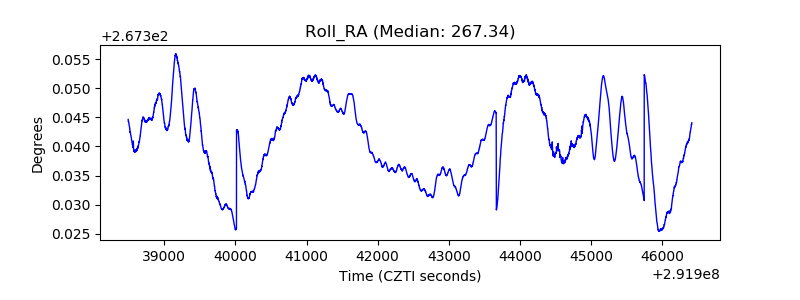 |
| Veto Counter | 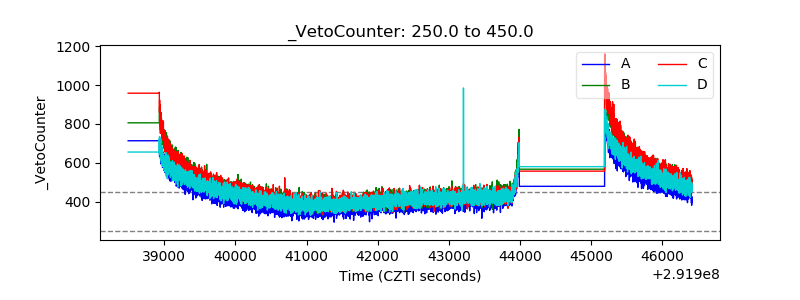 |