| Param | Original file | Final file |
|---|---|---|
| Filename | modeM0/AS1A05_132T01_9000002828_18989cztM0_level2.evt | modeM0/AS1A05_132T01_9000002828_18989cztM0_level2_quad_clean.evt |
| Size (bytes) | 625,345,920 | 112,587,840 |
| Size | 596.4 MB | 107.4 MB |
| Events in quadrant A | 3,409,885 | 743,927 |
| Events in quadrant B | 3,766,846 | 772,600 |
| Events in quadrant C | 3,531,424 | 746,844 |
| Events in quadrant D | 7,786,136 | 687,920 |
| Mode M0 | |||
|---|---|---|---|
| Quadrant | BADHDUFLAG | Total packets | Discarded packets |
| A | 0 | 14178 | 2 |
| B | 0 | 15433 | 2 |
| C | 0 | 14453 | 2 |
| D | 0 | 27801 | 3 |
| Mode SS | |||
|---|---|---|---|
| Quadrant | BADHDUFLAG | Total packets | Discarded packets |
| A | 0 | 132 | 0 |
| B | 0 | 132 | 0 |
| C | 0 | 132 | 0 |
| D | 0 | 132 | 0 |
| Mode M9 | |||
|---|---|---|---|
| Quadrant | BADHDUFLAG | Total packets | Discarded packets |
| A | 0 | 22 | 0 |
| B | 0 | 23 | 0 |
| C | 0 | 23 | 0 |
| D | 0 | 23 | 0 |
| Quadrant | Total seconds | Saturated seconds | Saturation percentage |
|---|---|---|---|
| A | 6581 | 62 | 0.942106% |
| B | 6581 | 101 | 1.534721% |
| C | 6581 | 70 | 1.063668% |
| D | 6580 | 649 | 9.863222% |
Noise dominated data is calculated using 1-second bins in cleaned event files. If a bin has >2000 counts, and if more than 50% of those come from <1% of pixels, then it is considered to be noise-dominated and hence unusable.
| Quadrant | # 1 sec bins | Bins with >0 counts | Bins with >2000 counts | High rate bins dominated by noise | Noise dominated (total time) | Noise dominated (detector-on time) | Marked lightcurve |
|---|---|---|---|---|---|---|---|
| A | 7861 | 6582 | 22 | 22 | 0.28% | 0.33% | 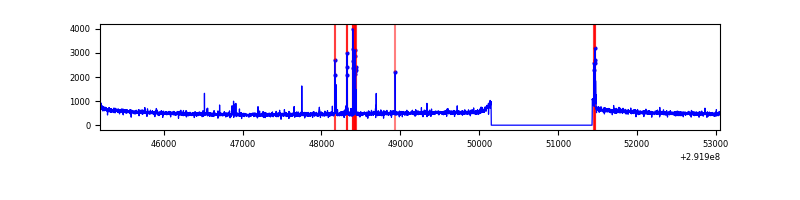 |
| B | 7861 | 6582 | 32 | 32 | 0.41% | 0.49% | 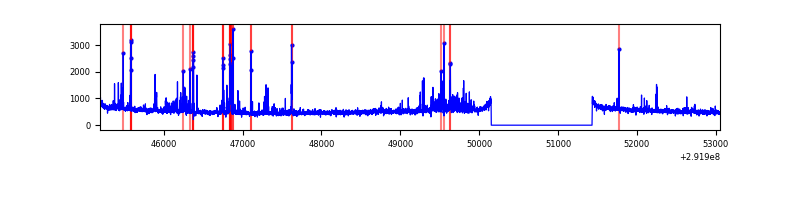 |
| C | 7861 | 6582 | 0 | 0 | 0.00% | 0.00% | 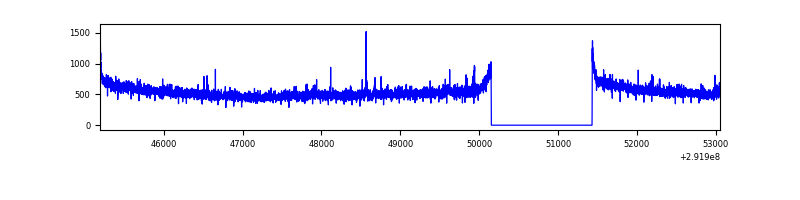 |
| D | 7860 | 6581 | 426 | 426 | 5.42% | 6.47% | 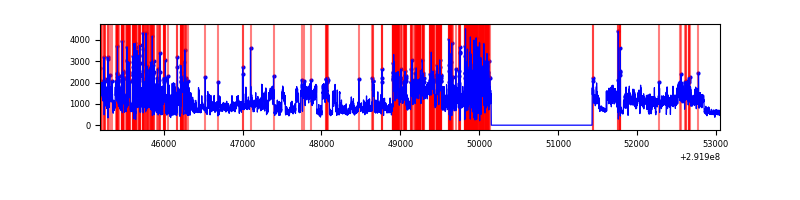 |
Top three noisy pixels from each quadrant. If the there are fewer than three noisy pixels in the level2.evt file, extra rows are filled as -1
| Pixel properties | Quadrant properties | ||||||
|---|---|---|---|---|---|---|---|
| Quadrant | DetID | PixID | Counts | Sigma | Mean | Median | Sigma |
| A | 9 | 143 | 108444 | 626.71 | 857 | 842 | 171.7 |
| A | 0 | 226 | 7389 | 38.13 | 857 | 842 | 171.7 |
| A | 13 | 254 | 6559 | 33.3 | 857 | 842 | 171.7 |
| B | 3 | 112 | 239282 | 1486.91 | 866 | 845 | 160.4 |
| B | 7 | 220 | 104305 | 645.19 | 866 | 845 | 160.4 |
| B | 4 | 80 | 18820 | 112.09 | 866 | 845 | 160.4 |
| C | 14 | 238 | 132397 | 666.83 | 848 | 859 | 197.3 |
| C | 3 | 233 | 88356 | 443.56 | 848 | 859 | 197.3 |
| C | 13 | 61 | 5922 | 25.67 | 848 | 859 | 197.3 |
| D | 1 | 52 | 2499439 | 12687.94 | 817 | 796 | 196.9 |
| D | 7 | 238 | 2161417 | 10971.49 | 817 | 796 | 196.9 |
| D | 2 | 234 | 25478 | 125.33 | 817 | 796 | 196.9 |
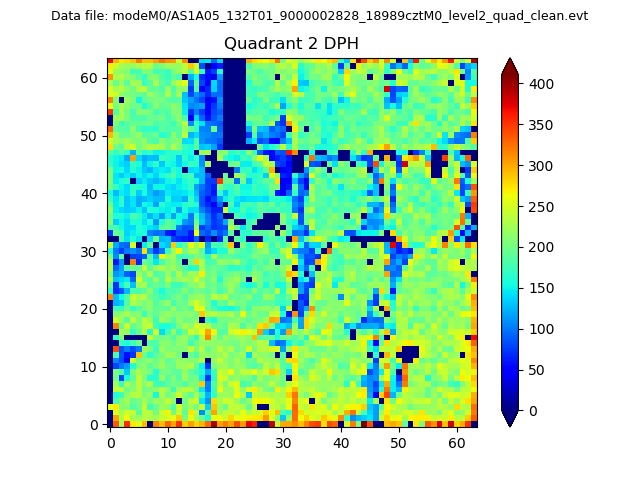
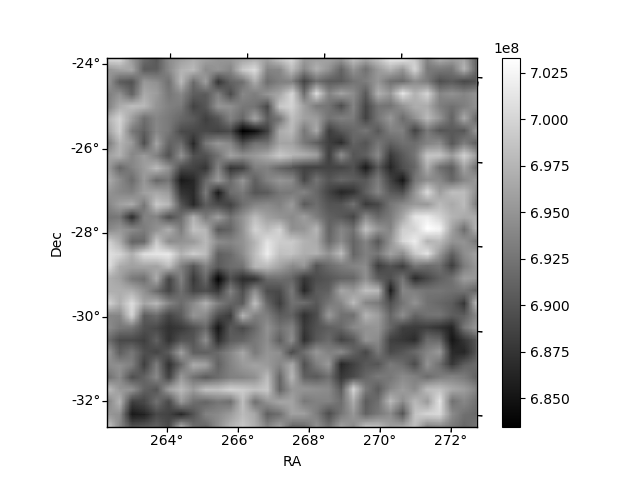
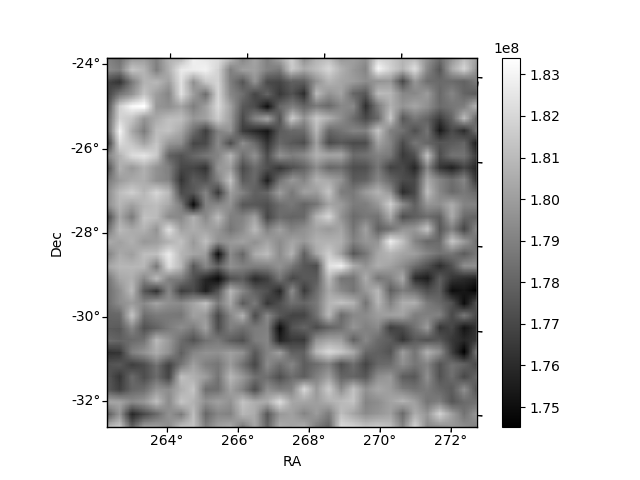
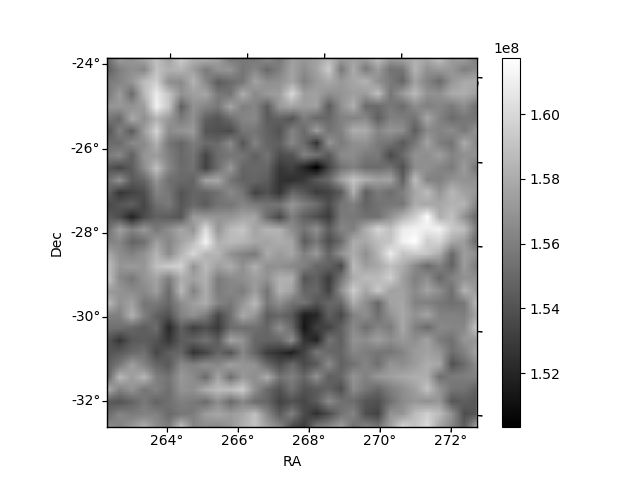
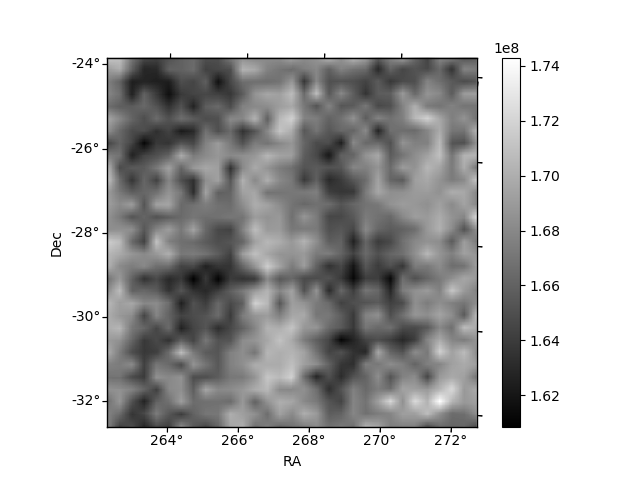
Histogram calculated using DETX and DETY for each event in the final _common_clean file
| Quadrant A | 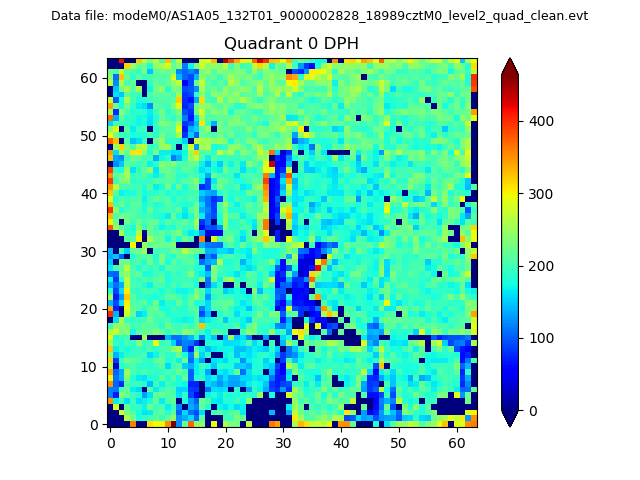 |
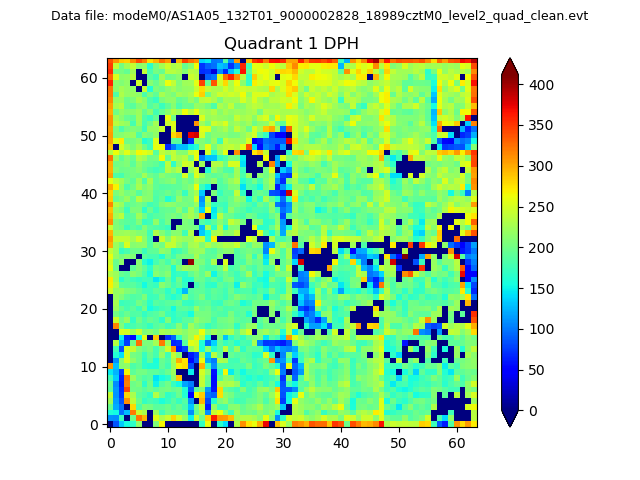 |
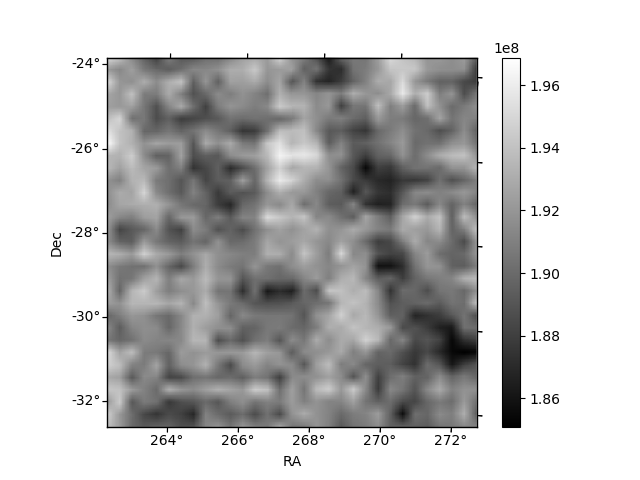
Quadrant B |
|---|---|---|---|
| Quadrant D | 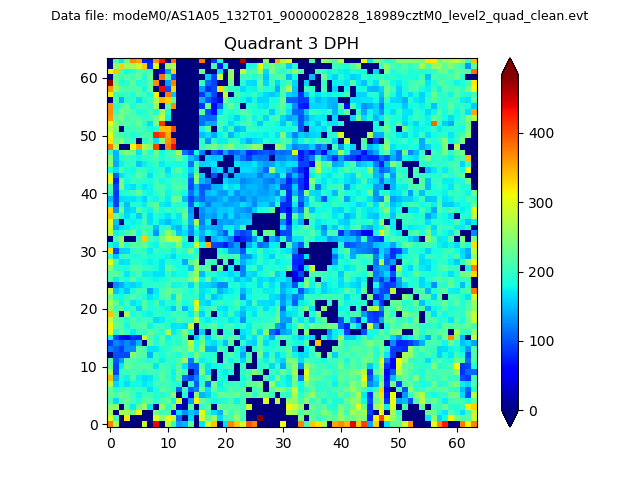 |
 |
Quadrant C |
| Plot type | Count rate plots | Images |
|---|---|---|
| Comparison with Poisson distribution Blue bars denote a histogram of data divided into 1 sec bins. Red curve is a Poisson curve with rate = median count rate of data. |
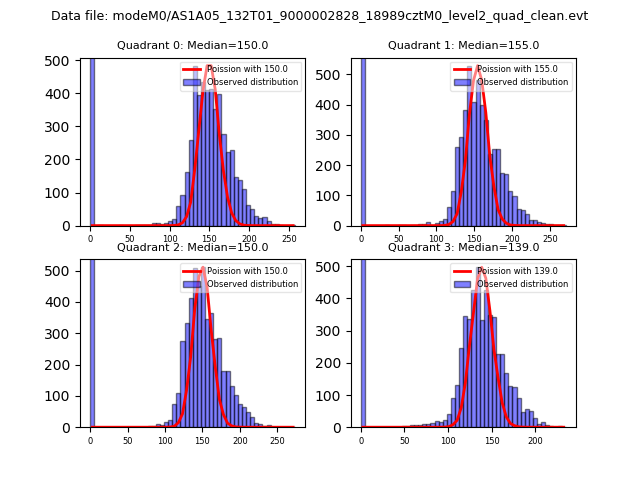 |
 |
| Quadrant-wise count rates Data is divided into 100 sec bins |
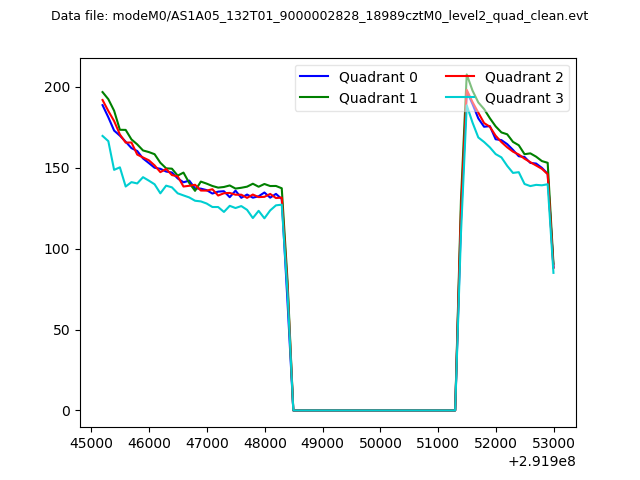 |
|
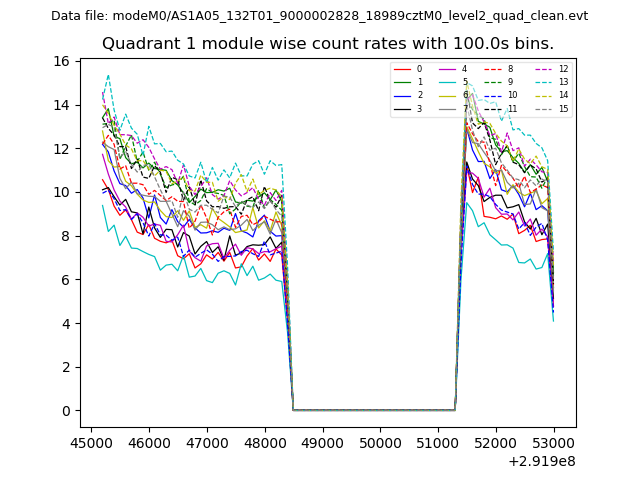
| Module-wise count rates for Quadrant A Data is divided into 100 sec bins |
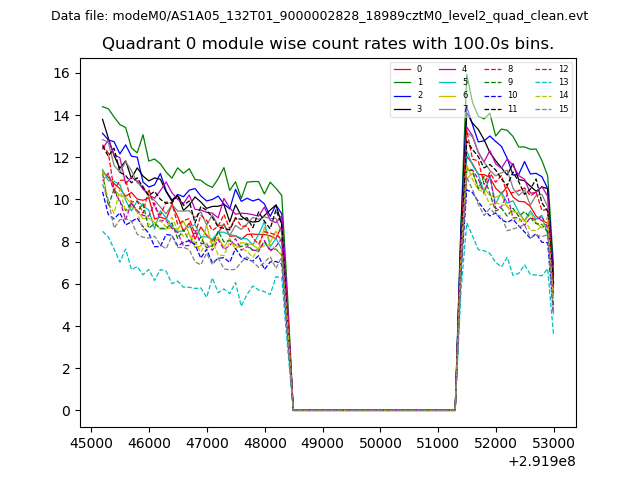 |
 |
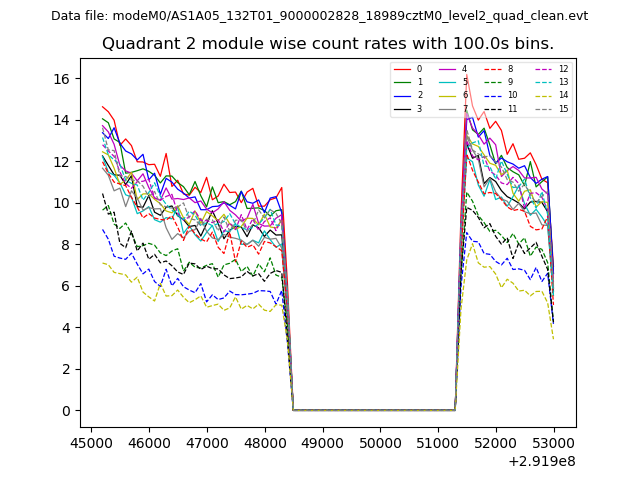
| Module-wise count rates for Quadrant B Data is divided into 100 sec bins |
 |
 |
| Module-wise count rates for Quadrant C Data is divided into 100 sec bins |
 |
 |
| Module-wise count rates for Quadrant D Data is divided into 100 sec bins |
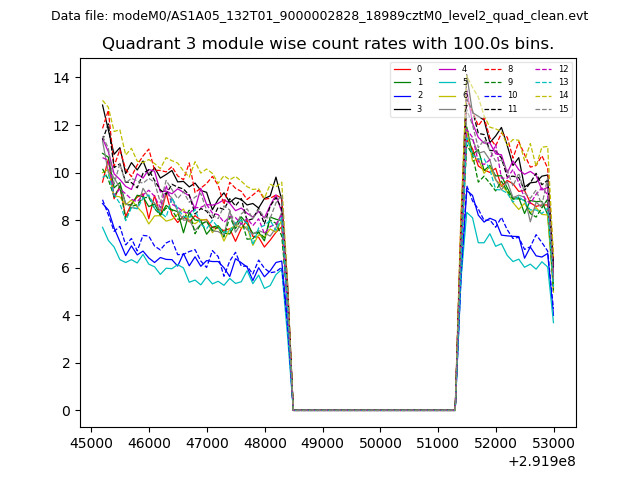 |
 |
| Parameter | Plot |
|---|---|
| CZT HV Monitor | 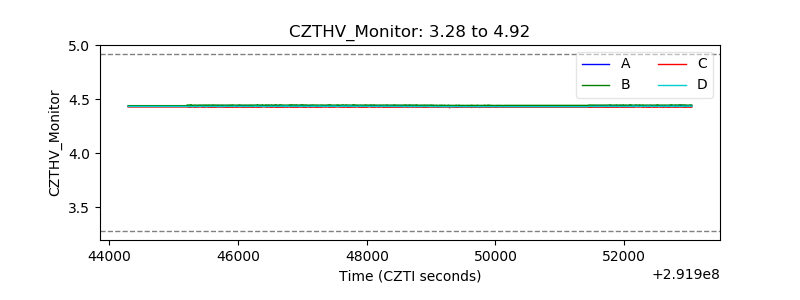 |
| D_VDD | 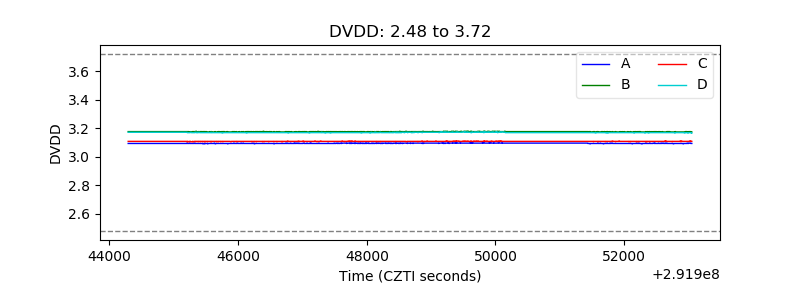 |
| Temperature 1 | 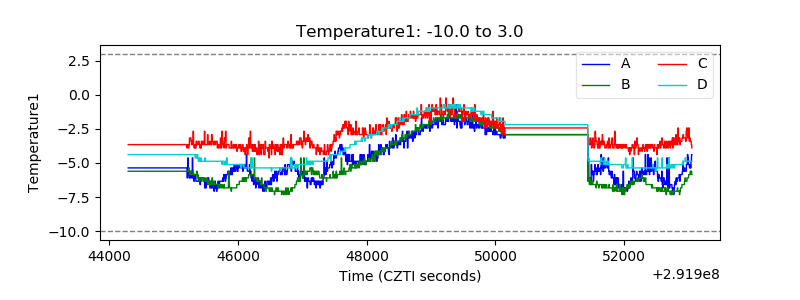 |
| Veto HV Monitor | 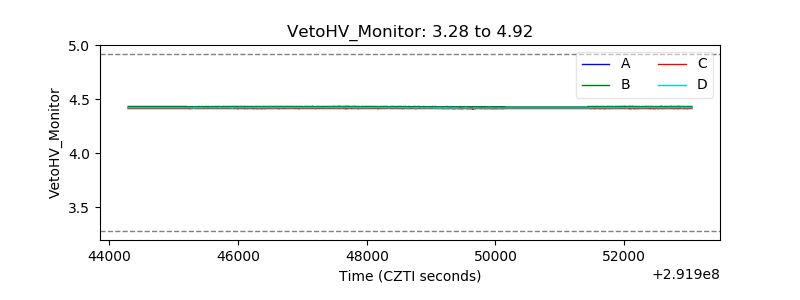 |
| Veto LLD | 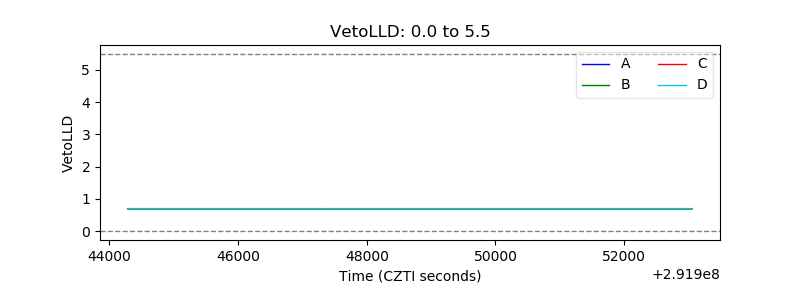 |
| Alpha Counter | 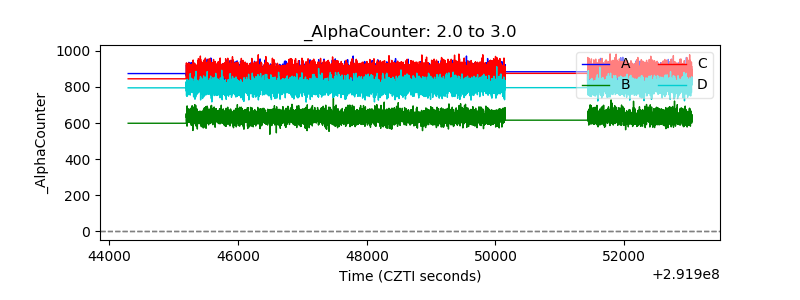 |
| _CPM_Rate | 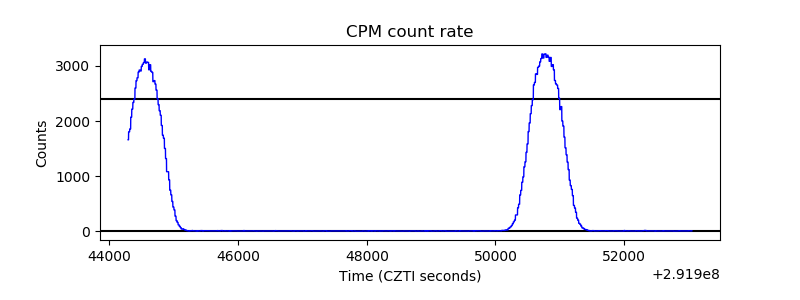 |
| CZT Counter | 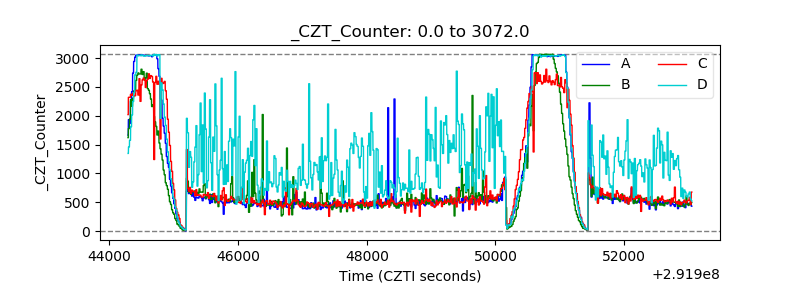 |
| +2.5 Volts monitor |  |
| +5 Volts monitor |  |
| _ROLL_ROT | 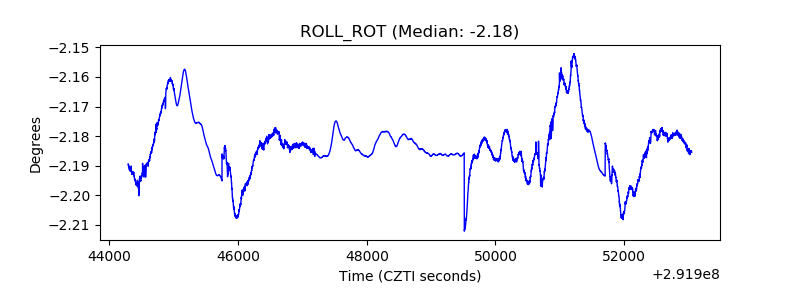 |
| _Roll_DEC | 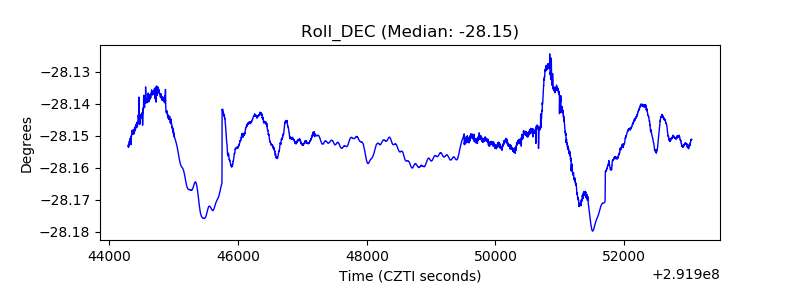 |
| _Roll_RA | 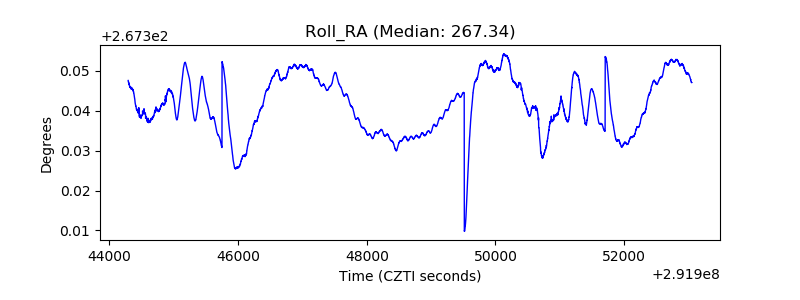 |
| Veto Counter | 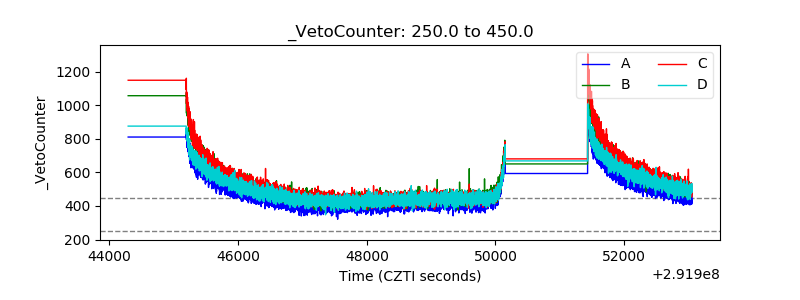 |