| Param | Original file | Final file |
|---|---|---|
| Filename | modeM0/AS1A05_132T01_9000002828_18991cztM0_level2.evt | modeM0/AS1A05_132T01_9000002828_18991cztM0_level2_quad_clean.evt |
| Size (bytes) | 558,198,720 | 94,728,960 |
| Size | 532.3 MB | 90.3 MB |
| Events in quadrant A | 3,136,809 | 618,588 |
| Events in quadrant B | 3,406,556 | 632,828 |
| Events in quadrant C | 3,284,947 | 614,781 |
| Events in quadrant D | 6,662,184 | 574,897 |
| Mode M0 | |||
|---|---|---|---|
| Quadrant | BADHDUFLAG | Total packets | Discarded packets |
| A | 0 | 12872 | 1 |
| B | 0 | 13758 | 1 |
| C | 0 | 13225 | 1 |
| D | 0 | 24078 | 1 |
| Mode SS | |||
|---|---|---|---|
| Quadrant | BADHDUFLAG | Total packets | Discarded packets |
| A | 0 | 124 | 0 |
| B | 0 | 124 | 0 |
| C | 0 | 124 | 0 |
| D | 0 | 124 | 0 |
| Mode M9 | |||
|---|---|---|---|
| Quadrant | BADHDUFLAG | Total packets | Discarded packets |
| A | 0 | 13 | 0 |
| B | 0 | 13 | 0 |
| C | 0 | 13 | 0 |
| D | 0 | 13 | 0 |
| Quadrant | Total seconds | Saturated seconds | Saturation percentage |
|---|---|---|---|
| A | 6126 | 48 | 0.783546% |
| B | 6127 | 96 | 1.566835% |
| C | 6127 | 80 | 1.305696% |
| D | 6127 | 652 | 10.641423% |
Noise dominated data is calculated using 1-second bins in cleaned event files. If a bin has >2000 counts, and if more than 50% of those come from <1% of pixels, then it is considered to be noise-dominated and hence unusable.
| Quadrant | # 1 sec bins | Bins with >0 counts | Bins with >2000 counts | High rate bins dominated by noise | Noise dominated (total time) | Noise dominated (detector-on time) | Marked lightcurve |
|---|---|---|---|---|---|---|---|
| A | 7461 | 6127 | 1 | 1 | 0.01% | 0.02% | 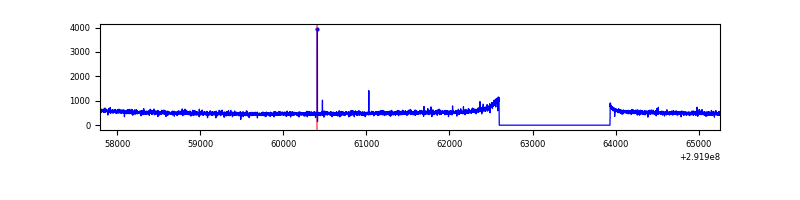 |
| B | 7462 | 6128 | 25 | 25 | 0.34% | 0.41% | 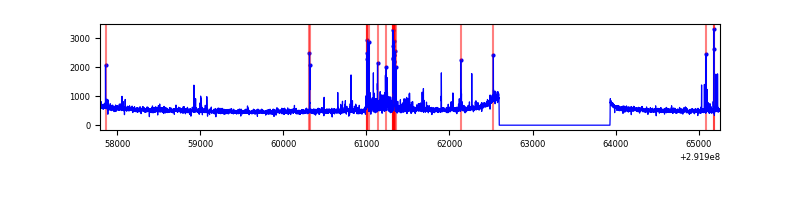 |
| C | 7462 | 6128 | 0 | 0 | 0.00% | 0.00% | 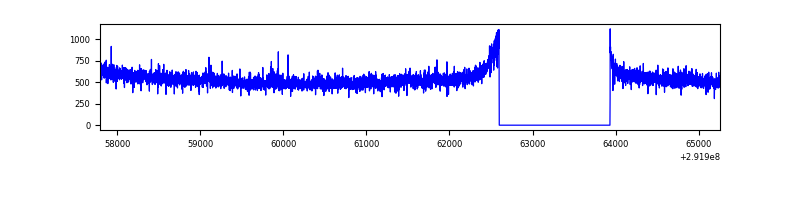 |
| D | 7462 | 6128 | 563 | 563 | 7.54% | 9.19% | 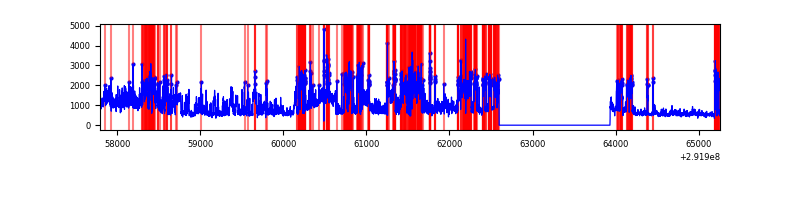 |
Top three noisy pixels from each quadrant. If the there are fewer than three noisy pixels in the level2.evt file, extra rows are filled as -1
| Pixel properties | Quadrant properties | ||||||
|---|---|---|---|---|---|---|---|
| Quadrant | DetID | PixID | Counts | Sigma | Mean | Median | Sigma |
| A | 13 | 254 | 7453 | 40.88 | 811 | 797 | 162.8 |
| A | 0 | 226 | 7050 | 38.4 | 811 | 797 | 162.8 |
| A | 4 | 2 | 7028 | 38.27 | 811 | 797 | 162.8 |
| B | 7 | 220 | 122519 | 806.33 | 807 | 786 | 151.0 |
| B | 3 | 112 | 81715 | 536.05 | 807 | 786 | 151.0 |
| B | 12 | 111 | 17208 | 108.77 | 807 | 786 | 151.0 |
| C | 14 | 238 | 123696 | 661.62 | 794 | 803 | 185.7 |
| C | 3 | 233 | 64228 | 341.46 | 794 | 803 | 185.7 |
| C | 13 | 61 | 5526 | 25.43 | 794 | 803 | 185.7 |
| D | 1 | 52 | 2304958 | 12241.75 | 775 | 753 | 188.2 |
| D | 7 | 238 | 1407285 | 7472.6 | 775 | 753 | 188.2 |
| D | 2 | 234 | 23187 | 119.19 | 775 | 753 | 188.2 |
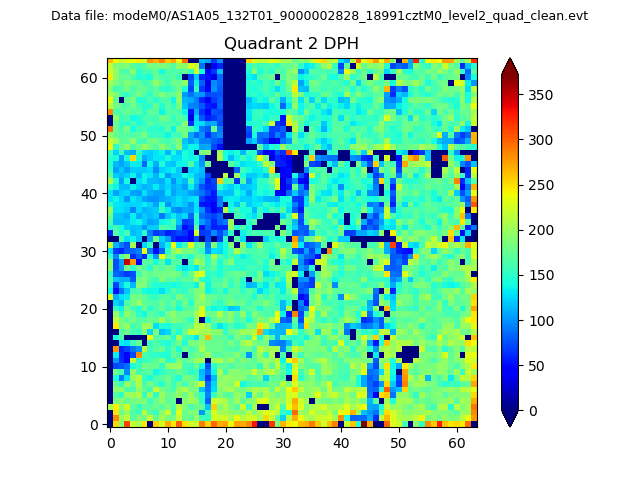
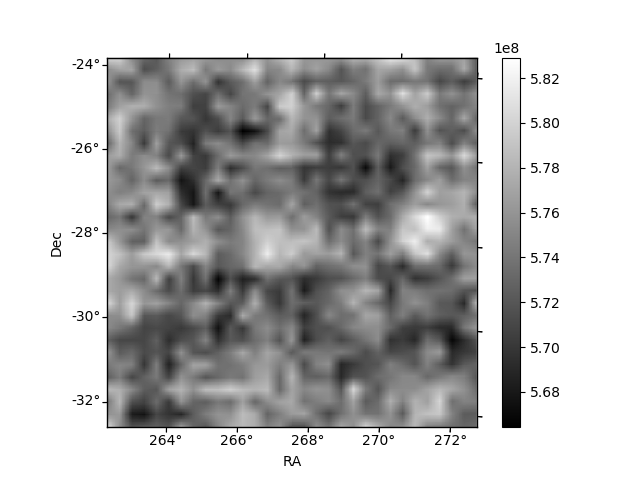
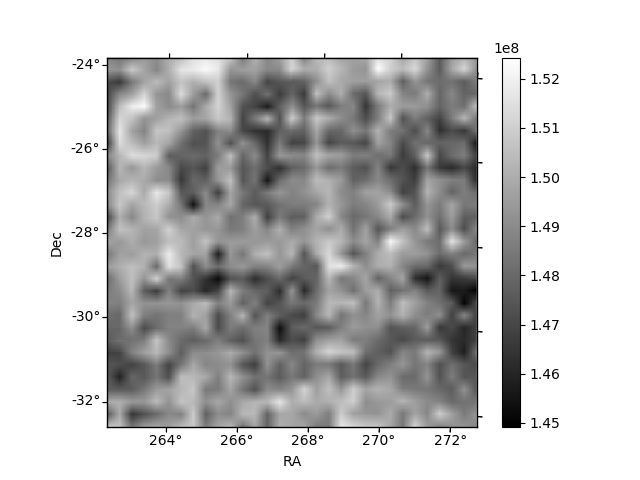
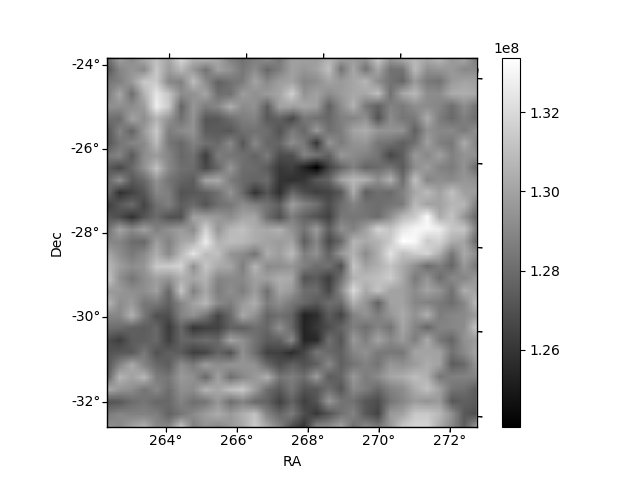
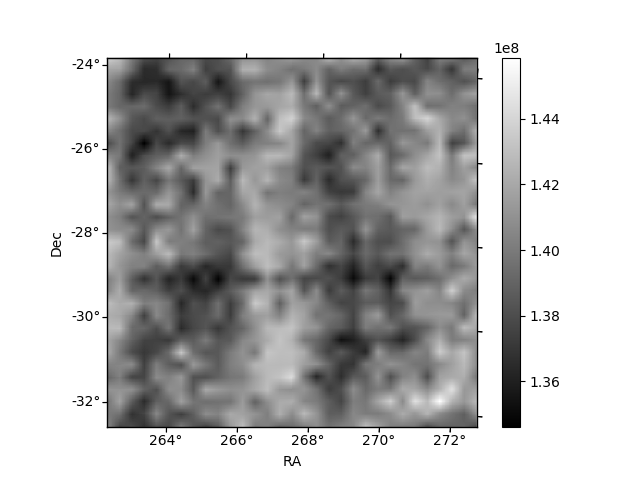
Histogram calculated using DETX and DETY for each event in the final _common_clean file
| Quadrant A | 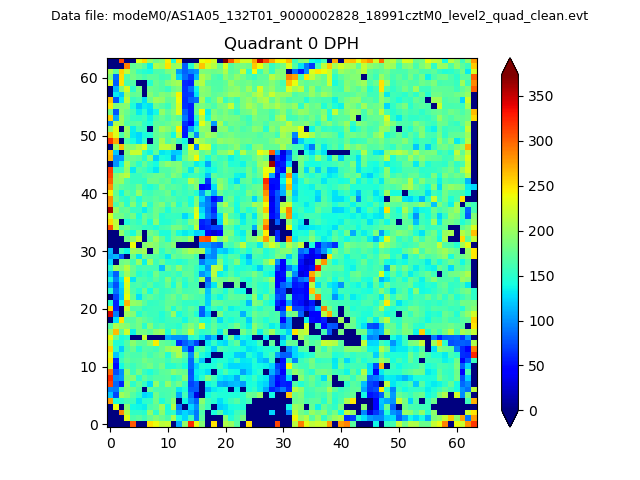 |
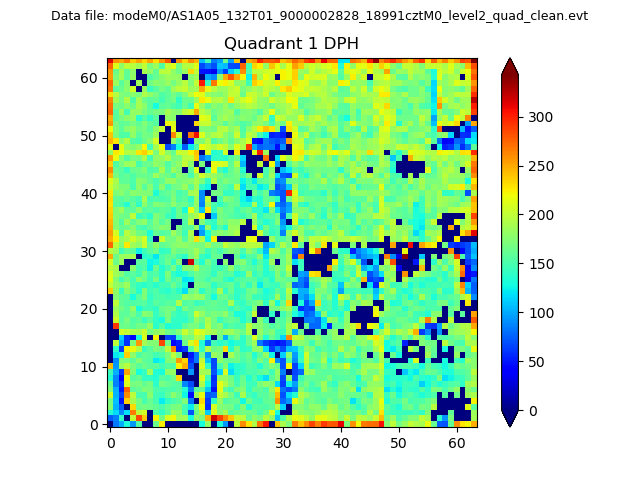 |
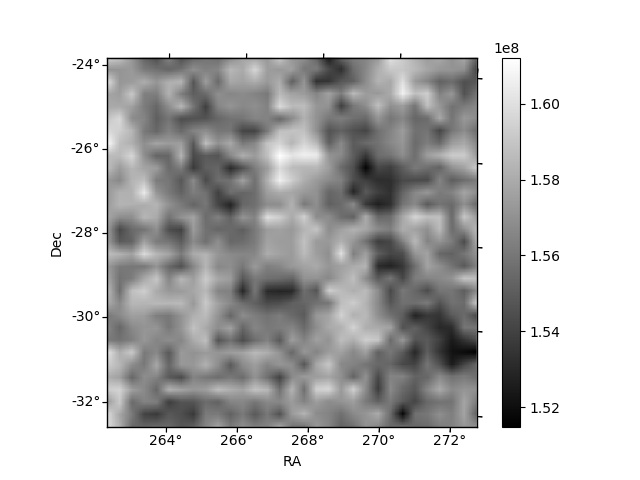
Quadrant B |
|---|---|---|---|
| Quadrant D | 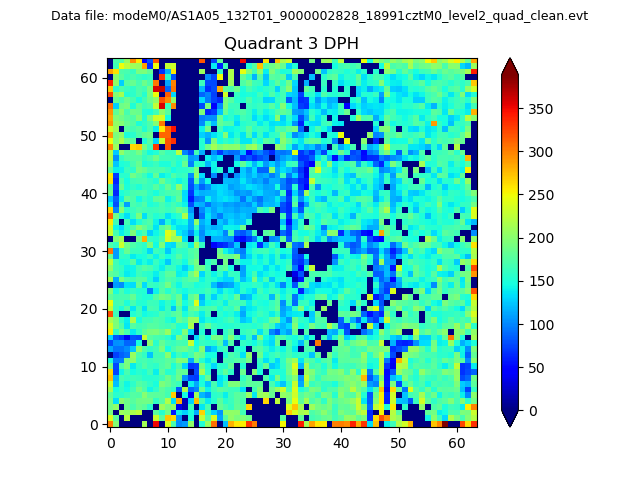 |
 |
Quadrant C |
| Plot type | Count rate plots | Images |
|---|---|---|
| Comparison with Poisson distribution Blue bars denote a histogram of data divided into 1 sec bins. Red curve is a Poisson curve with rate = median count rate of data. |
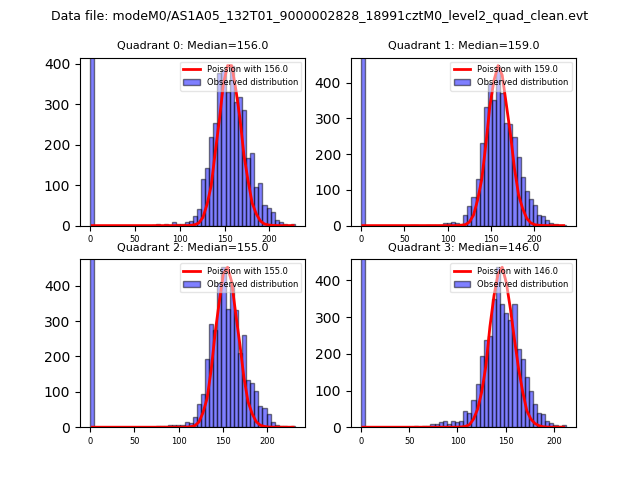 |
 |
| Quadrant-wise count rates Data is divided into 100 sec bins |
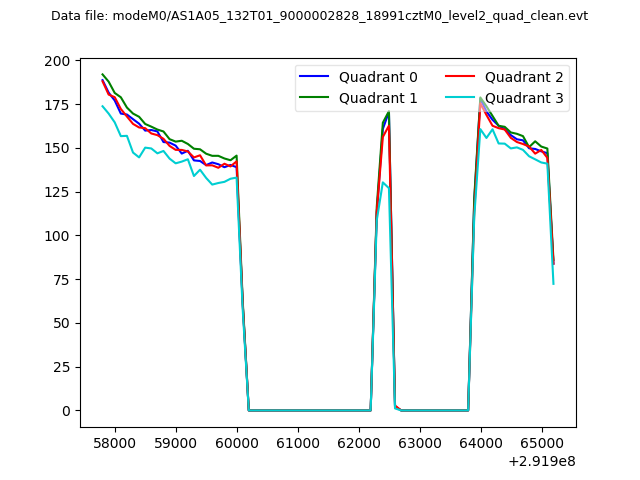 |
|
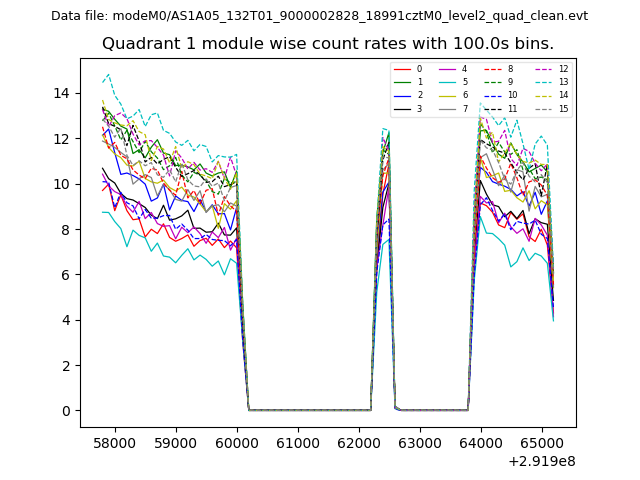
| Module-wise count rates for Quadrant A Data is divided into 100 sec bins |
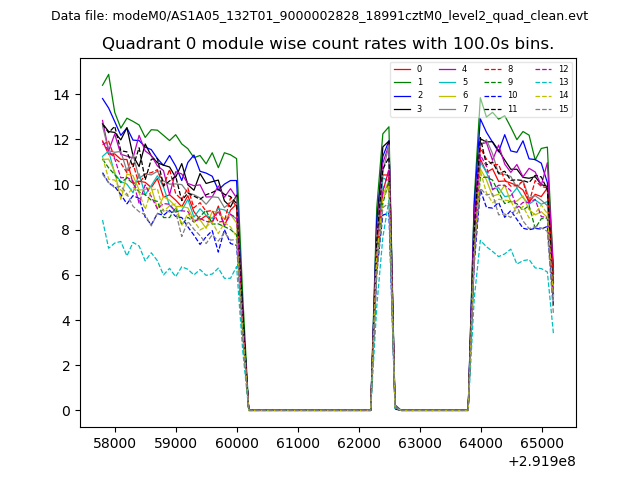 |
 |
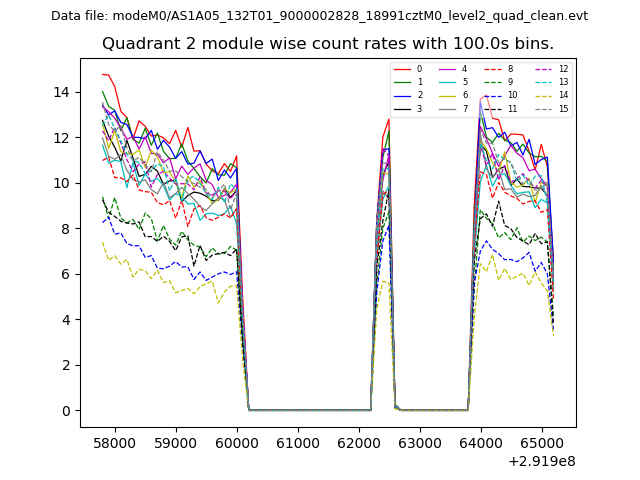
| Module-wise count rates for Quadrant B Data is divided into 100 sec bins |
 |
 |
| Module-wise count rates for Quadrant C Data is divided into 100 sec bins |
 |
 |
| Module-wise count rates for Quadrant D Data is divided into 100 sec bins |
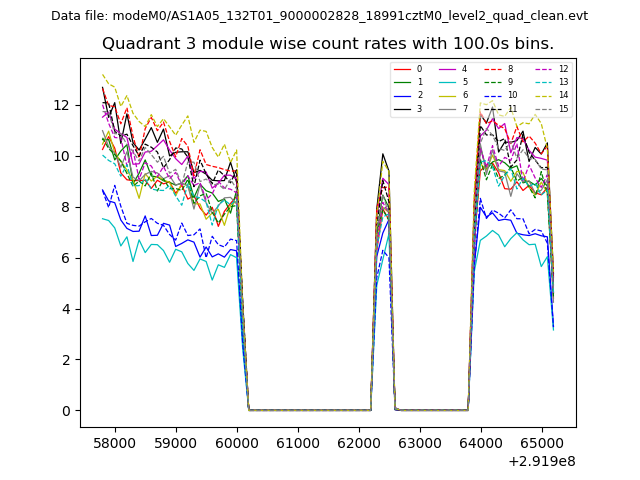 |
 |
| Parameter | Plot |
|---|---|
| CZT HV Monitor | 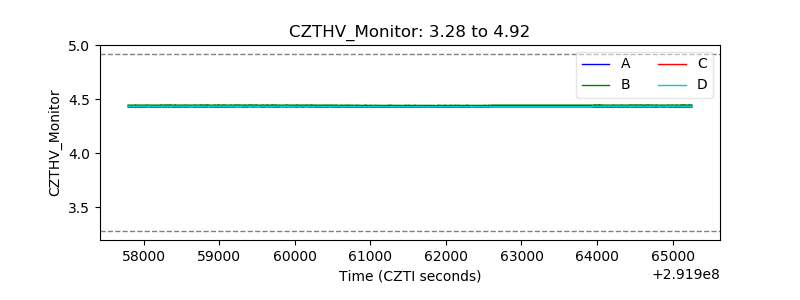 |
| D_VDD | 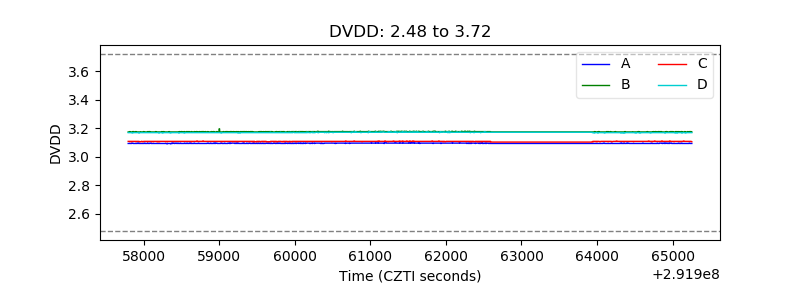 |
| Temperature 1 | 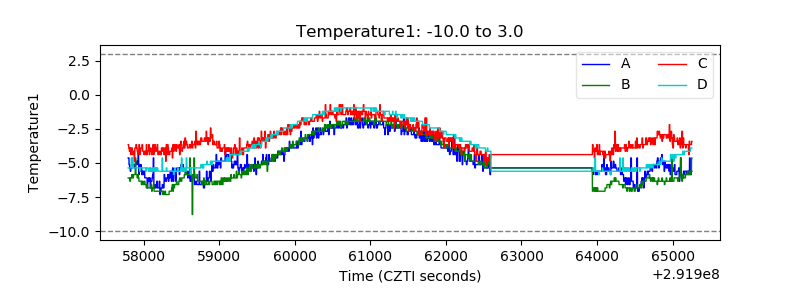 |
| Veto HV Monitor | 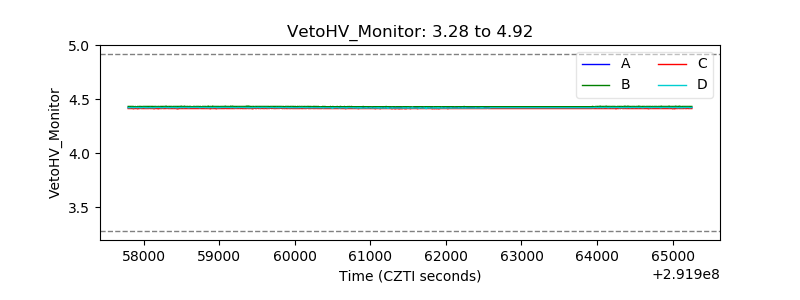 |
| Veto LLD | 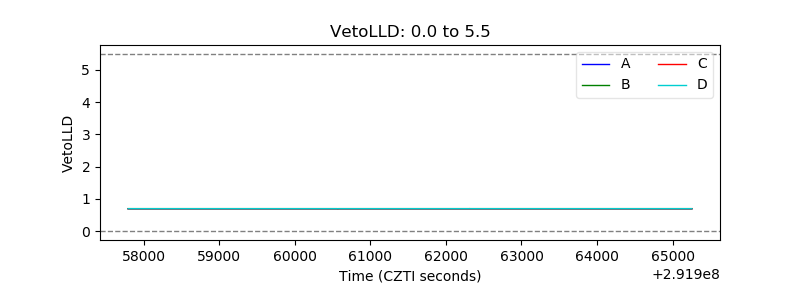 |
| Alpha Counter | 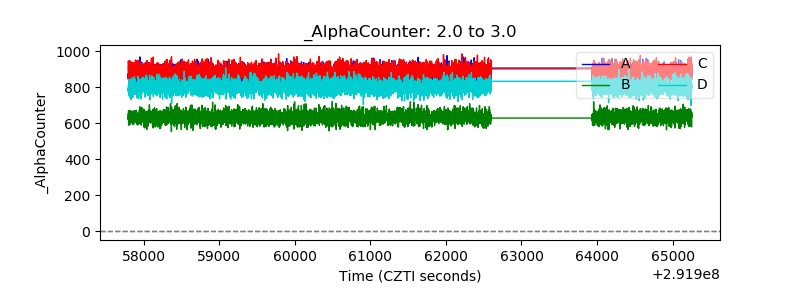 |
| _CPM_Rate | 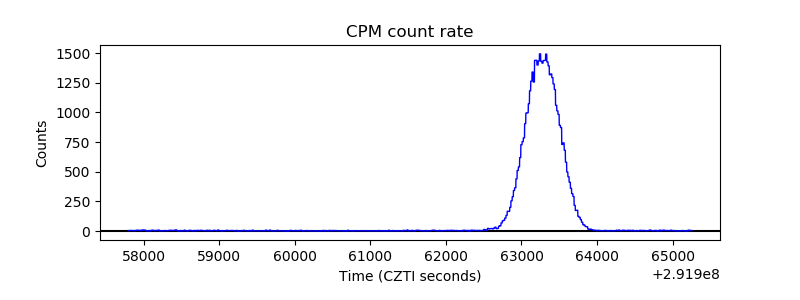 |
| CZT Counter | 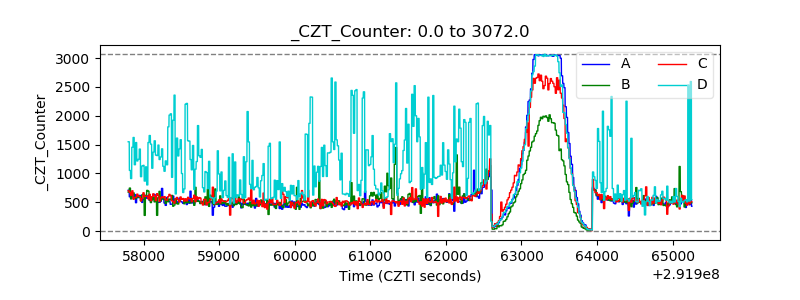 |
| +2.5 Volts monitor | 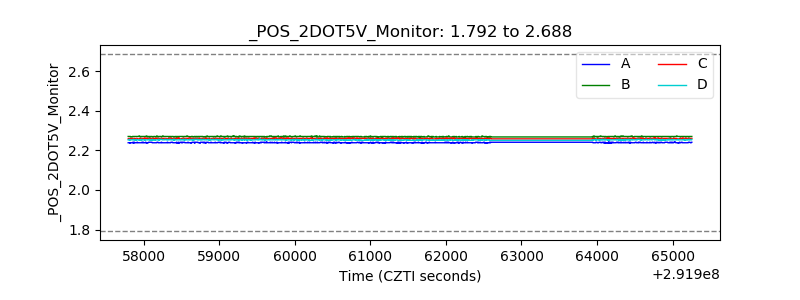 |
| +5 Volts monitor |  |
| _ROLL_ROT | 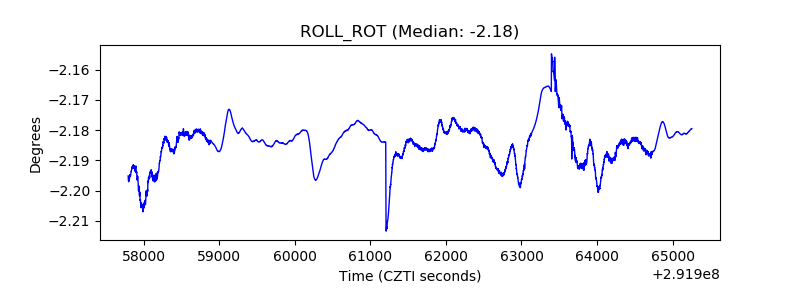 |
| _Roll_DEC | 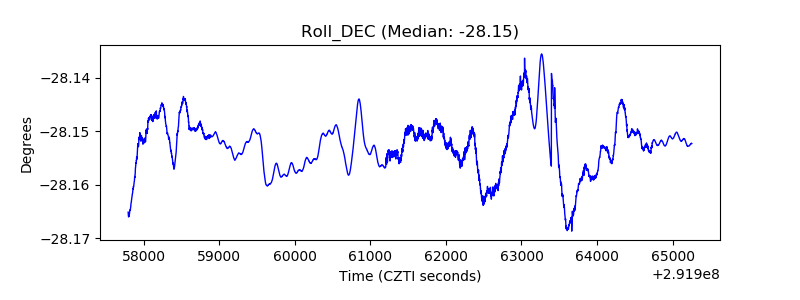 |
| _Roll_RA | 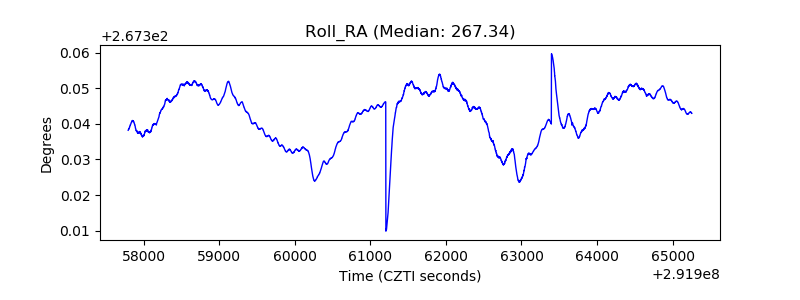 |
| Veto Counter | 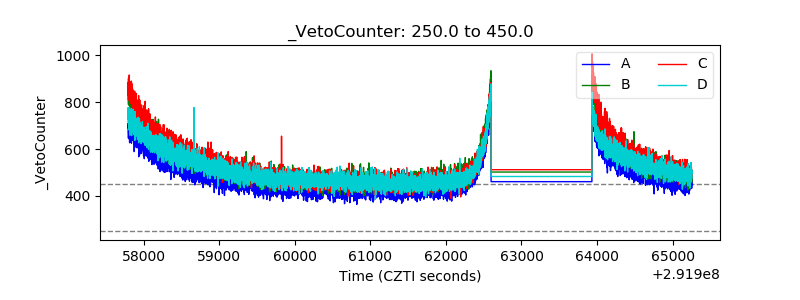 |