| Param | Original file | Final file |
|---|---|---|
| Filename | modeM0/AS1A05_132T01_9000002828_18993cztM0_level2.evt | modeM0/AS1A05_132T01_9000002828_18993cztM0_level2_quad_clean.evt |
| Size (bytes) | 1,070,156,160 | 146,399,040 |
| Size | 1020.6 MB | 139.6 MB |
| Events in quadrant A | 6,052,993 | 937,482 |
| Events in quadrant B | 6,529,735 | 949,480 |
| Events in quadrant C | 5,686,206 | 922,396 |
| Events in quadrant D | 13,386,674 | 850,358 |
| Mode M0 | |||
|---|---|---|---|
| Quadrant | BADHDUFLAG | Total packets | Discarded packets |
| A | 0 | 24874 | 2 |
| B | 0 | 26363 | 2 |
| C | 0 | 23393 | 2 |
| D | 0 | 47435 | 2 |
| Mode SS | |||
|---|---|---|---|
| Quadrant | BADHDUFLAG | Total packets | Discarded packets |
| A | 0 | 230 | 0 |
| B | 0 | 230 | 0 |
| C | 0 | 230 | 0 |
| D | 0 | 230 | 0 |
| Mode M9 | |||
|---|---|---|---|
| Quadrant | BADHDUFLAG | Total packets | Discarded packets |
| A | 0 | 19 | 0 |
| B | 0 | 19 | 0 |
| C | 0 | 19 | 0 |
| D | 0 | 19 | 0 |
| Quadrant | Total seconds | Saturated seconds | Saturation percentage |
|---|---|---|---|
| A | 11169 | 329 | 2.945653% |
| B | 11170 | 264 | 2.363474% |
| C | 11170 | 178 | 1.593554% |
| D | 11170 | 2362 | 21.145927% |
Noise dominated data is calculated using 1-second bins in cleaned event files. If a bin has >2000 counts, and if more than 50% of those come from <1% of pixels, then it is considered to be noise-dominated and hence unusable.
| Quadrant | # 1 sec bins | Bins with >0 counts | Bins with >2000 counts | High rate bins dominated by noise | Noise dominated (total time) | Noise dominated (detector-on time) | Marked lightcurve |
|---|---|---|---|---|---|---|---|
| A | 13164 | 11171 | 153 | 153 | 1.16% | 1.37% | 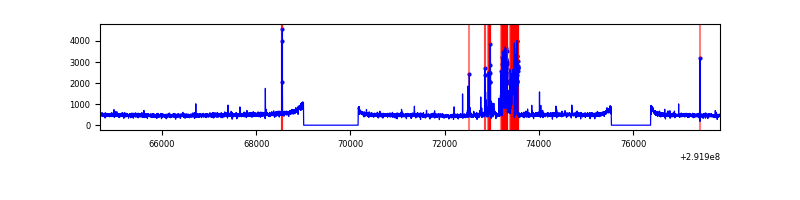 |
| B | 13165 | 11172 | 83 | 83 | 0.63% | 0.74% | 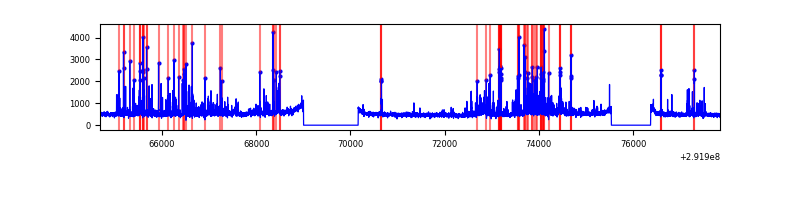 |
| C | 13165 | 11172 | 0 | 0 | 0.00% | 0.00% | 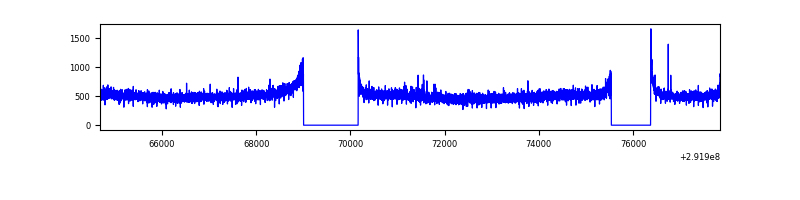 |
| D | 13165 | 11172 | 1979 | 1979 | 15.03% | 17.71% | 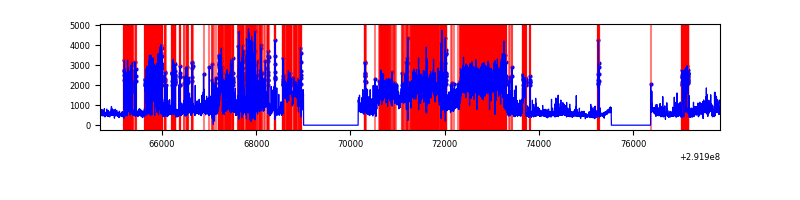 |
Top three noisy pixels from each quadrant. If the there are fewer than three noisy pixels in the level2.evt file, extra rows are filled as -1
| Pixel properties | Quadrant properties | ||||||
|---|---|---|---|---|---|---|---|
| Quadrant | DetID | PixID | Counts | Sigma | Mean | Median | Sigma |
| A | 9 | 143 | 635363 | 2238.9 | 1404 | 1378 | 283.2 |
| A | 13 | 254 | 12803 | 40.35 | 1404 | 1378 | 283.2 |
| A | 0 | 226 | 12180 | 38.15 | 1404 | 1378 | 283.2 |
| B | 3 | 112 | 669088 | 2513.63 | 1399 | 1366 | 265.6 |
| B | 7 | 220 | 236952 | 886.86 | 1399 | 1366 | 265.6 |
| B | 10 | 245 | 45631 | 166.64 | 1399 | 1366 | 265.6 |
| C | 14 | 238 | 212375 | 660.69 | 1368 | 1376 | 319.4 |
| C | 3 | 233 | 135772 | 420.82 | 1368 | 1376 | 319.4 |
| C | 13 | 61 | 9613 | 25.79 | 1368 | 1376 | 319.4 |
| D | 1 | 52 | 4717482 | 14741.71 | 1312 | 1275 | 319.9 |
| D | 7 | 238 | 3645764 | 11391.78 | 1312 | 1275 | 319.9 |
| D | 2 | 234 | 45581 | 138.49 | 1312 | 1275 | 319.9 |
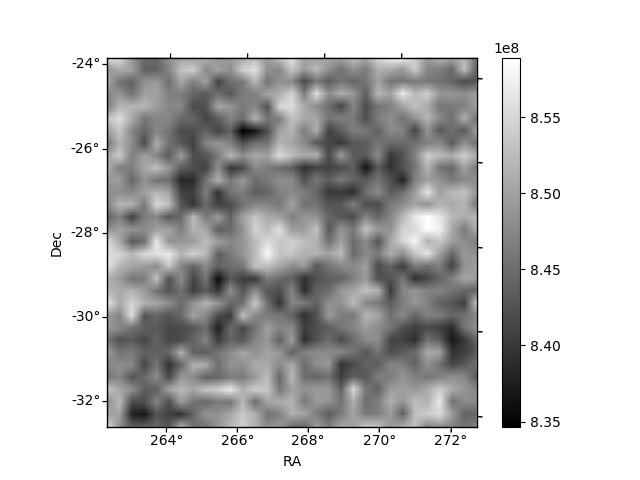
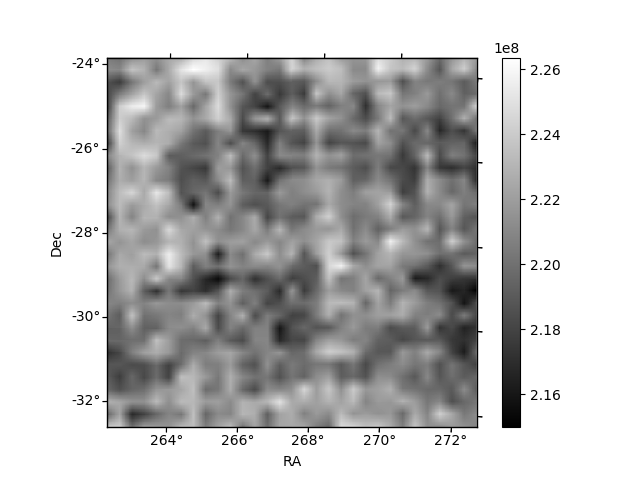
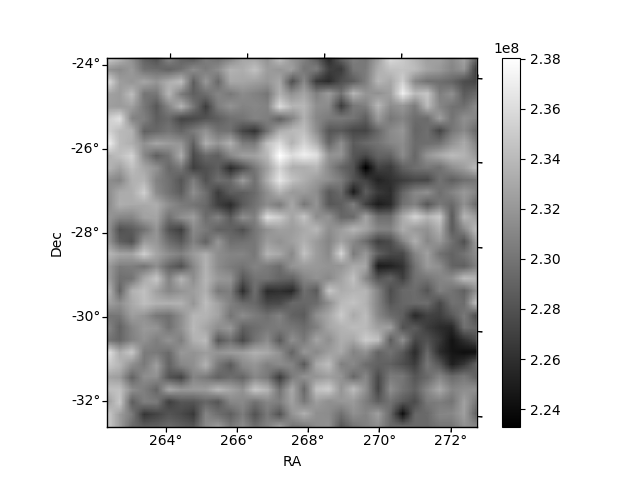
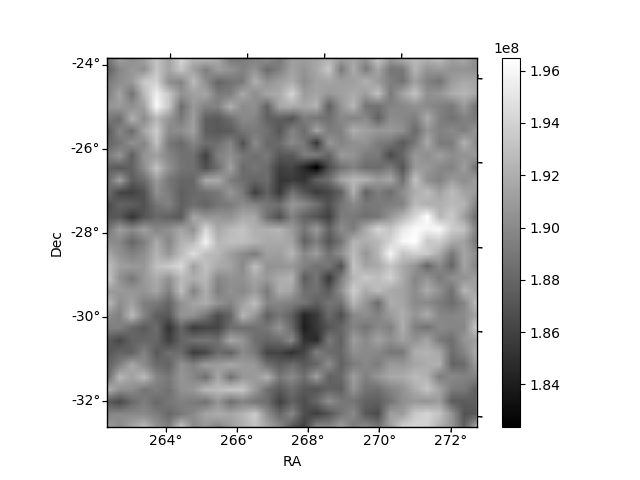
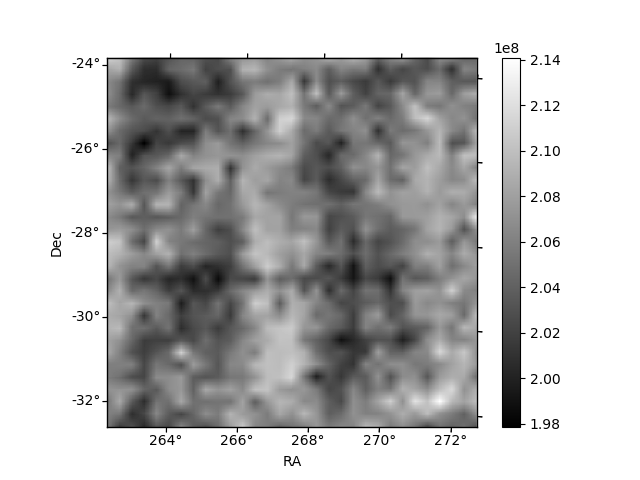
Histogram calculated using DETX and DETY for each event in the final _common_clean file
| Quadrant A | 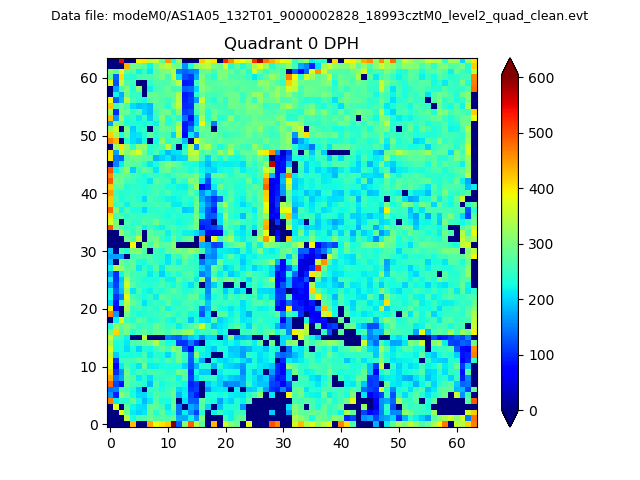 |
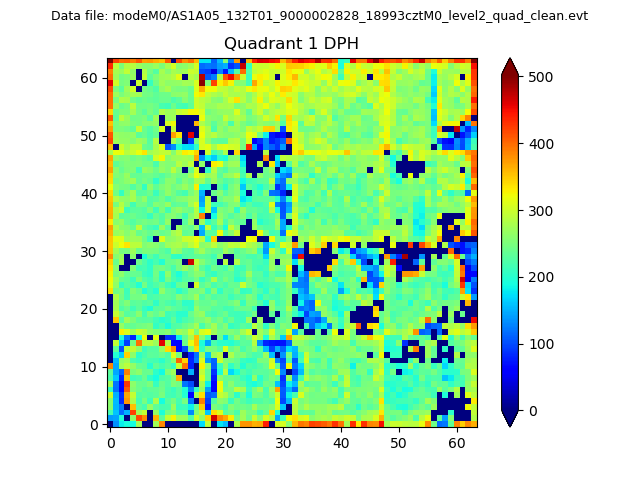 |
Quadrant B |
|---|---|---|---|
| Quadrant D |  |
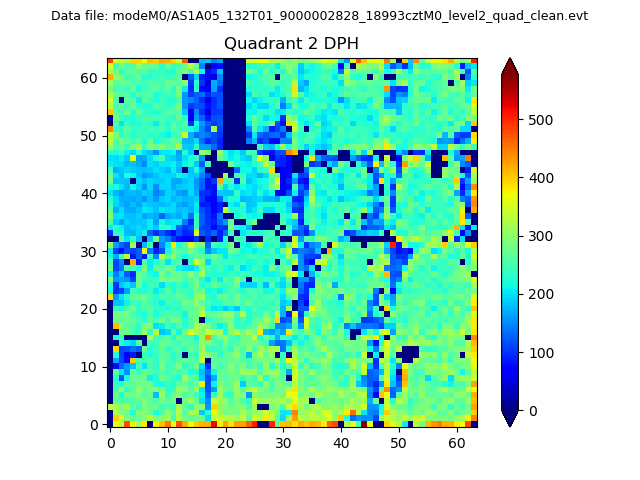 |
Quadrant C |
| Plot type | Count rate plots | Images |
|---|---|---|
| Comparison with Poisson distribution Blue bars denote a histogram of data divided into 1 sec bins. Red curve is a Poisson curve with rate = median count rate of data. |
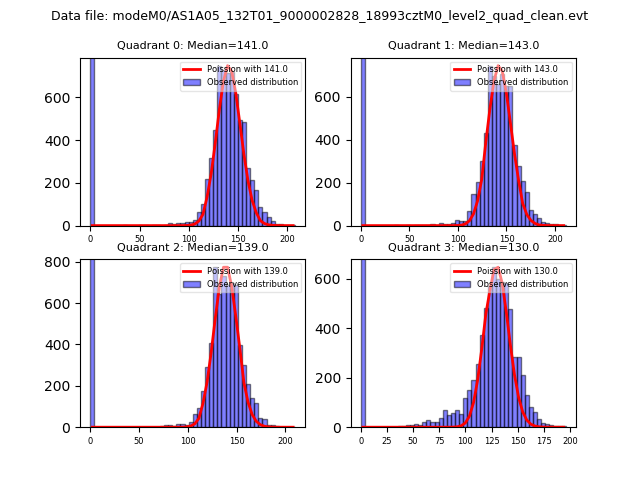 |
 |
| Quadrant-wise count rates Data is divided into 100 sec bins |
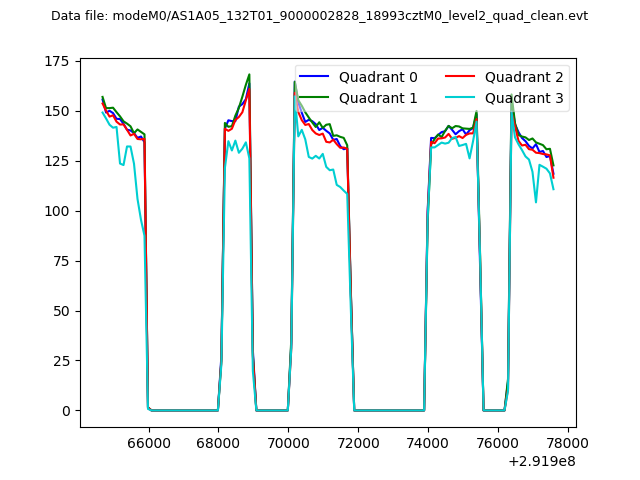 |
|
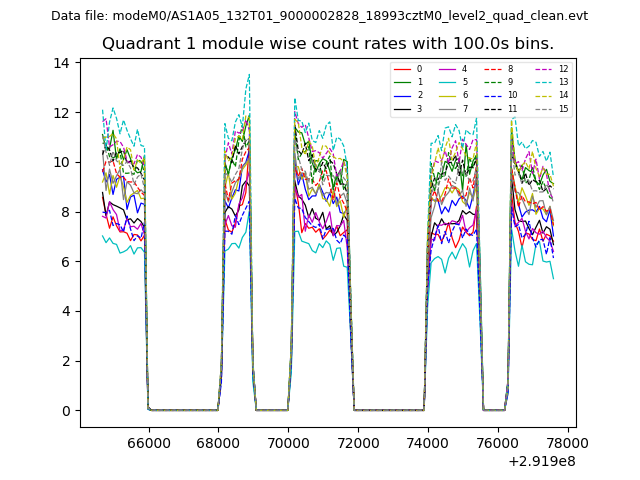
| Module-wise count rates for Quadrant A Data is divided into 100 sec bins |
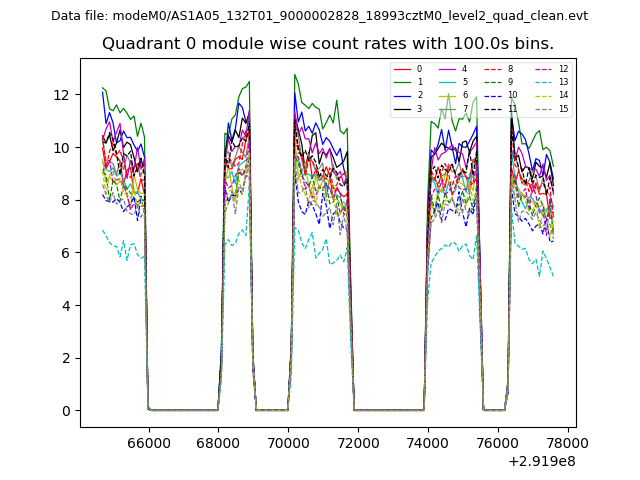 |
 |
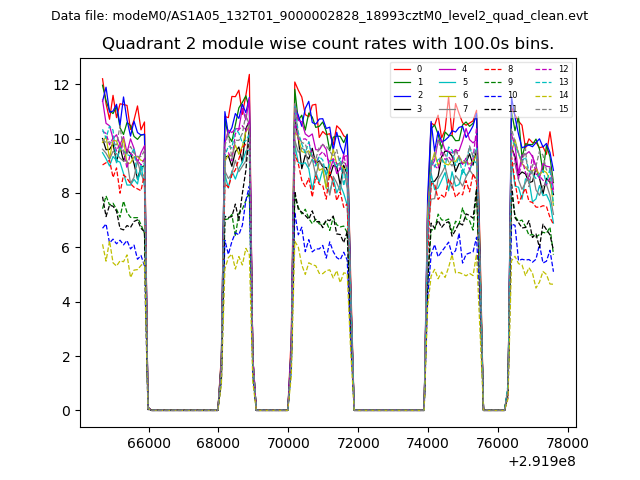
| Module-wise count rates for Quadrant B Data is divided into 100 sec bins |
 |
 |
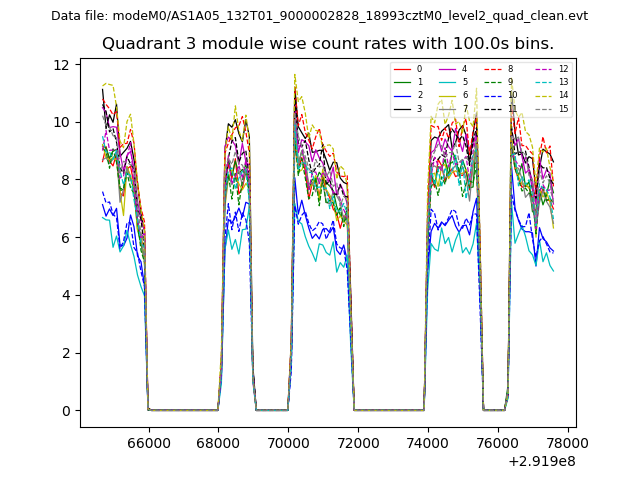
| Module-wise count rates for Quadrant C Data is divided into 100 sec bins |
 |
 |
| Module-wise count rates for Quadrant D Data is divided into 100 sec bins |
 |
 |
| Parameter | Plot |
|---|---|
| CZT HV Monitor | 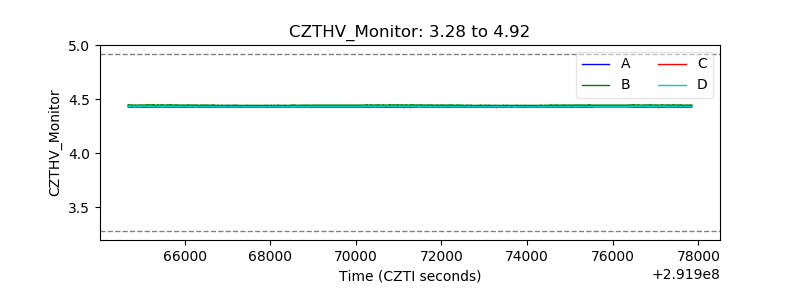 |
| D_VDD | 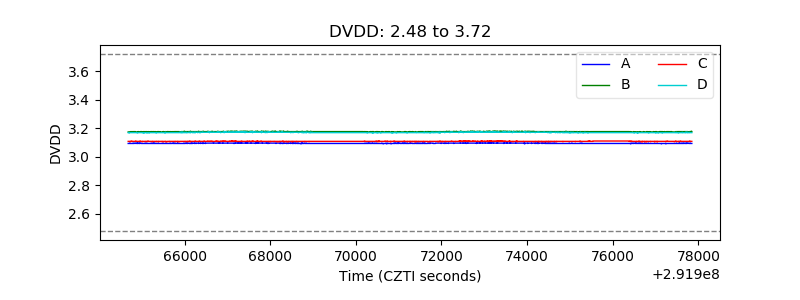 |
| Temperature 1 | 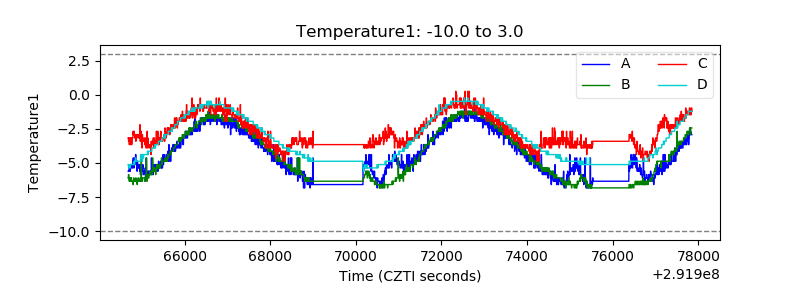 |
| Veto HV Monitor | 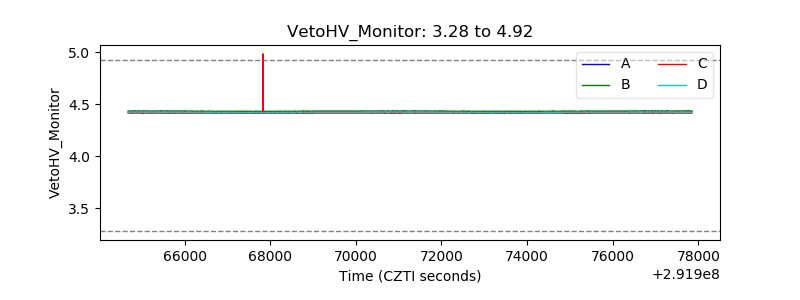 |
| Veto LLD | 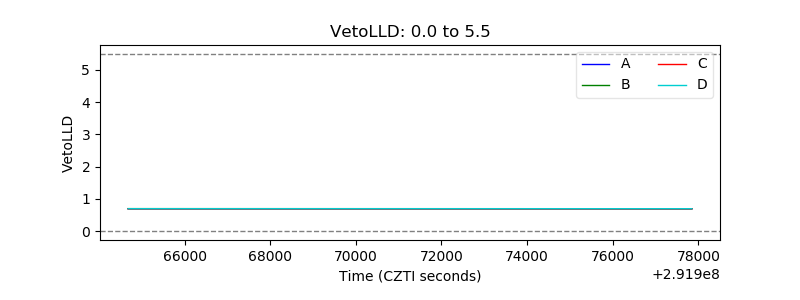 |
| Alpha Counter | 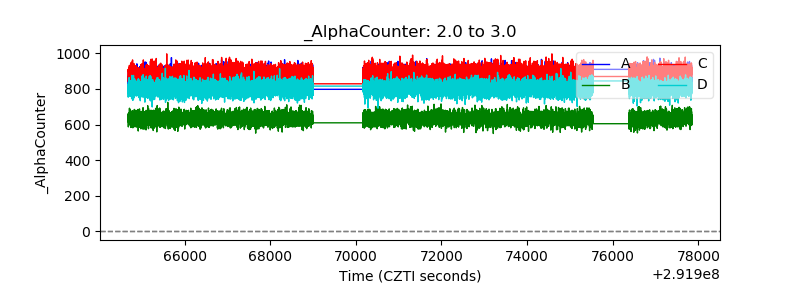 |
| _CPM_Rate | 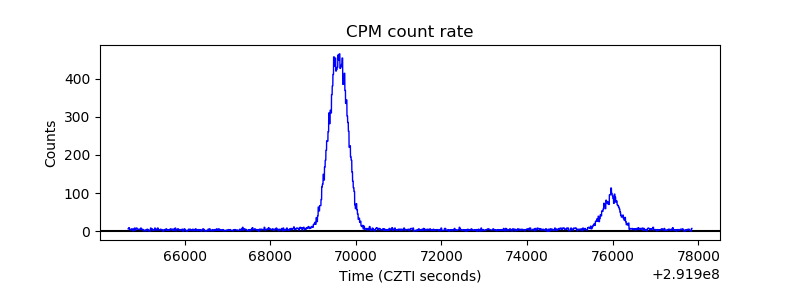 |
| CZT Counter | 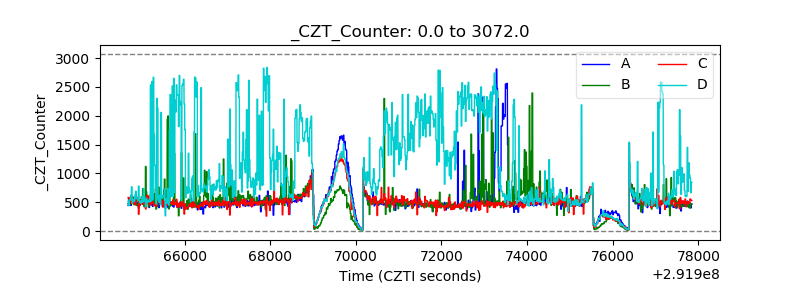 |
| +2.5 Volts monitor |  |
| +5 Volts monitor |  |
| _ROLL_ROT | 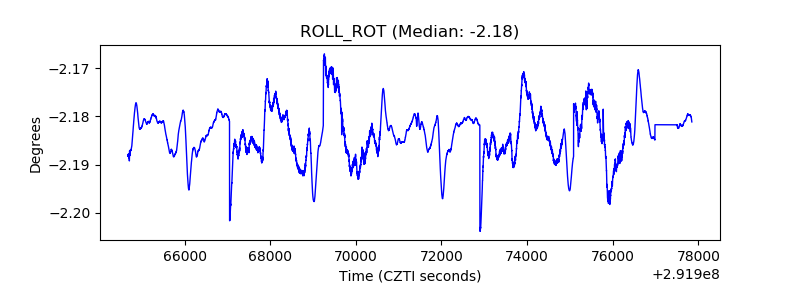 |
| _Roll_DEC | 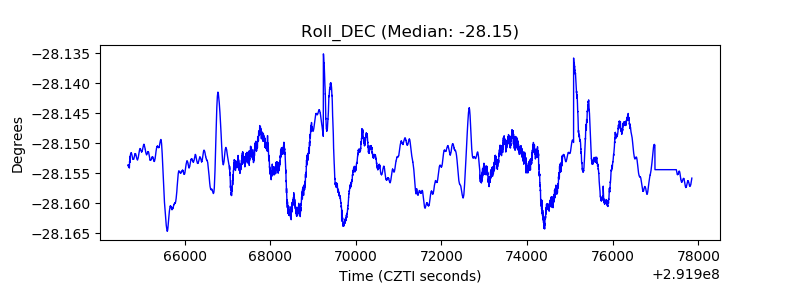 |
| _Roll_RA |  |
| Veto Counter |  |