| Param | Original file | Final file |
|---|---|---|
| Filename | modeM0/AS1A05_132T01_9000002828_18995cztM0_level2.evt | modeM0/AS1A05_132T01_9000002828_18995cztM0_level2_quad_clean.evt |
| Size (bytes) | 680,420,160 | 88,865,280 |
| Size | 648.9 MB | 84.7 MB |
| Events in quadrant A | 4,403,772 | 548,242 |
| Events in quadrant B | 3,877,347 | 559,544 |
| Events in quadrant C | 5,089,835 | 537,346 |
| Events in quadrant D | 6,726,194 | 521,440 |
| Mode M0 | |||
|---|---|---|---|
| Quadrant | BADHDUFLAG | Total packets | Discarded packets |
| A | 0 | 17996 | 1 |
| B | 0 | 16179 | 2 |
| C | 0 | 20400 | 1 |
| D | 0 | 25237 | 1 |
| Mode SS | |||
|---|---|---|---|
| Quadrant | BADHDUFLAG | Total packets | Discarded packets |
| A | 0 | 152 | 0 |
| B | 0 | 152 | 0 |
| C | 0 | 152 | 0 |
| D | 0 | 152 | 0 |
| Quadrant | Total seconds | Saturated seconds | Saturation percentage |
|---|---|---|---|
| A | 7527 | 450 | 5.978477% |
| B | 7527 | 271 | 3.600372% |
| C | 7527 | 303 | 4.025508% |
| D | 7527 | 668 | 8.874718% |
Noise dominated data is calculated using 1-second bins in cleaned event files. If a bin has >2000 counts, and if more than 50% of those come from <1% of pixels, then it is considered to be noise-dominated and hence unusable.
| Quadrant | # 1 sec bins | Bins with >0 counts | Bins with >2000 counts | High rate bins dominated by noise | Noise dominated (total time) | Noise dominated (detector-on time) | Marked lightcurve |
|---|---|---|---|---|---|---|---|
| A | 7557 | 7528 | 125 | 125 | 1.65% | 1.66% | 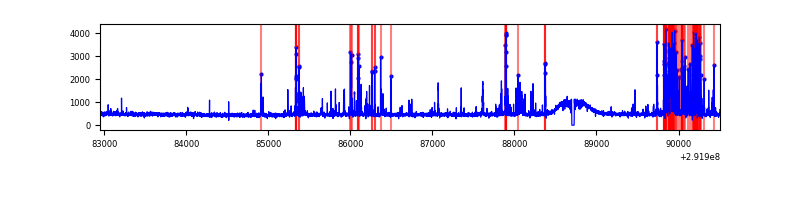 |
| B | 7557 | 7528 | 10 | 10 | 0.13% | 0.13% | 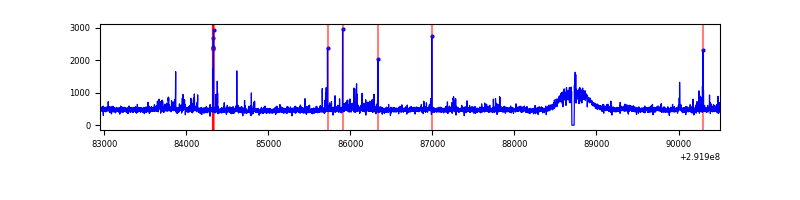 |
| C | 7557 | 7528 | 1 | 1 | 0.01% | 0.01% | 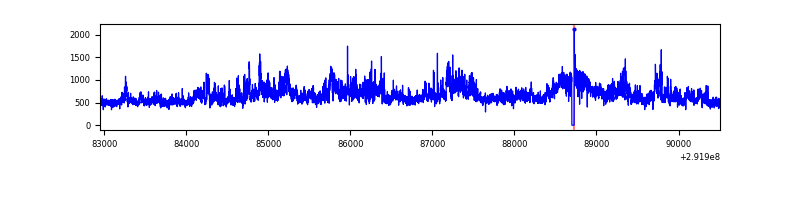 |
| D | 7557 | 7528 | 327 | 327 | 4.33% | 4.34% | 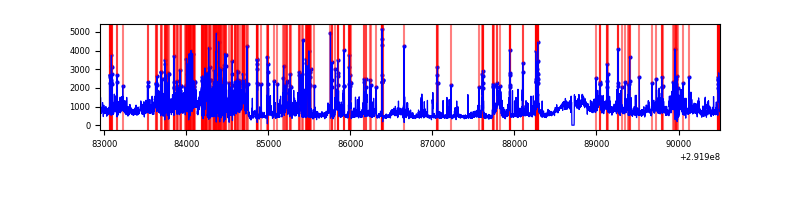 |
Top three noisy pixels from each quadrant. If the there are fewer than three noisy pixels in the level2.evt file, extra rows are filled as -1
| Pixel properties | Quadrant properties | ||||||
|---|---|---|---|---|---|---|---|
| Quadrant | DetID | PixID | Counts | Sigma | Mean | Median | Sigma |
| A | 14 | 235 | 784971 | 4131.35 | 931 | 910 | 189.8 |
| A | 0 | 13 | 12014 | 58.51 | 931 | 910 | 189.8 |
| A | 9 | 143 | 10533 | 50.71 | 931 | 910 | 189.8 |
| B | 3 | 112 | 99380 | 545.4 | 930 | 904 | 180.6 |
| B | 0 | 189 | 38148 | 206.27 | 930 | 904 | 180.6 |
| B | 7 | 220 | 30186 | 162.18 | 930 | 904 | 180.6 |
| C | 3 | 233 | 1428524 | 6760.11 | 898 | 905 | 211.2 |
| C | 14 | 238 | 136819 | 643.58 | 898 | 905 | 211.2 |
| C | 8 | 128 | 12732 | 56.0 | 898 | 905 | 211.2 |
| D | 1 | 52 | 1620132 | 7247.53 | 903 | 875 | 223.4 |
| D | 7 | 238 | 1600930 | 7161.59 | 903 | 875 | 223.4 |
| D | 7 | 38 | 38859 | 170.01 | 903 | 875 | 223.4 |
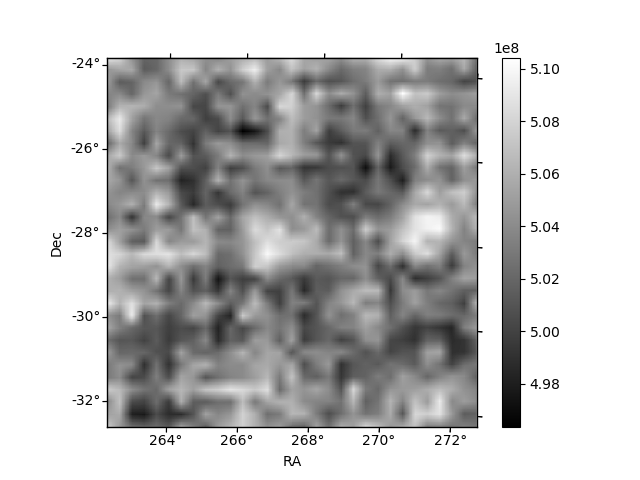
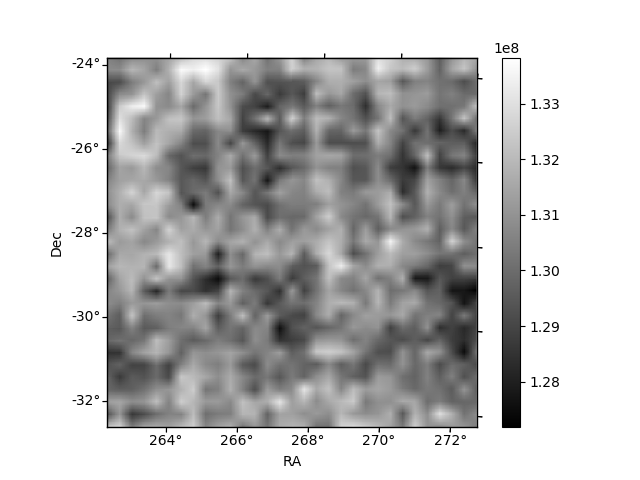
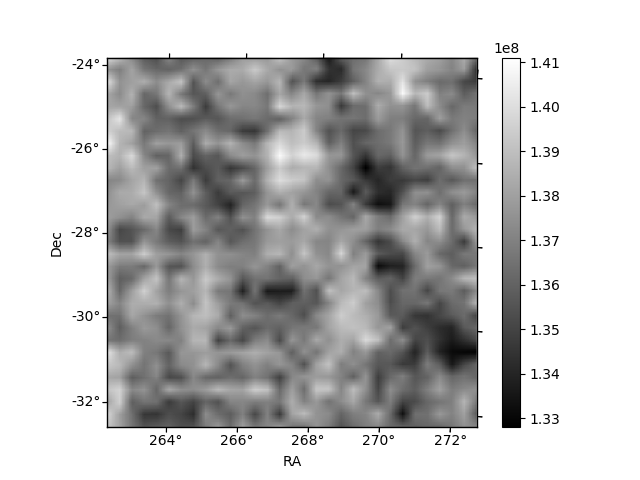
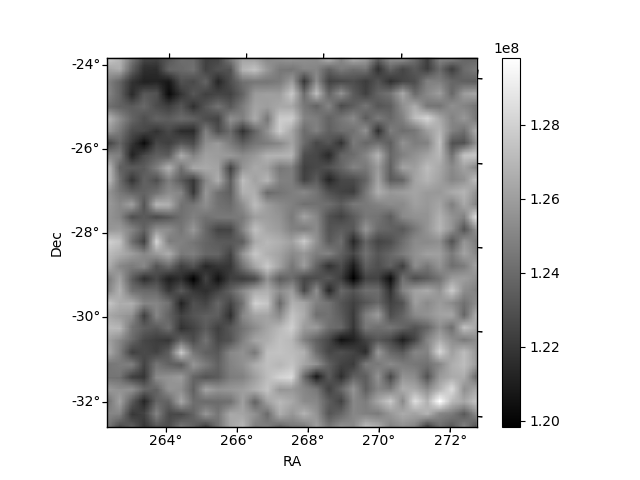
Histogram calculated using DETX and DETY for each event in the final _common_clean file
| Quadrant A | 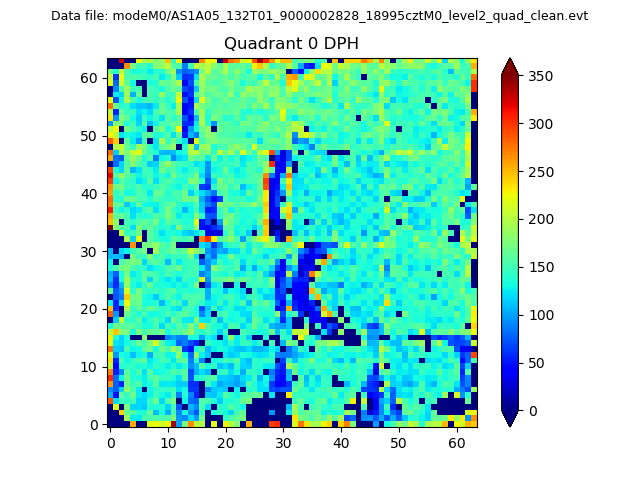 |
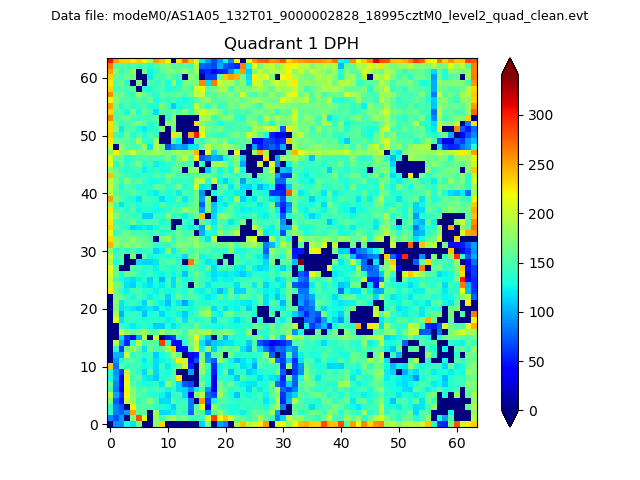 |
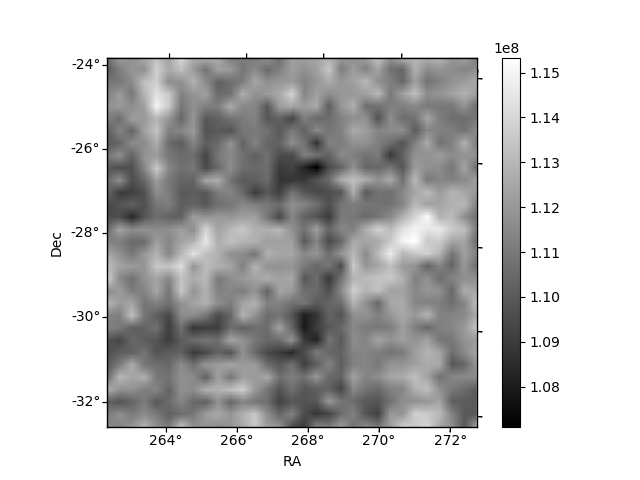
Quadrant B |
|---|---|---|---|
| Quadrant D | 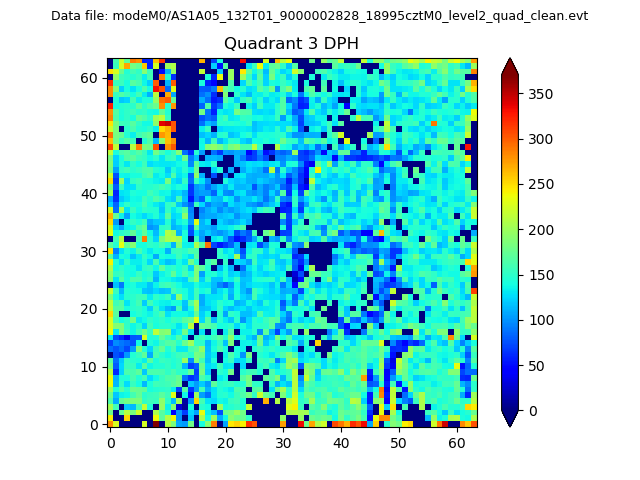 |
 |
Quadrant C |
| Plot type | Count rate plots | Images |
|---|---|---|
| Comparison with Poisson distribution Blue bars denote a histogram of data divided into 1 sec bins. Red curve is a Poisson curve with rate = median count rate of data. |
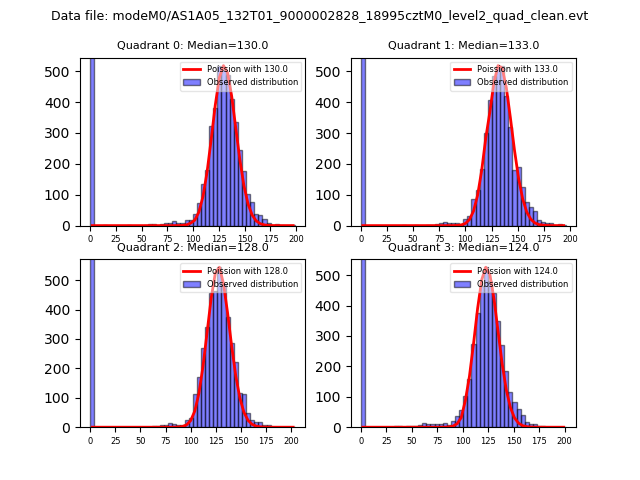 |
 |
| Quadrant-wise count rates Data is divided into 100 sec bins |
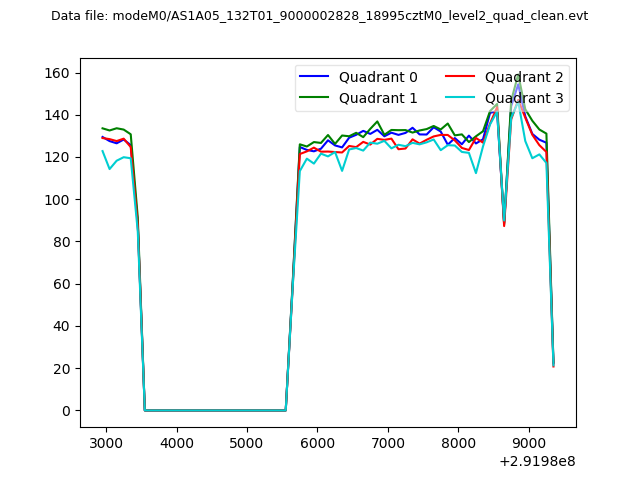 |
|
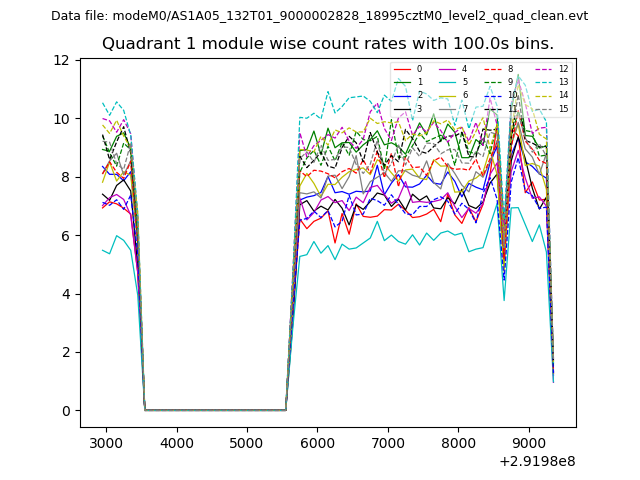
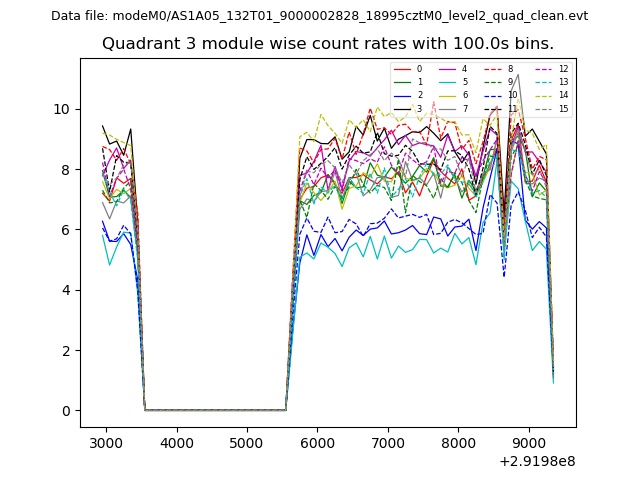
| Module-wise count rates for Quadrant A Data is divided into 100 sec bins |
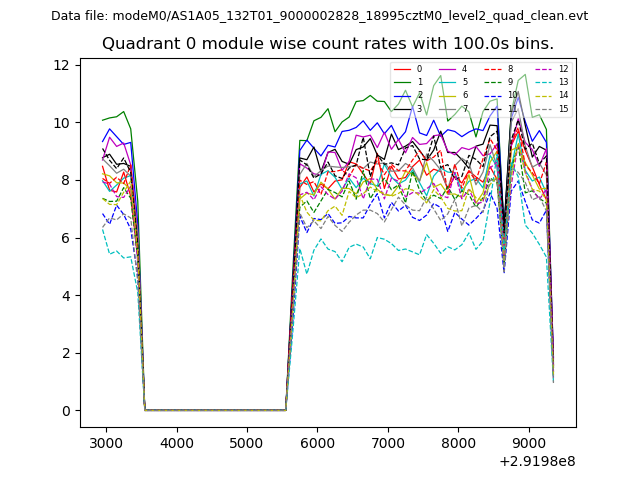 |
 |
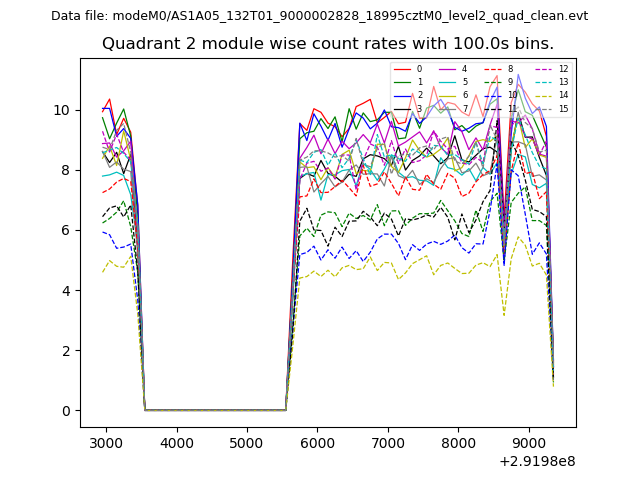
| Module-wise count rates for Quadrant B Data is divided into 100 sec bins |
 |
 |
| Module-wise count rates for Quadrant C Data is divided into 100 sec bins |
 |
 |
| Module-wise count rates for Quadrant D Data is divided into 100 sec bins |
 |
 |
| Parameter | Plot |
|---|---|
| CZT HV Monitor | 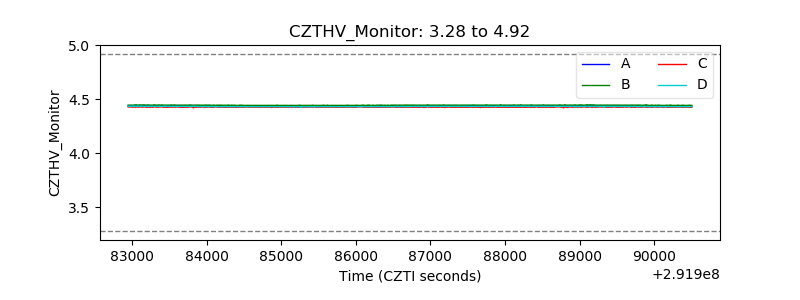 |
| D_VDD | 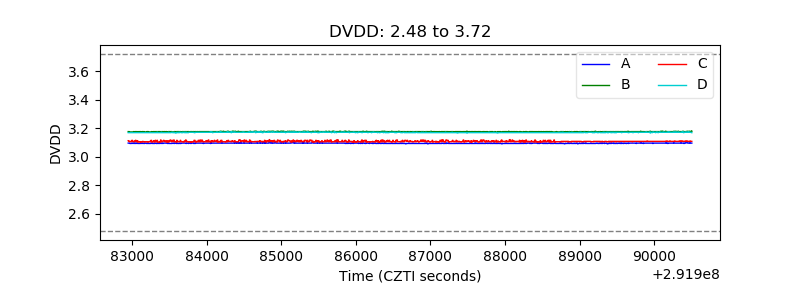 |
| Temperature 1 | 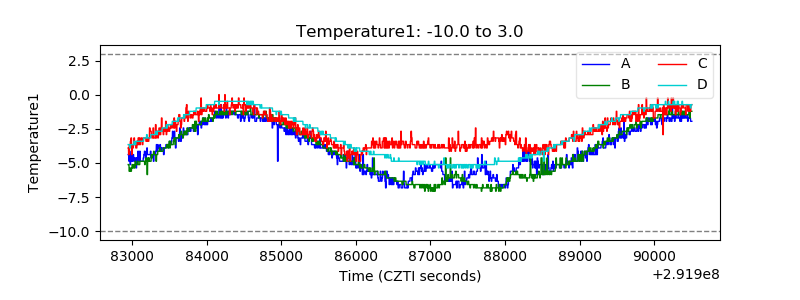 |
| Veto HV Monitor | 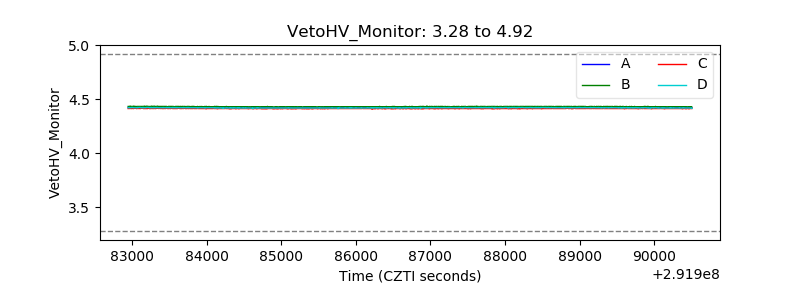 |
| Veto LLD | 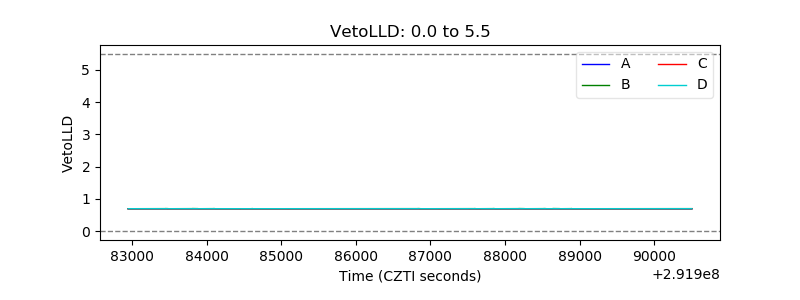 |
| Alpha Counter | 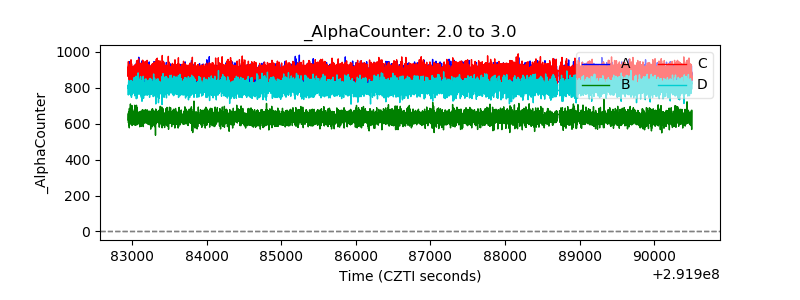 |
| _CPM_Rate | 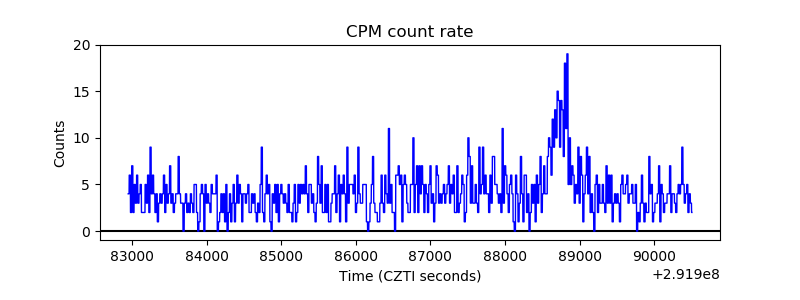 |
| CZT Counter | 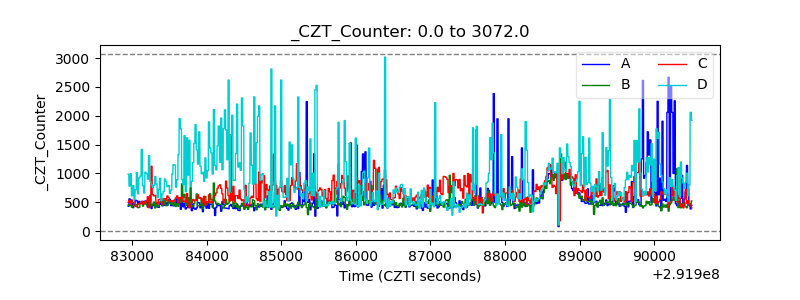 |
| +2.5 Volts monitor | 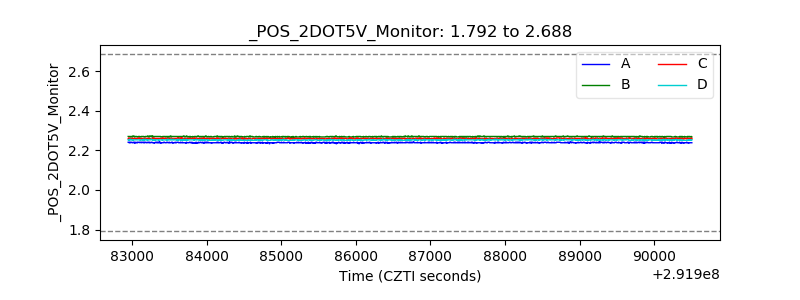 |
| +5 Volts monitor | 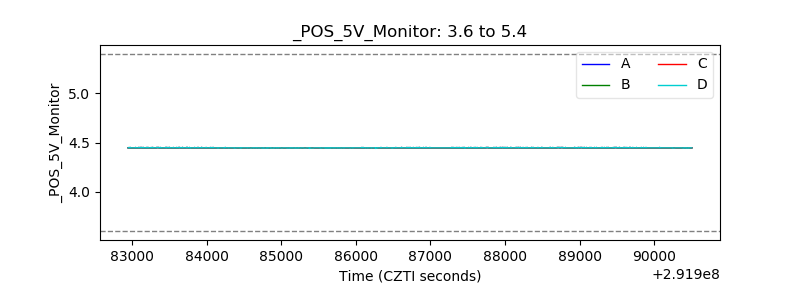 |
| _ROLL_ROT | 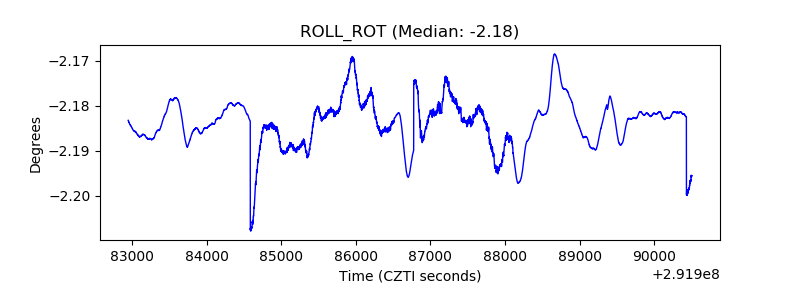 |
| _Roll_DEC |  |
| _Roll_RA | 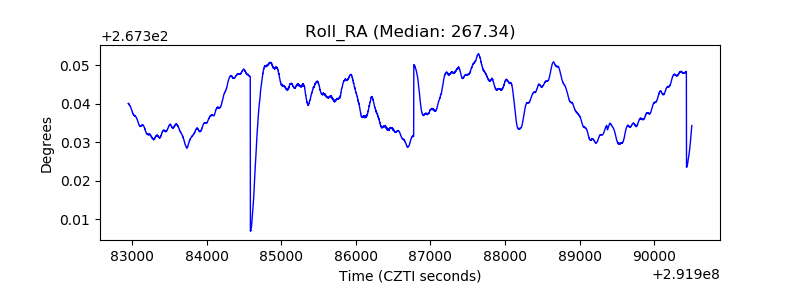 |
| Veto Counter | 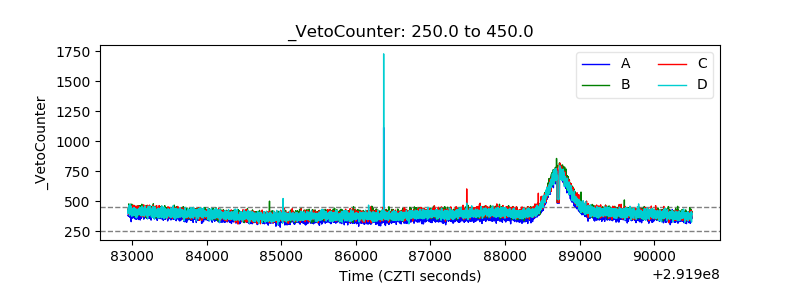 |