| Param | Original file | Final file |
|---|---|---|
| Filename | modeM0/AS1A05_132T01_9000002828_18998cztM0_level2.evt | modeM0/AS1A05_132T01_9000002828_18998cztM0_level2_quad_clean.evt |
| Size (bytes) | 1,262,424,960 | 150,641,280 |
| Size | 1.2 GB | 143.7 MB |
| Events in quadrant A | 12,716,627 | 803,526 |
| Events in quadrant B | 7,252,241 | 977,951 |
| Events in quadrant C | 6,937,805 | 954,177 |
| Events in quadrant D | 10,443,180 | 920,632 |
| Mode M0 | |||
|---|---|---|---|
| Quadrant | BADHDUFLAG | Total packets | Discarded packets |
| A | 0 | 46282 | 3 |
| B | 0 | 30012 | 3 |
| C | 0 | 28518 | 3 |
| D | 0 | 40282 | 3 |
| Mode SS | |||
|---|---|---|---|
| Quadrant | BADHDUFLAG | Total packets | Discarded packets |
| A | 0 | 266 | 0 |
| B | 0 | 266 | 0 |
| C | 0 | 266 | 0 |
| D | 0 | 266 | 0 |
| Mode M9 | |||
|---|---|---|---|
| Quadrant | BADHDUFLAG | Total packets | Discarded packets |
| A | 0 | 12 | 0 |
| B | 0 | 12 | 0 |
| C | 0 | 12 | 0 |
| D | 0 | 12 | 0 |
| Quadrant | Total seconds | Saturated seconds | Saturation percentage |
|---|---|---|---|
| A | 13093 | 2579 | 19.697548% |
| B | 13093 | 340 | 2.596807% |
| C | 13093 | 294 | 2.245475% |
| D | 13093 | 633 | 4.834644% |
Noise dominated data is calculated using 1-second bins in cleaned event files. If a bin has >2000 counts, and if more than 50% of those come from <1% of pixels, then it is considered to be noise-dominated and hence unusable.
| Quadrant | # 1 sec bins | Bins with >0 counts | Bins with >2000 counts | High rate bins dominated by noise | Noise dominated (total time) | Noise dominated (detector-on time) | Marked lightcurve |
|---|---|---|---|---|---|---|---|
| A | 14283 | 13094 | 1803 | 1803 | 12.62% | 13.77% | 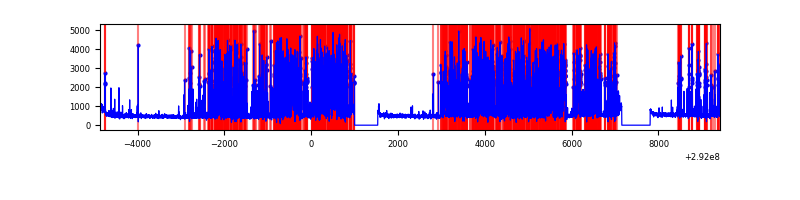 |
| B | 14283 | 13095 | 78 | 78 | 0.55% | 0.60% | 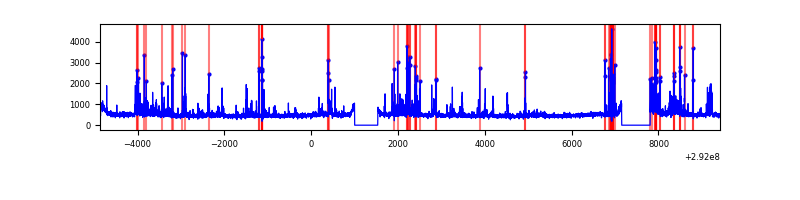 |
| C | 14283 | 13095 | 70 | 70 | 0.49% | 0.53% | 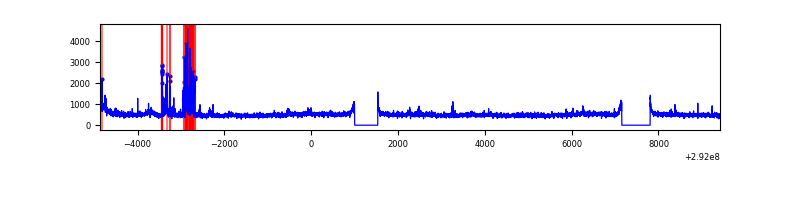 |
| D | 14283 | 13095 | 340 | 340 | 2.38% | 2.60% | 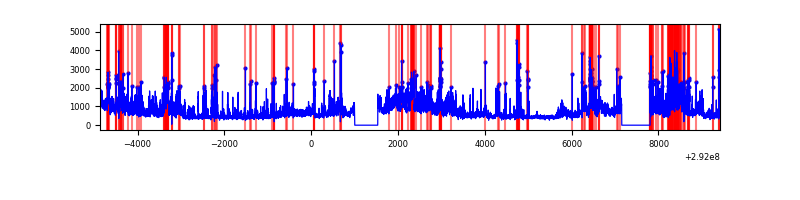 |
Top three noisy pixels from each quadrant. If the there are fewer than three noisy pixels in the level2.evt file, extra rows are filled as -1
| Pixel properties | Quadrant properties | ||||||
|---|---|---|---|---|---|---|---|
| Quadrant | DetID | PixID | Counts | Sigma | Mean | Median | Sigma |
| A | 14 | 235 | 6949733 | 23797.83 | 1442 | 1412 | 292.0 |
| A | 0 | 13 | 170565 | 579.35 | 1442 | 1412 | 292.0 |
| A | 9 | 143 | 49856 | 165.92 | 1442 | 1412 | 292.0 |
| B | 3 | 112 | 648557 | 2150.22 | 1570 | 1529 | 300.9 |
| B | 7 | 220 | 320546 | 1060.16 | 1570 | 1529 | 300.9 |
| B | 4 | 216 | 47578 | 153.03 | 1570 | 1529 | 300.9 |
| C | 3 | 233 | 766487 | 2146.44 | 1519 | 1531 | 356.4 |
| C | 14 | 238 | 231625 | 645.64 | 1519 | 1531 | 356.4 |
| C | 8 | 208 | 18028 | 46.29 | 1519 | 1531 | 356.4 |
| D | 7 | 238 | 3100643 | 8251.13 | 1526 | 1479 | 375.6 |
| D | 1 | 52 | 881052 | 2341.75 | 1526 | 1479 | 375.6 |
| D | 9 | 1 | 363636 | 964.2 | 1526 | 1479 | 375.6 |
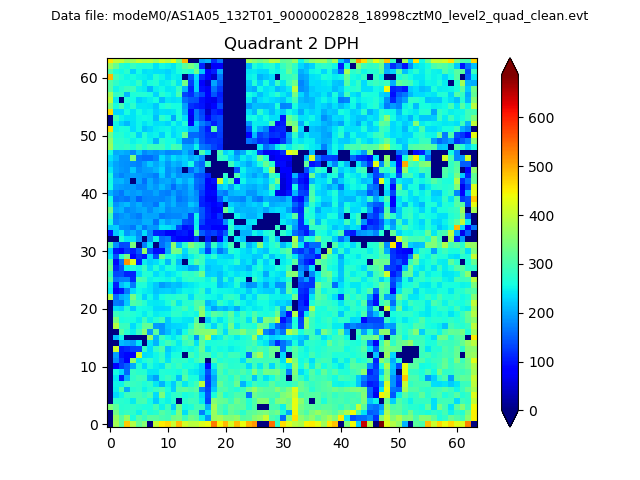
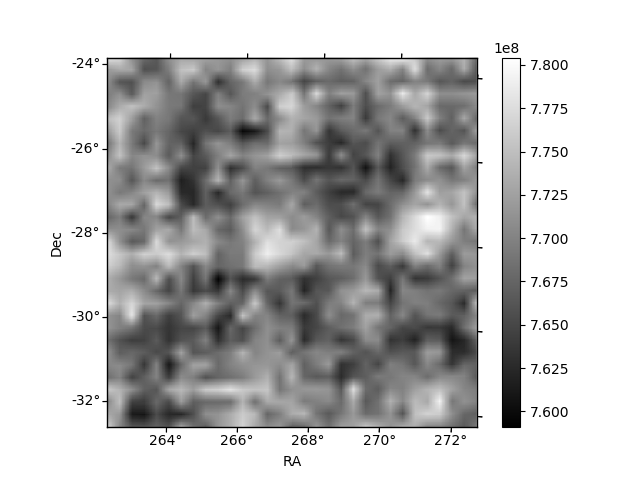
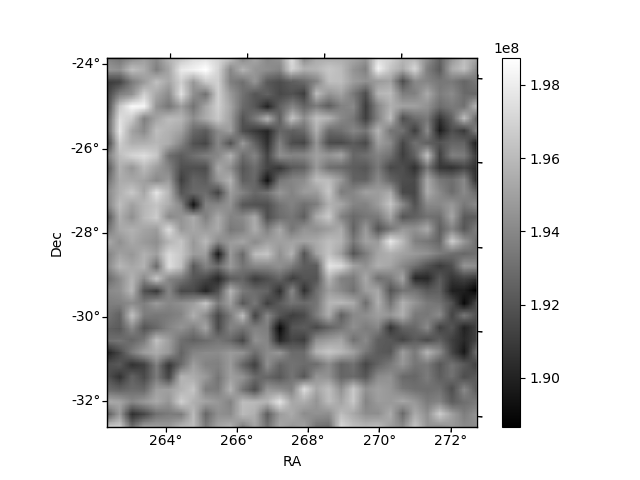
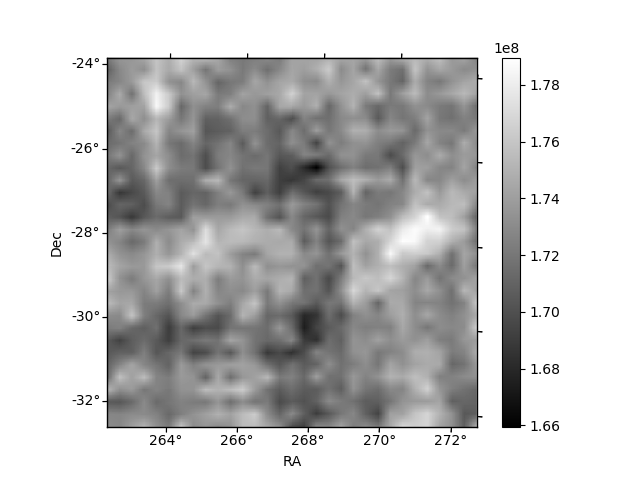
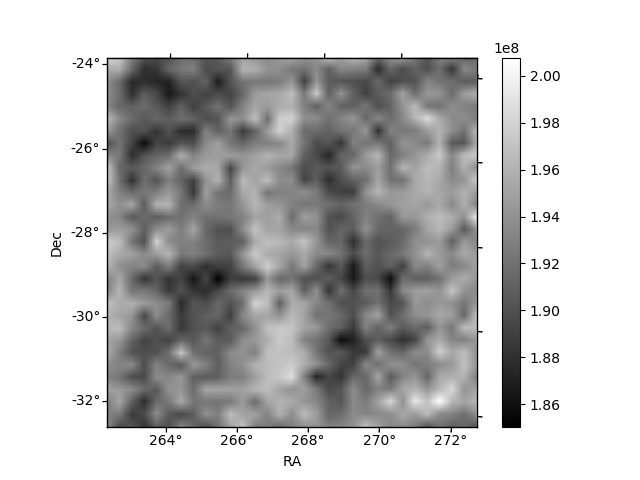
Histogram calculated using DETX and DETY for each event in the final _common_clean file
| Quadrant A | 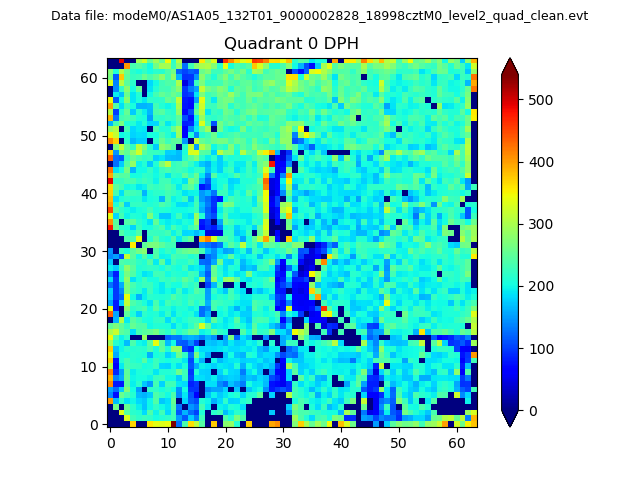 |
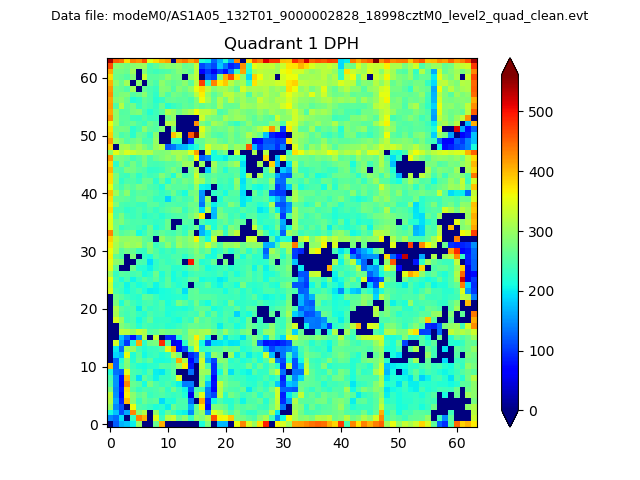 |
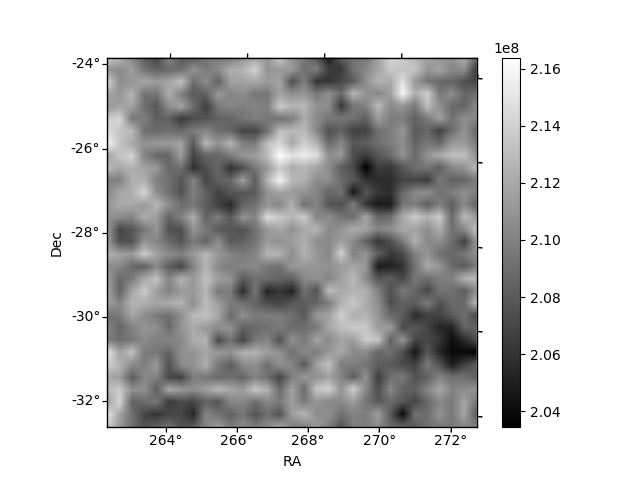
Quadrant B |
|---|---|---|---|
| Quadrant D | 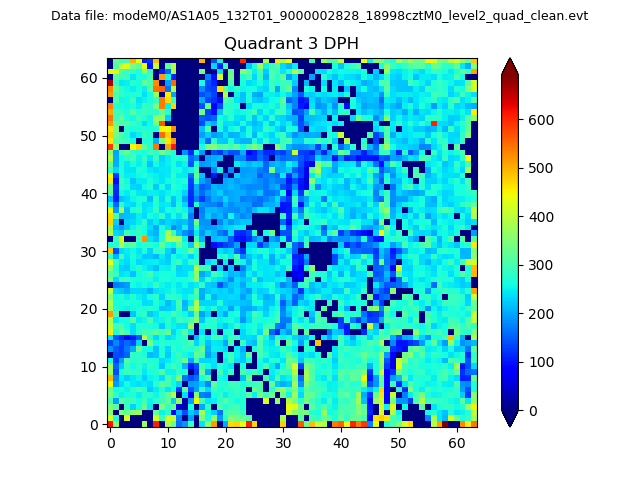 |
 |
Quadrant C |
| Plot type | Count rate plots | Images |
|---|---|---|
| Comparison with Poisson distribution Blue bars denote a histogram of data divided into 1 sec bins. Red curve is a Poisson curve with rate = median count rate of data. |
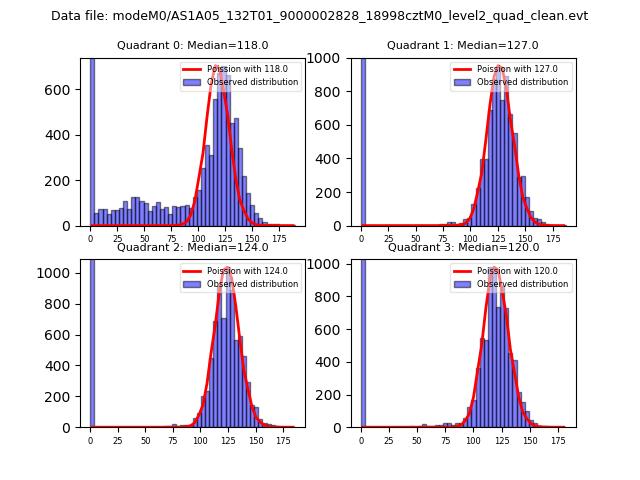 |
 |
| Quadrant-wise count rates Data is divided into 100 sec bins |
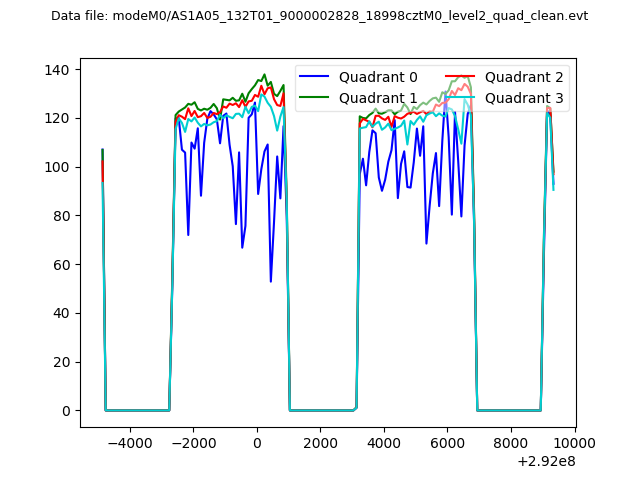 |
|
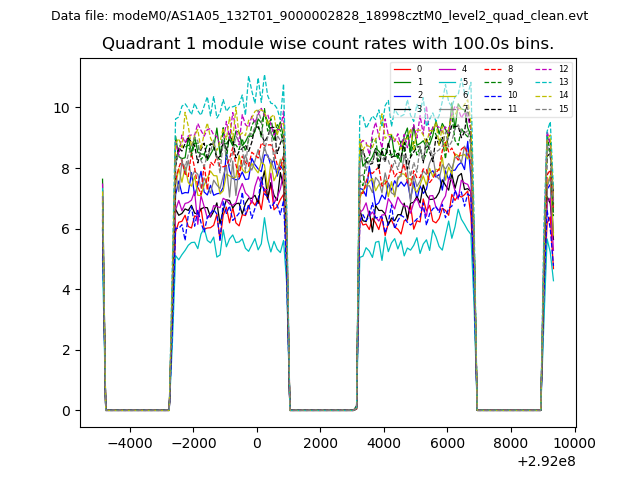
| Module-wise count rates for Quadrant A Data is divided into 100 sec bins |
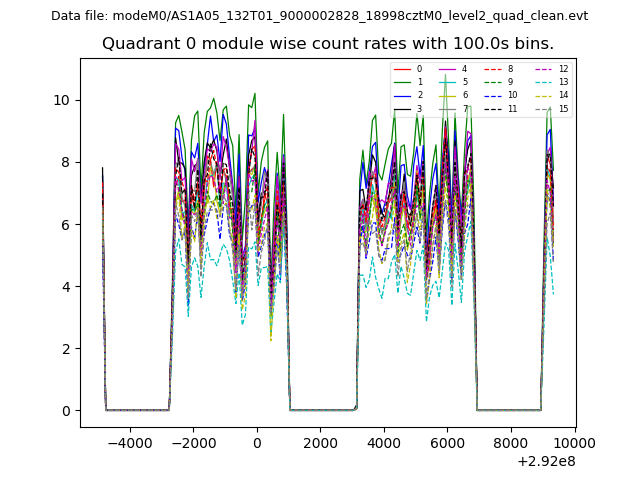 |
 |
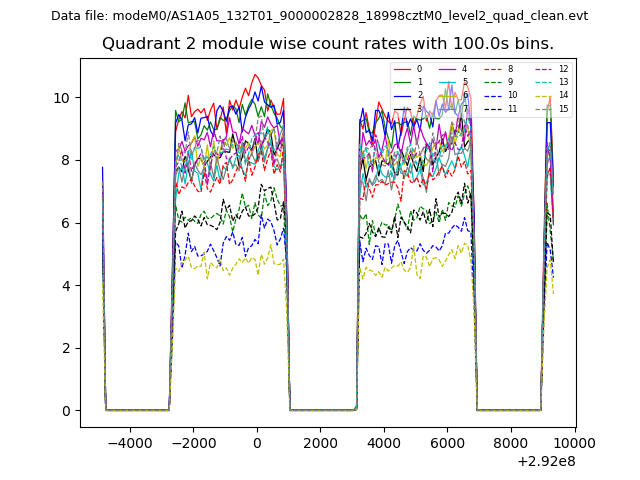
| Module-wise count rates for Quadrant B Data is divided into 100 sec bins |
 |
 |
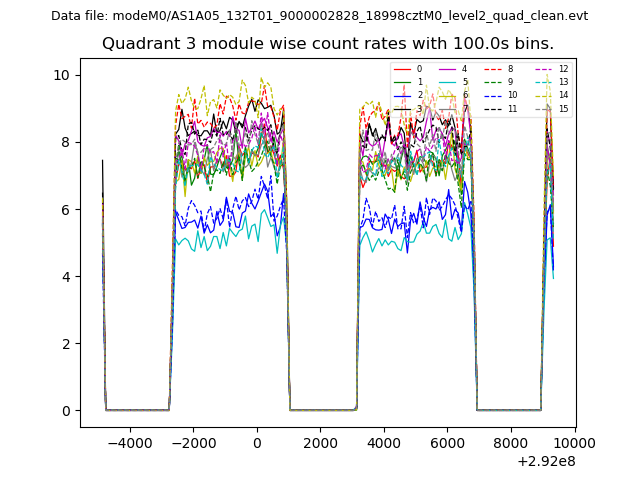
| Module-wise count rates for Quadrant C Data is divided into 100 sec bins |
 |
 |
| Module-wise count rates for Quadrant D Data is divided into 100 sec bins |
 |
 |
| Parameter | Plot |
|---|---|
| CZT HV Monitor | 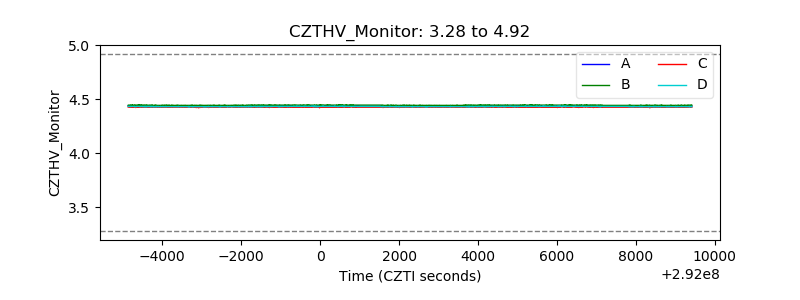 |
| D_VDD | 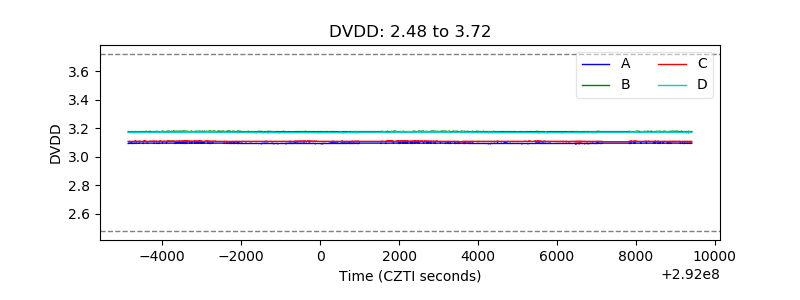 |
| Temperature 1 | 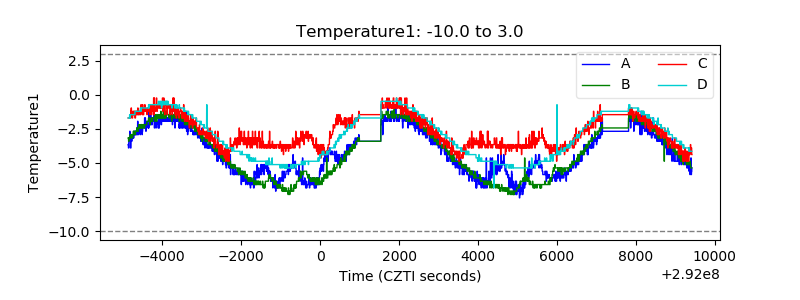 |
| Veto HV Monitor | 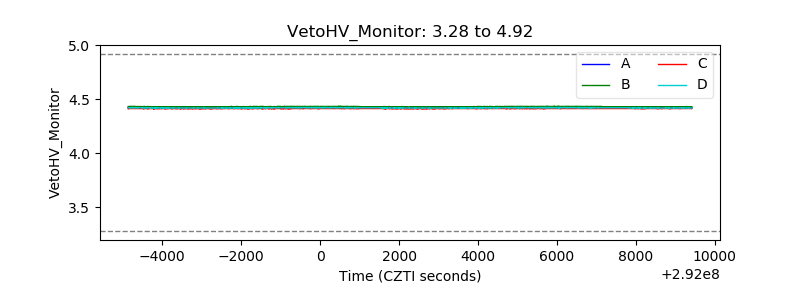 |
| Veto LLD | 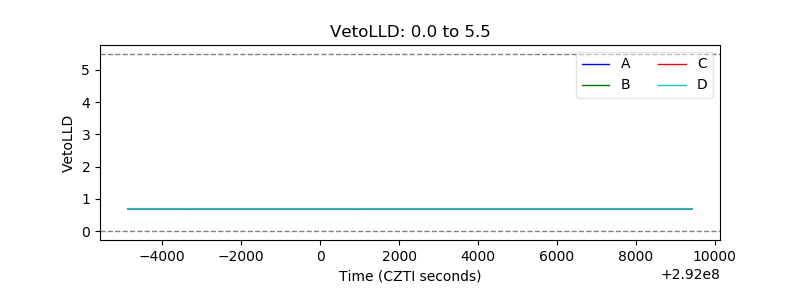 |
| Alpha Counter | 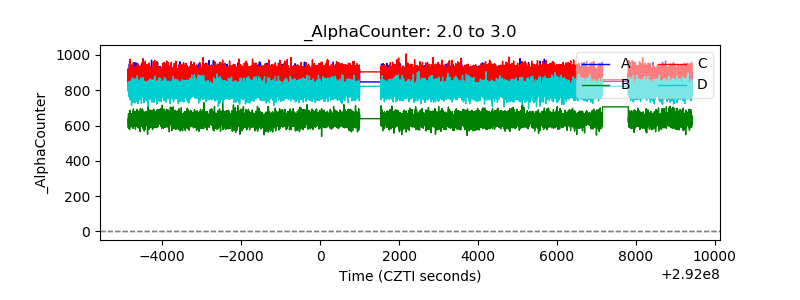 |
| _CPM_Rate | 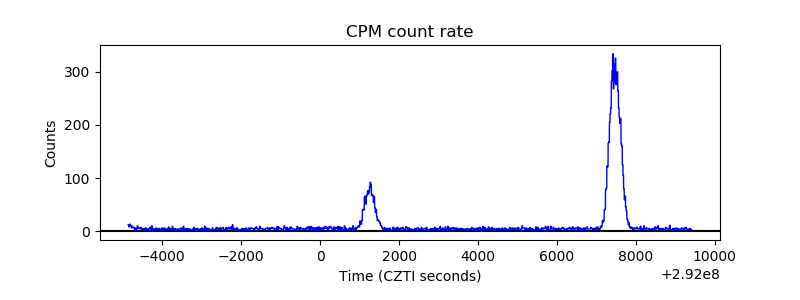 |
| CZT Counter | 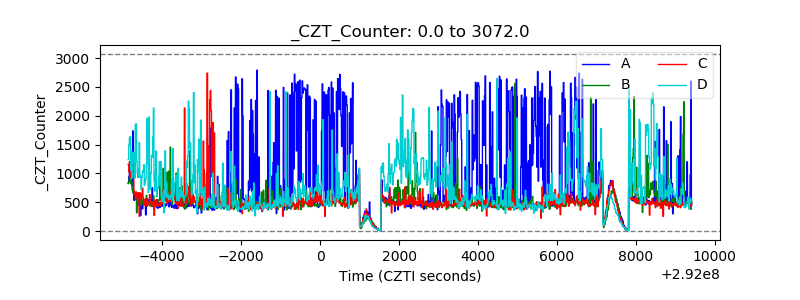 |
| +2.5 Volts monitor |  |
| +5 Volts monitor |  |
| _ROLL_ROT | 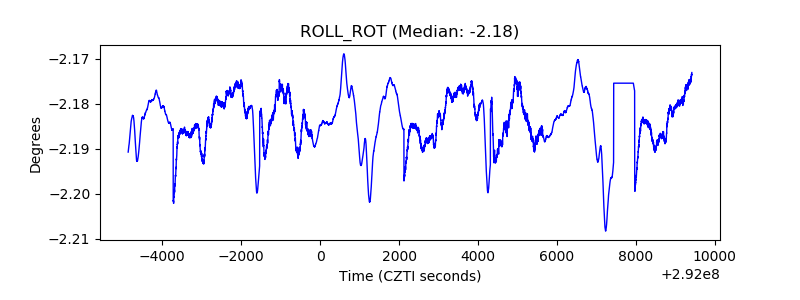 |
| _Roll_DEC | 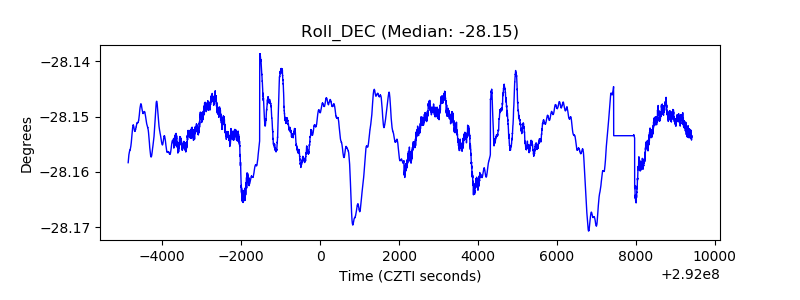 |
| _Roll_RA | 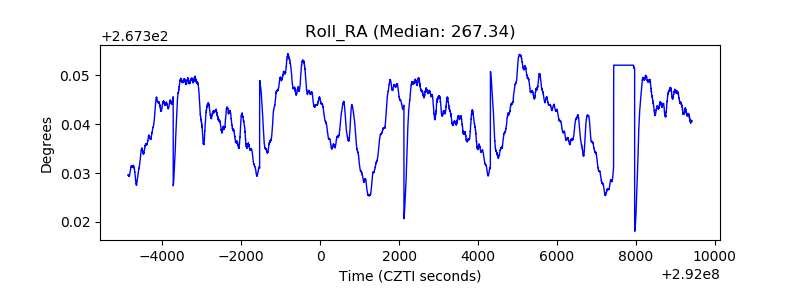 |
| Veto Counter | 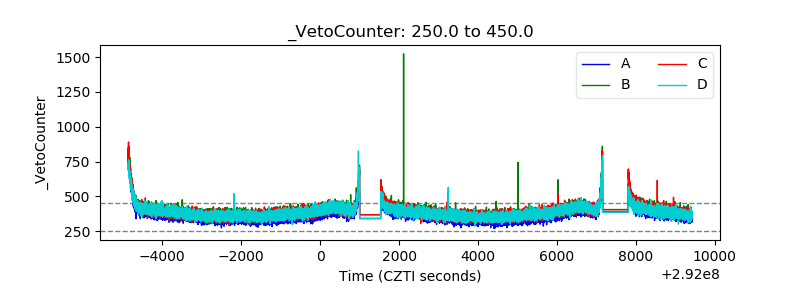 |