| Param | Original file | Final file |
|---|---|---|
| Filename | modeM0/AS1A05_132T01_9000002828_18999cztM0_level2.evt | modeM0/AS1A05_132T01_9000002828_18999cztM0_level2_quad_clean.evt |
| Size (bytes) | 237,939,840 | 33,670,080 |
| Size | 226.9 MB | 32.1 MB |
| Events in quadrant A | 2,520,591 | 190,983 |
| Events in quadrant B | 1,470,206 | 216,047 |
| Events in quadrant C | 1,232,578 | 212,131 |
| Events in quadrant D | 1,797,993 | 207,226 |
| Mode M0 | |||
|---|---|---|---|
| Quadrant | BADHDUFLAG | Total packets | Discarded packets |
| A | 0 | 9161 | 0 |
| B | 0 | 6197 | 0 |
| C | 0 | 5404 | 0 |
| D | 0 | 7361 | 0 |
| Mode SS | |||
|---|---|---|---|
| Quadrant | BADHDUFLAG | Total packets | Discarded packets |
| A | 0 | 54 | 0 |
| B | 0 | 54 | 0 |
| C | 0 | 54 | 0 |
| D | 0 | 54 | 0 |
| Quadrant | Total seconds | Saturated seconds | Saturation percentage |
|---|---|---|---|
| A | 2688 | 403 | 14.992560% |
| B | 2688 | 42 | 1.562500% |
| C | 2688 | 15 | 0.558036% |
| D | 2689 | 138 | 5.132019% |
Noise dominated data is calculated using 1-second bins in cleaned event files. If a bin has >2000 counts, and if more than 50% of those come from <1% of pixels, then it is considered to be noise-dominated and hence unusable.
| Quadrant | # 1 sec bins | Bins with >0 counts | Bins with >2000 counts | High rate bins dominated by noise | Noise dominated (total time) | Noise dominated (detector-on time) | Marked lightcurve |
|---|---|---|---|---|---|---|---|
| A | 2688 | 2688 | 294 | 294 | 10.94% | 10.94% | 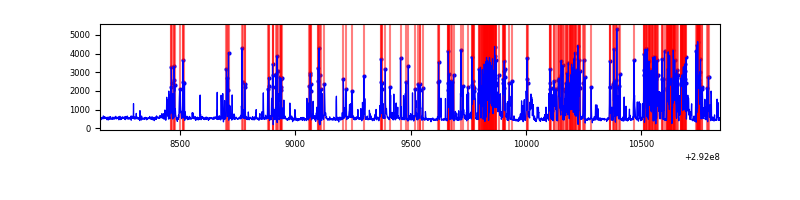 |
| B | 2688 | 2688 | 20 | 20 | 0.74% | 0.74% | 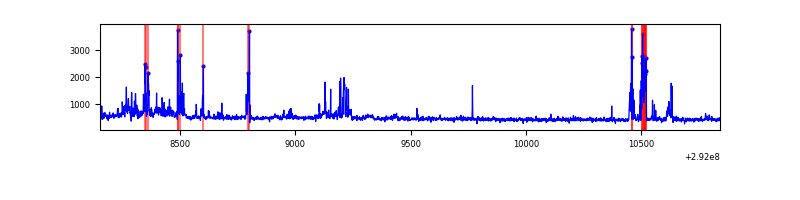 |
| C | 2688 | 2688 | 0 | 0 | 0.00% | 0.00% | 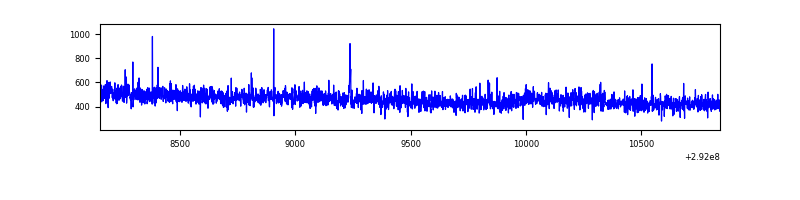 |
| D | 2689 | 2689 | 95 | 95 | 3.53% | 3.53% | 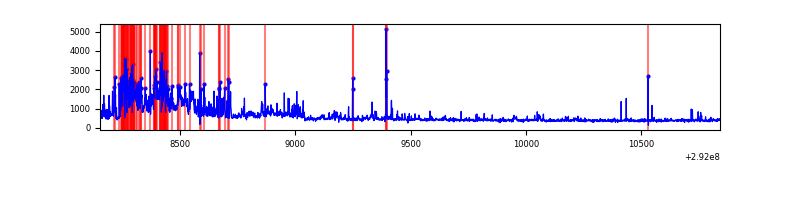 |
Top three noisy pixels from each quadrant. If the there are fewer than three noisy pixels in the level2.evt file, extra rows are filled as -1
| Pixel properties | Quadrant properties | ||||||
|---|---|---|---|---|---|---|---|
| Quadrant | DetID | PixID | Counts | Sigma | Mean | Median | Sigma |
| A | 14 | 235 | 1286813 | 21366.31 | 287 | 281 | 60.2 |
| A | 0 | 13 | 115451 | 1912.71 | 287 | 281 | 60.2 |
| A | 4 | 2 | 10102 | 163.1 | 287 | 281 | 60.2 |
| B | 3 | 112 | 182397 | 2982.39 | 308 | 300 | 61.1 |
| B | 4 | 216 | 30962 | 502.18 | 308 | 300 | 61.1 |
| B | 10 | 245 | 23200 | 375.06 | 308 | 300 | 61.1 |
| C | 14 | 238 | 46389 | 645.3 | 297 | 299 | 71.4 |
| C | 8 | 208 | 17615 | 242.44 | 297 | 299 | 71.4 |
| C | 3 | 233 | 9683 | 131.38 | 297 | 299 | 71.4 |
| D | 7 | 238 | 399409 | 5369.23 | 293 | 284 | 74.3 |
| D | 9 | 68 | 187256 | 2515.24 | 293 | 284 | 74.3 |
| D | 1 | 52 | 56116 | 751.08 | 293 | 284 | 74.3 |
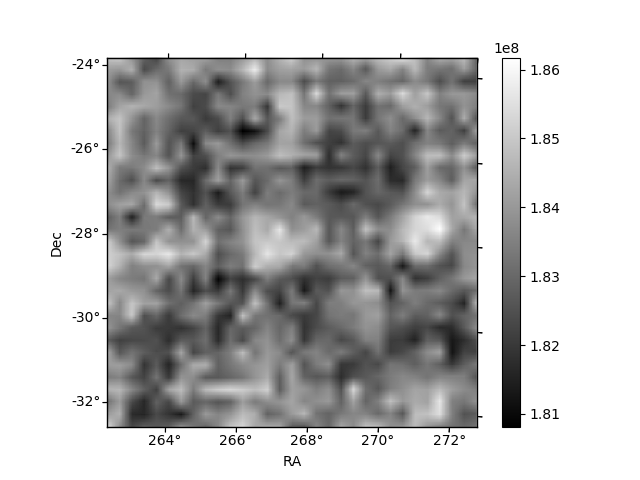
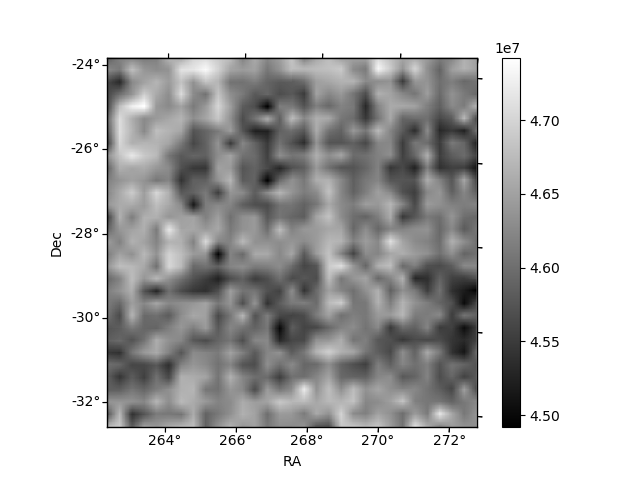
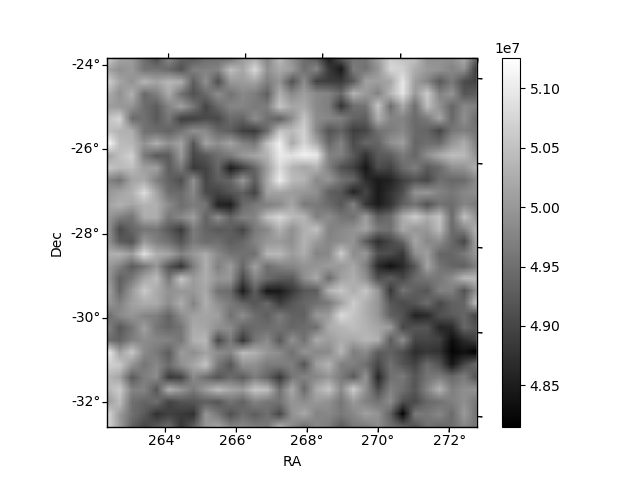
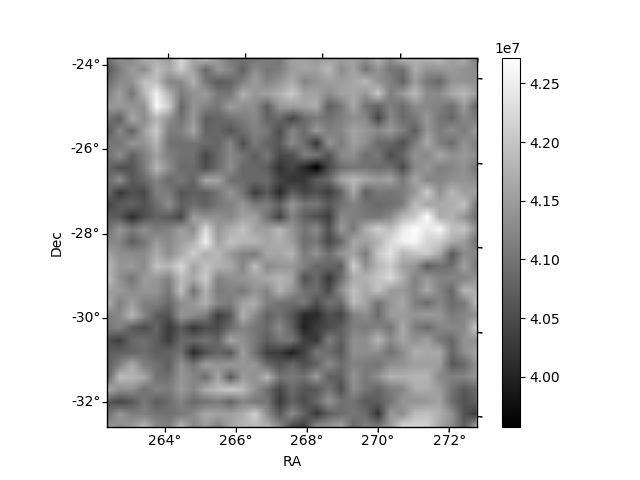
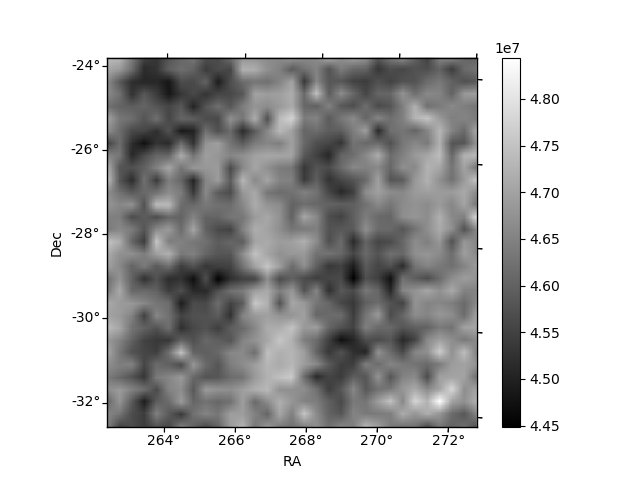
Histogram calculated using DETX and DETY for each event in the final _common_clean file
| Quadrant A | 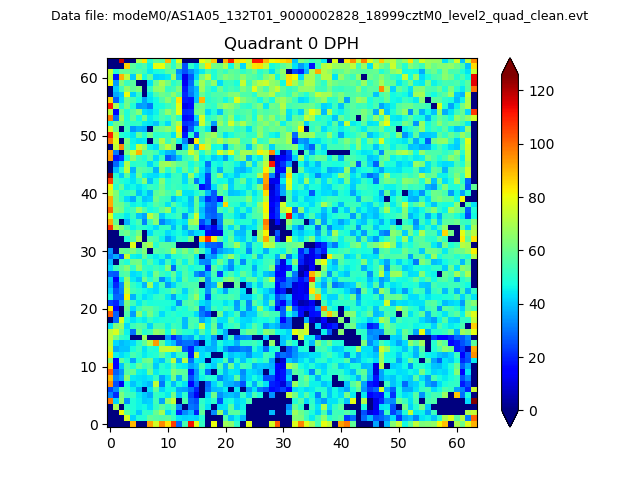 |
 |
Quadrant B |
|---|---|---|---|
| Quadrant D | 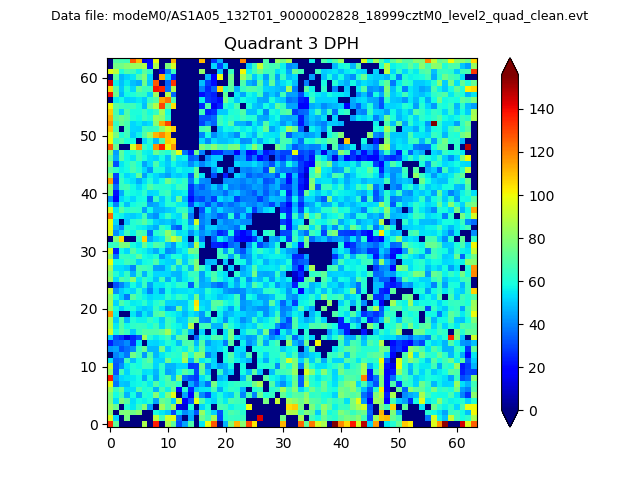 |
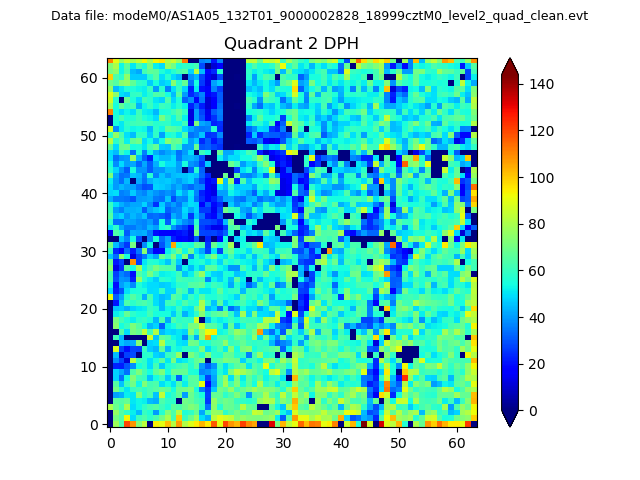 |
Quadrant C |
| Plot type | Count rate plots | Images |
|---|---|---|
| Comparison with Poisson distribution Blue bars denote a histogram of data divided into 1 sec bins. Red curve is a Poisson curve with rate = median count rate of data. |
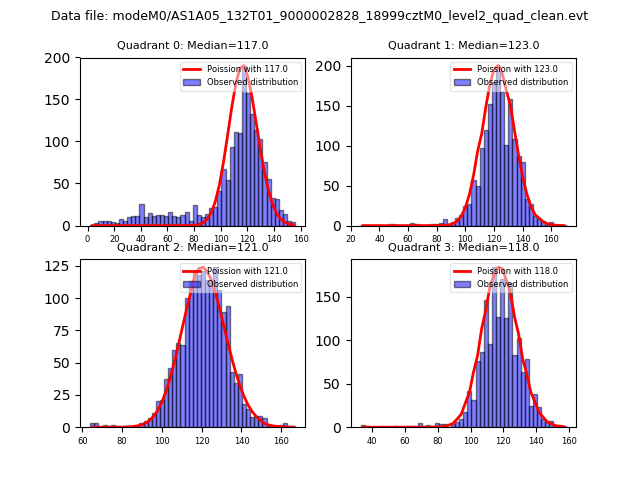 |
 |
| Quadrant-wise count rates Data is divided into 100 sec bins |
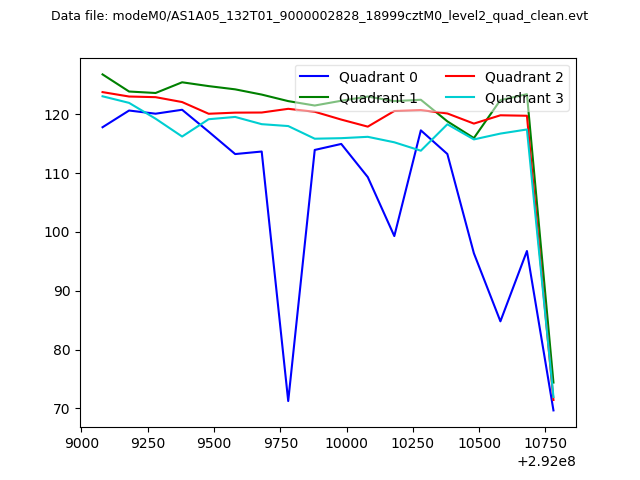 |
|
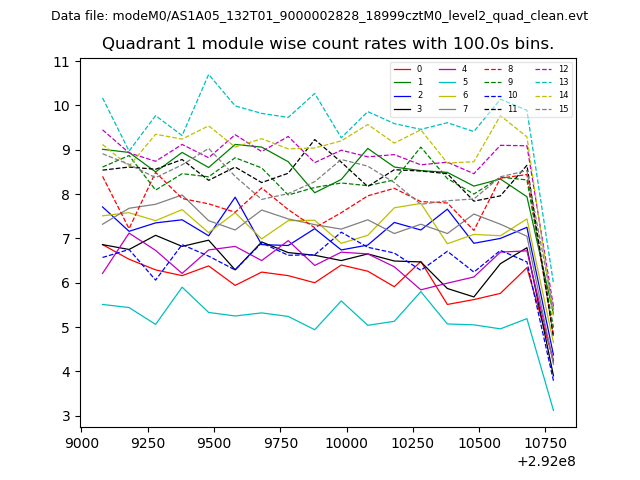
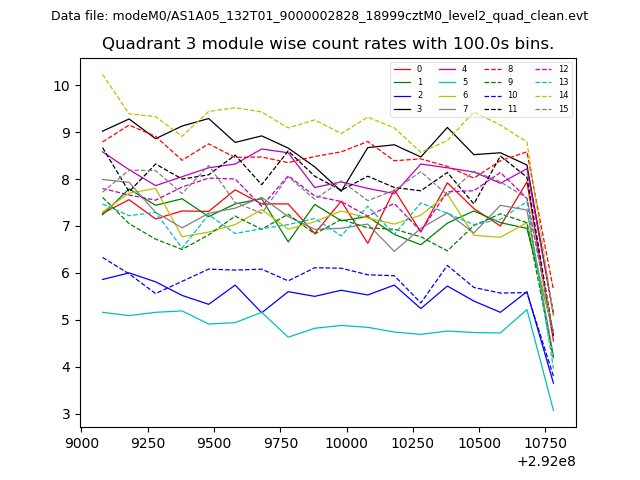
| Module-wise count rates for Quadrant A Data is divided into 100 sec bins |
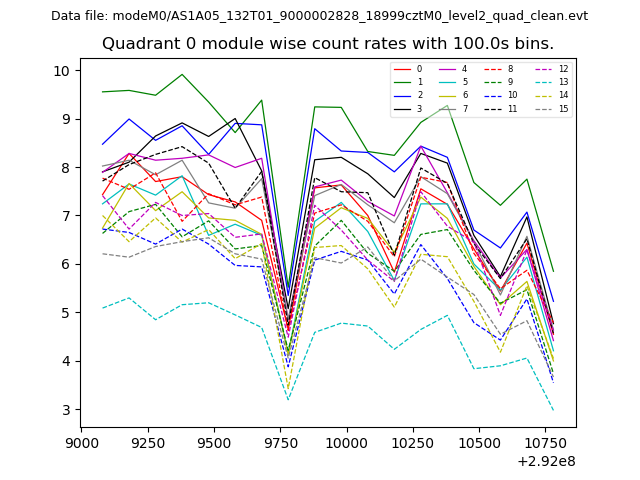 |
 |
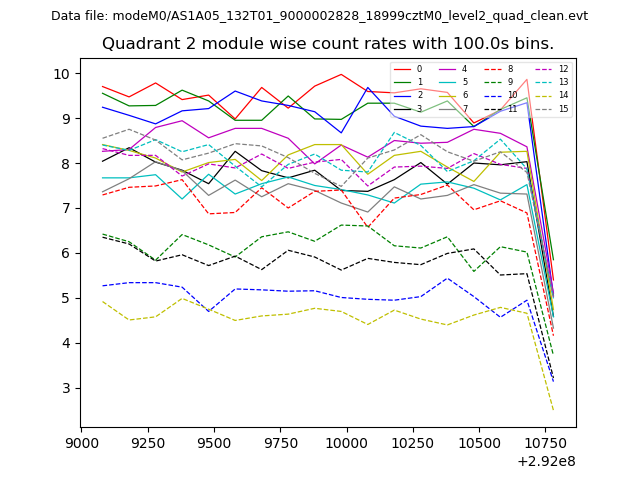
| Module-wise count rates for Quadrant B Data is divided into 100 sec bins |
 |
 |
| Module-wise count rates for Quadrant C Data is divided into 100 sec bins |
 |
 |
| Module-wise count rates for Quadrant D Data is divided into 100 sec bins |
 |
 |
| Parameter | Plot |
|---|---|
| CZT HV Monitor | 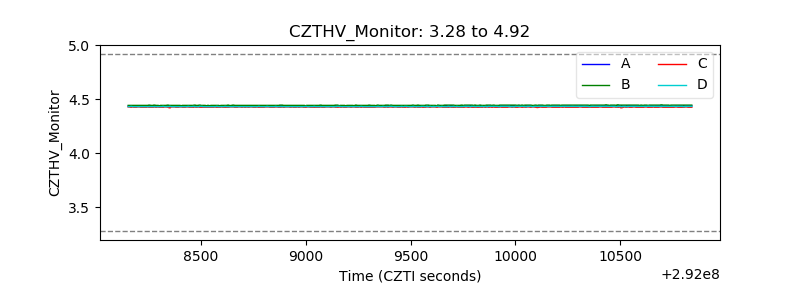 |
| D_VDD | 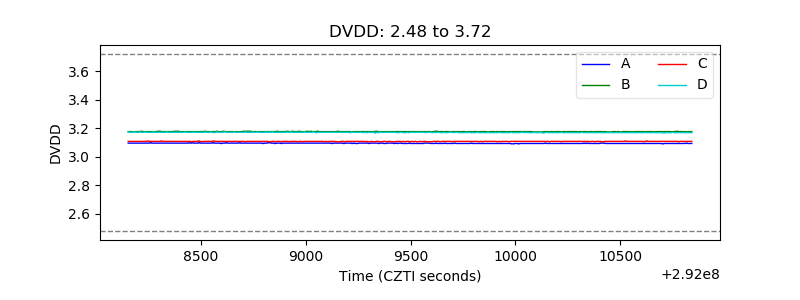 |
| Temperature 1 | 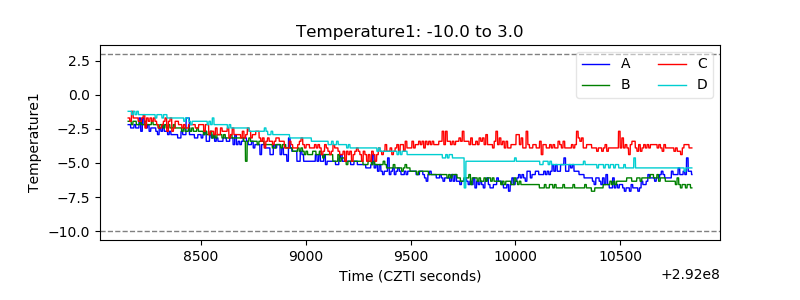 |
| Veto HV Monitor | 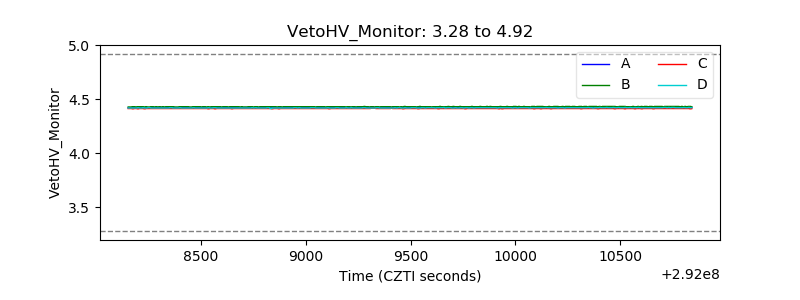 |
| Veto LLD | 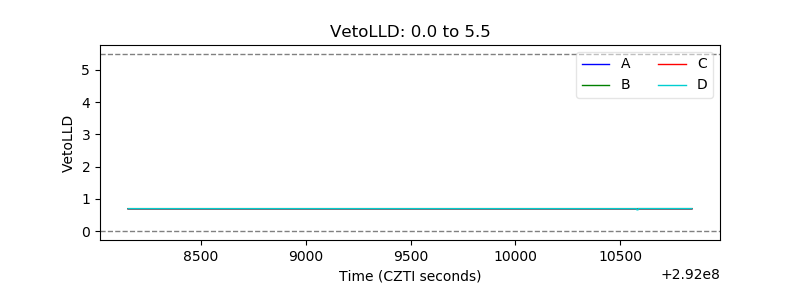 |
| Alpha Counter | 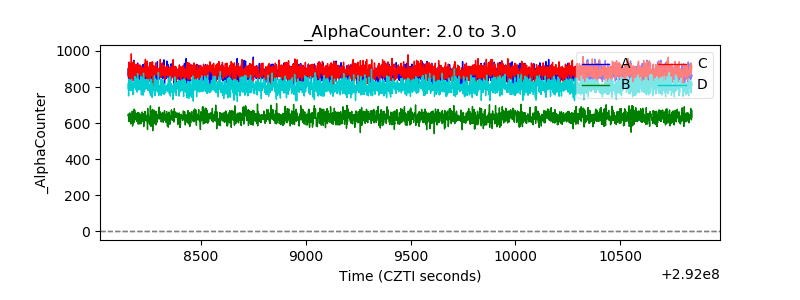 |
| _CPM_Rate | 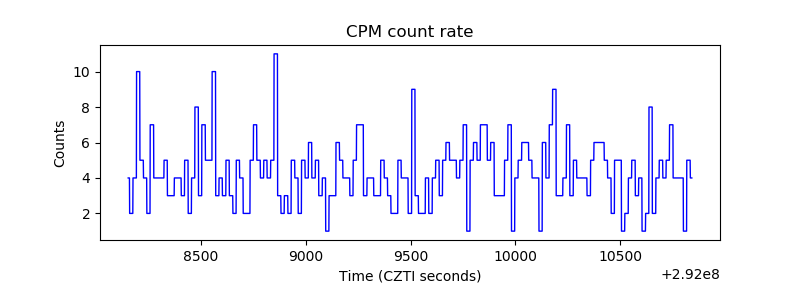 |
| CZT Counter | 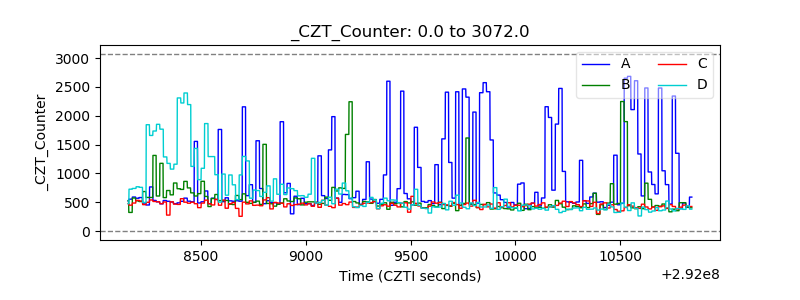 |
| +2.5 Volts monitor | 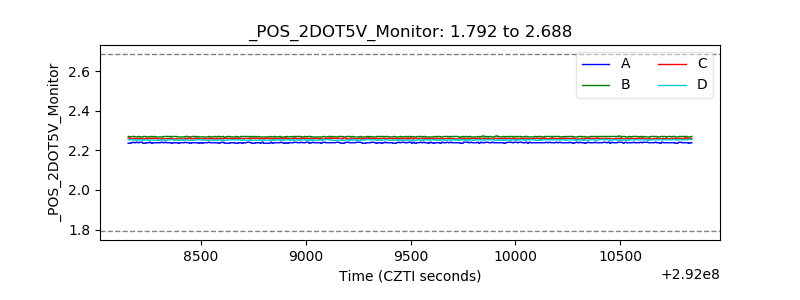 |
| +5 Volts monitor | 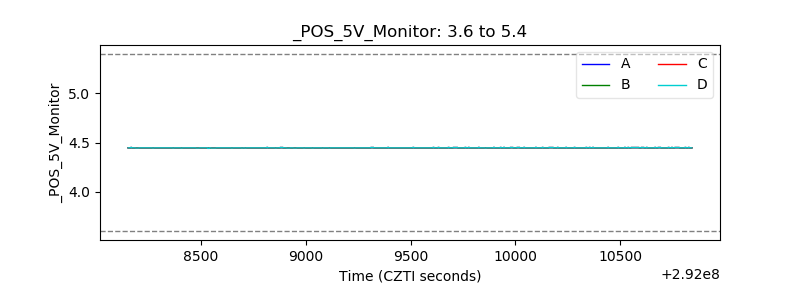 |
| _ROLL_ROT | 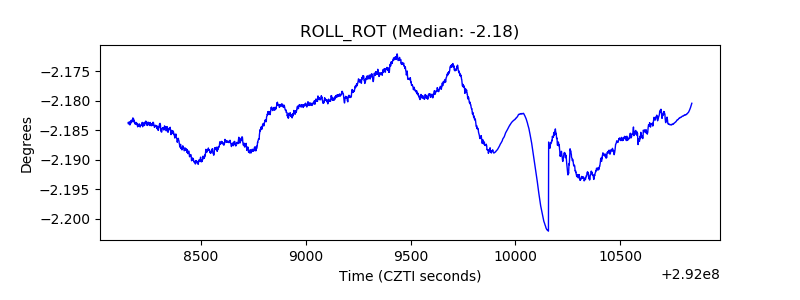 |
| _Roll_DEC |  |
| _Roll_RA | 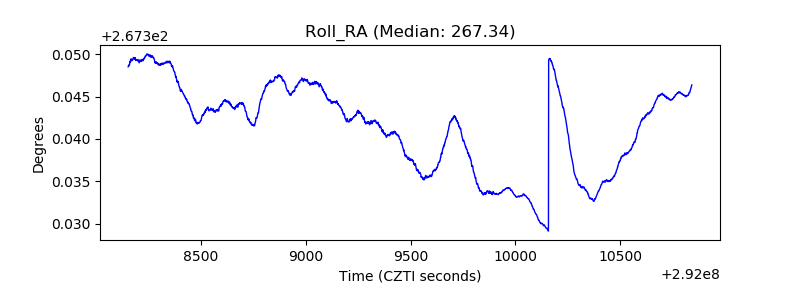 |
| Veto Counter | 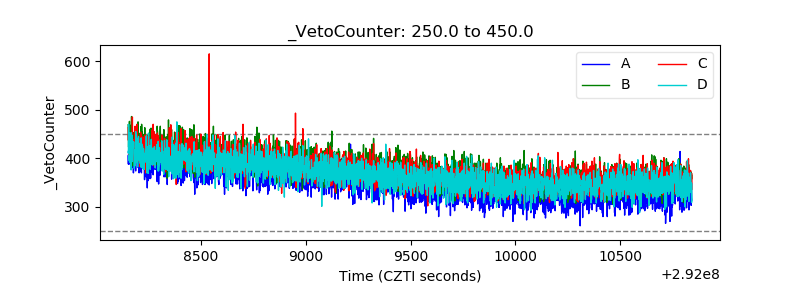 |