| Param | Original file | Final file |
|---|---|---|
| Filename | modeM0/AS1A06_003T05_9000002830cztM0_level2.fits | modeM0/AS1A06_003T05_9000002830cztM0_level2_quad_clean.evt |
| Size (bytes) | 1,289,401,920 | 1,088,948,160 |
| Size | 1.2 GB | 1.0 GB |
| Events in quadrant A | 7,591,798 | 6,003,191 |
| Events in quadrant B | 7,824,352 | 6,450,169 |
| Events in quadrant C | 7,839,642 | 6,078,316 |
| Events in quadrant D | 6,575,180 | 5,237,790 |
| Mode M9 | |||
|---|---|---|---|
| Quadrant | BADHDUFLAG | Total packets | Discarded packets |
| A | 0 | 214 | 0 |
| B | 0 | 214 | 0 |
| C | 0 | 214 | 0 |
| D | 0 | 214 | 0 |
| Mode SS | |||
|---|---|---|---|
| Quadrant | BADHDUFLAG | Total packets | Discarded packets |
| A | 0 | 2732 | 0 |
| B | 0 | 2732 | 0 |
| C | 0 | 2732 | 0 |
| D | 0 | 2732 | 0 |
| Mode M0 | |||
|---|---|---|---|
| Quadrant | BADHDUFLAG | Total packets | Discarded packets |
| A | 0 | 396602 | 0 |
| B | 0 | 296548 | 0 |
| C | 0 | 287252 | 0 |
| D | 0 | 393715 | 0 |
| Quadrant | Total seconds | Saturated seconds | Saturation percentage |
|---|---|---|---|
| A | 134363 | 16784 | 12.491534% |
| B | 134365 | 3328 | 2.476835% |
| C | 134365 | 2899 | 2.157556% |
| D | 134364 | 10451 | 7.778125% |
Noise dominated data is calculated using 1-second bins in cleaned event files. If a bin has >2000 counts, and if more than 50% of those come from <1% of pixels, then it is considered to be noise-dominated and hence unusable.
| Quadrant | # 1 sec bins | Bins with >0 counts | Bins with >2000 counts | High rate bins dominated by noise | Noise dominated (total time) | Noise dominated (detector-on time) | Marked lightcurve |
|---|---|---|---|---|---|---|---|
| A | 155725 | 133722 | 0 | 0 | 0.00% | 0.00% | 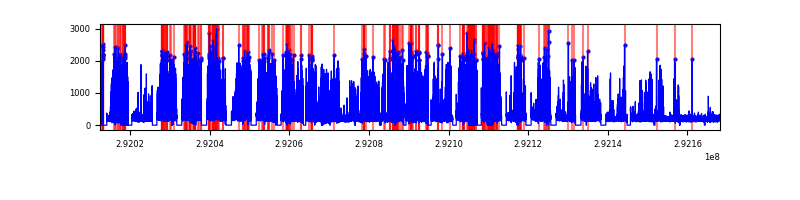 |
| B | 155725 | 134360 | 0 | 0 | 0.00% | 0.00% | 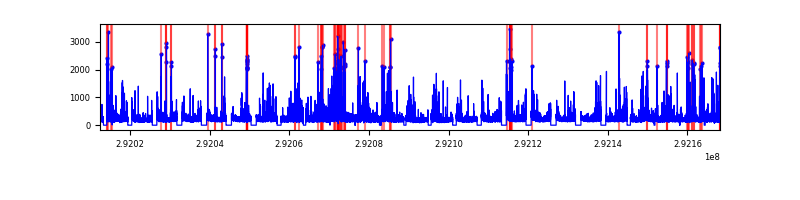 |
| C | 155725 | 134365 | 0 | 0 | 0.00% | 0.00% | 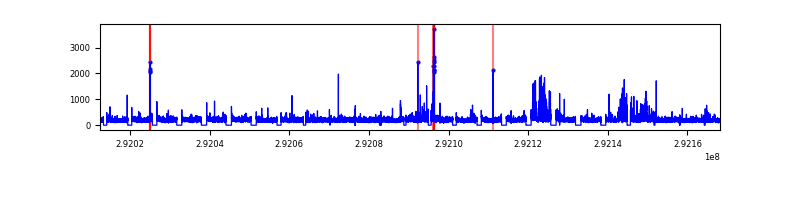 |
| D | 155725 | 133070 | 0 | 0 | 0.00% | 0.00% |  |
Top three noisy pixels from each quadrant. If the there are fewer than three noisy pixels in the level2.evt file, extra rows are filled as -1
| Pixel properties | Quadrant properties | ||||||
|---|---|---|---|---|---|---|---|
| Quadrant | DetID | PixID | Counts | Sigma | Mean | Median | Sigma |
| A | 0 | 29 | 6203 | 9.15 | 1974 | 1854 | 475.4 |
| A | 7 | 110 | 6134 | 9.0 | 1974 | 1854 | 475.4 |
| A | 9 | 19 | 5717 | 8.13 | 1974 | 1854 | 475.4 |
| B | 2 | 9 | 6418 | 11.15 | 2064 | 1967 | 399.3 |
| B | 2 | 8 | 5399 | 8.6 | 2064 | 1967 | 399.3 |
| B | 3 | 17 | 5143 | 7.95 | 2064 | 1967 | 399.3 |
| C | 12 | 241 | 5401 | 6.59 | 2070 | 1928 | 527.4 |
| C | 12 | 250 | 5309 | 6.41 | 2070 | 1928 | 527.4 |
| C | 9 | 209 | 5280 | 6.36 | 2070 | 1928 | 527.4 |
| D | 10 | 190 | 4957 | 6.53 | 1877 | 1708 | 497.7 |
| D | 3 | 14 | 4779 | 6.17 | 1877 | 1708 | 497.7 |
| D | 10 | 189 | 4577 | 5.76 | 1877 | 1708 | 497.7 |
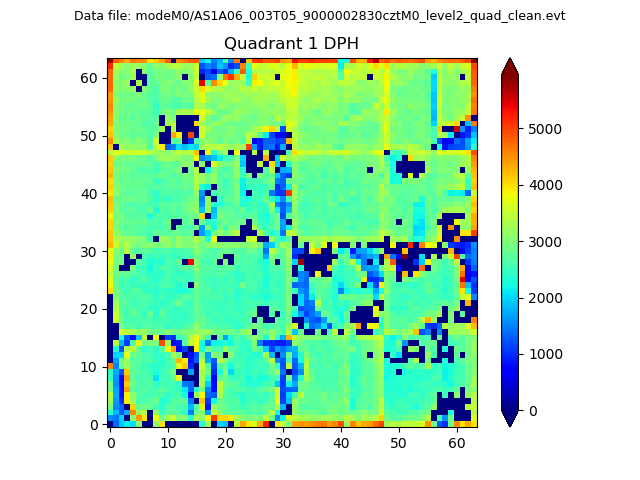
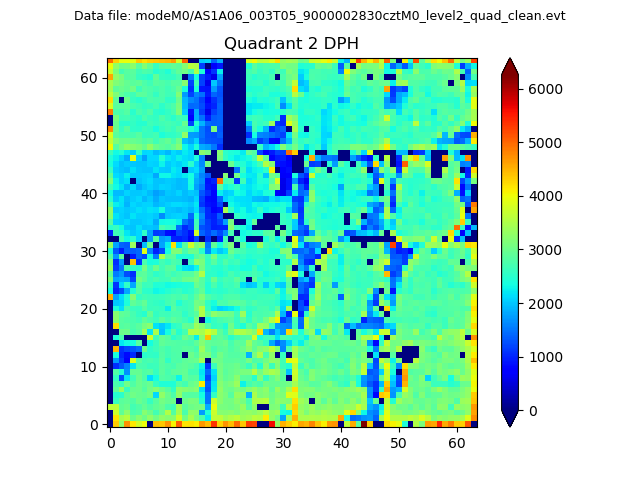
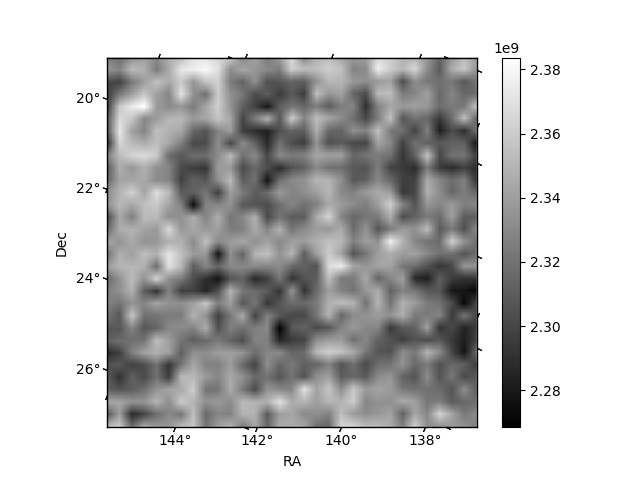
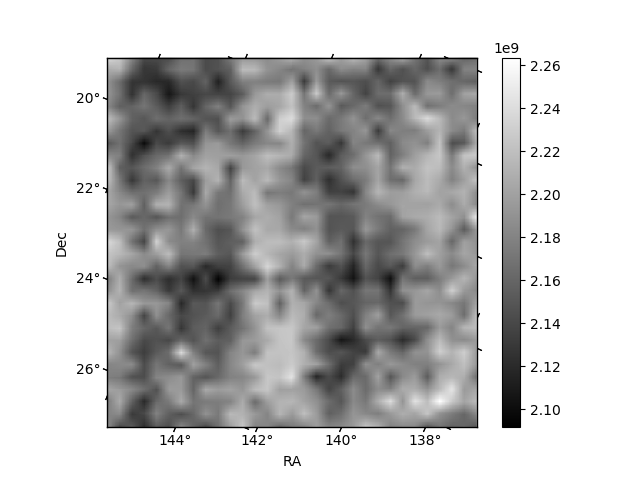
Histogram calculated using DETX and DETY for each event in the final _common_clean file
| Quadrant A | 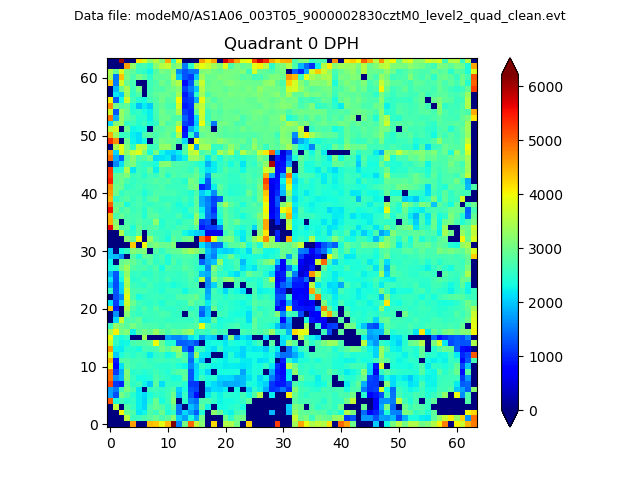 |
 |
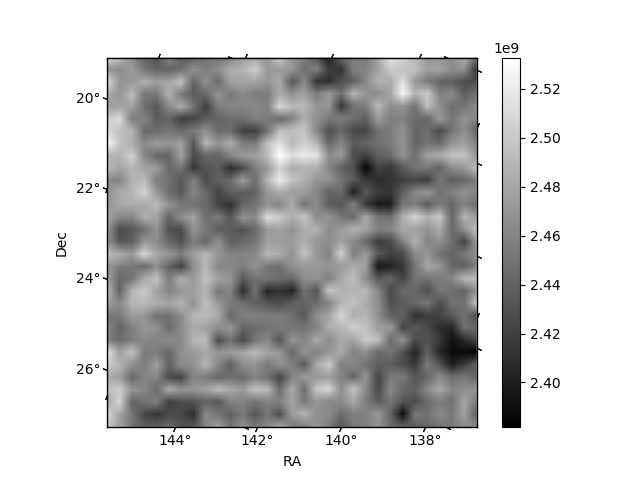
Quadrant B |
|---|---|---|---|
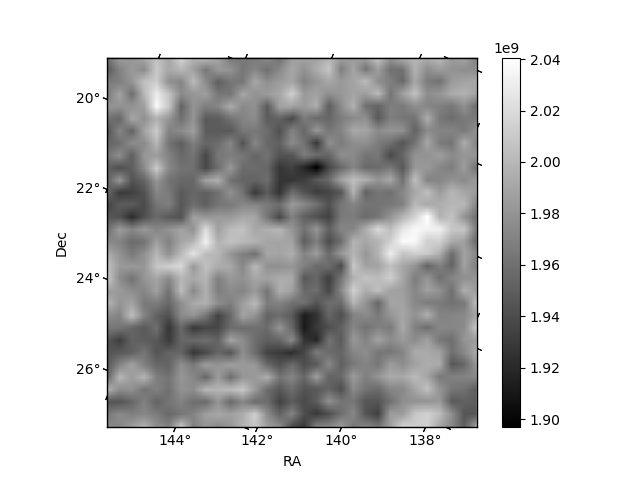
| Quadrant D | 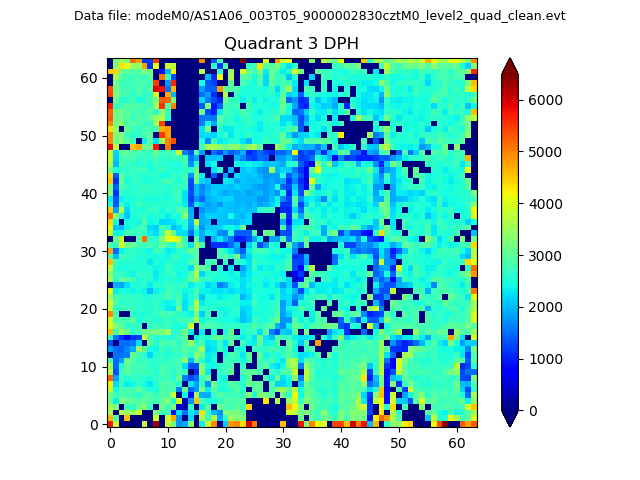 |
 |
Quadrant C |
| Plot type | Count rate plots | Images |
|---|---|---|
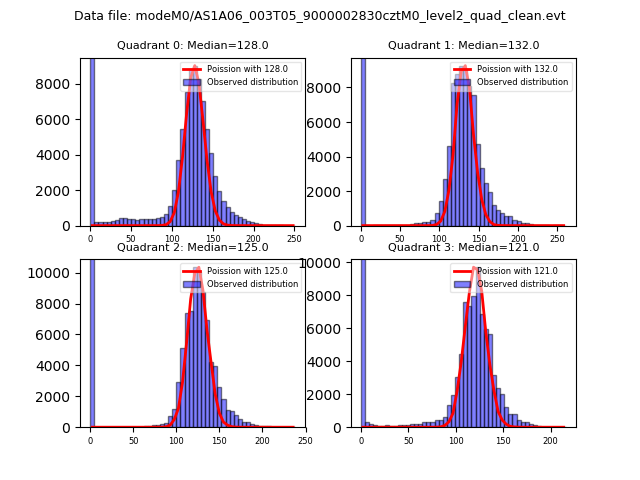
| Comparison with Poisson distribution Blue bars denote a histogram of data divided into 1 sec bins. Red curve is a Poisson curve with rate = median count rate of data. |
 |
 |
| Quadrant-wise count rates Data is divided into 100 sec bins |
 |
|
| Module-wise count rates for Quadrant A Data is divided into 100 sec bins |
 |
 |
| Module-wise count rates for Quadrant B Data is divided into 100 sec bins |
 |
 |
| Module-wise count rates for Quadrant C Data is divided into 100 sec bins |
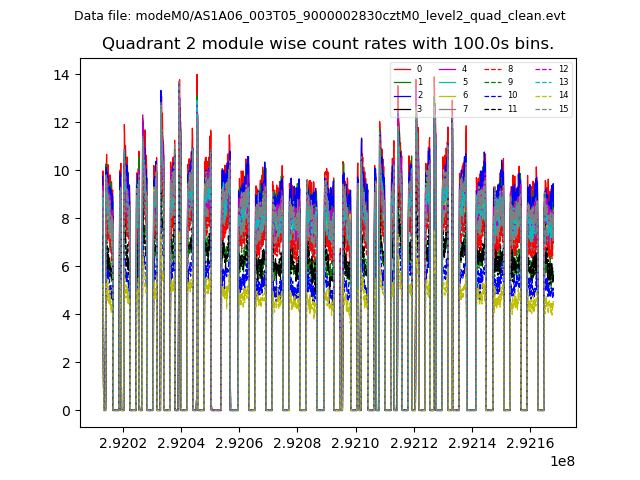 |
 |
| Module-wise count rates for Quadrant D Data is divided into 100 sec bins |
 |
 |
| Parameter | Plot |
|---|---|
| CZT HV Monitor |  |
| D_VDD | 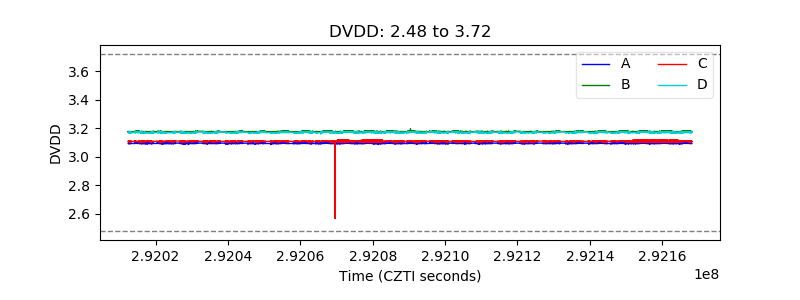 |
| Temperature 1 | 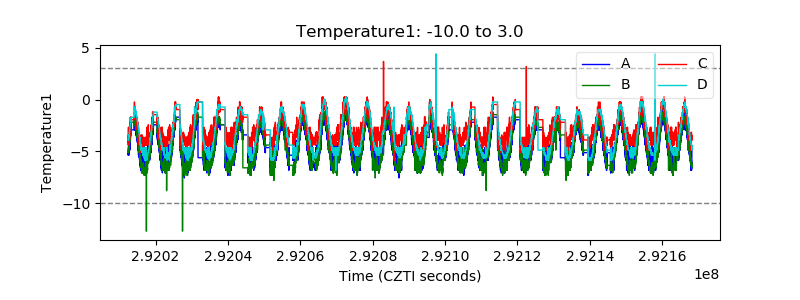 |
| Veto HV Monitor | 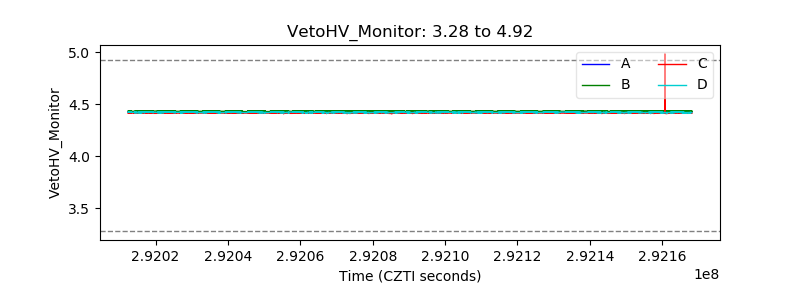 |
| Veto LLD | 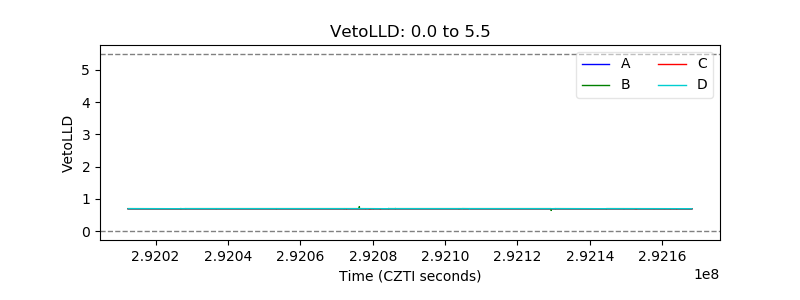 |
| Alpha Counter | 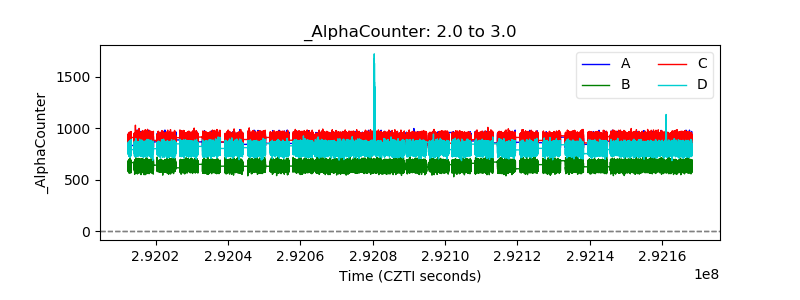 |
| _CPM_Rate | 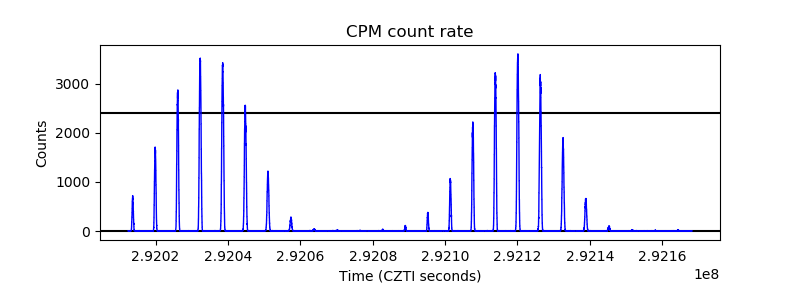 |
| CZT Counter | 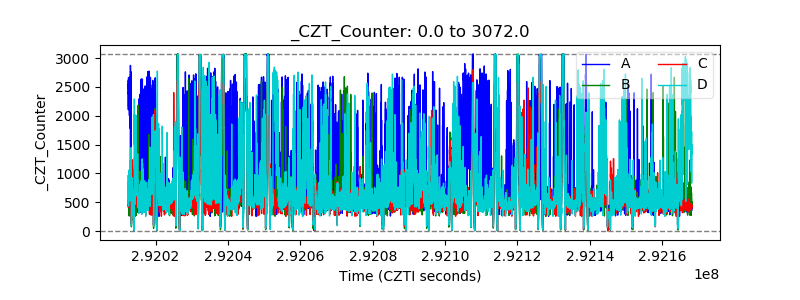 |
| +2.5 Volts monitor |  |
| +5 Volts monitor | 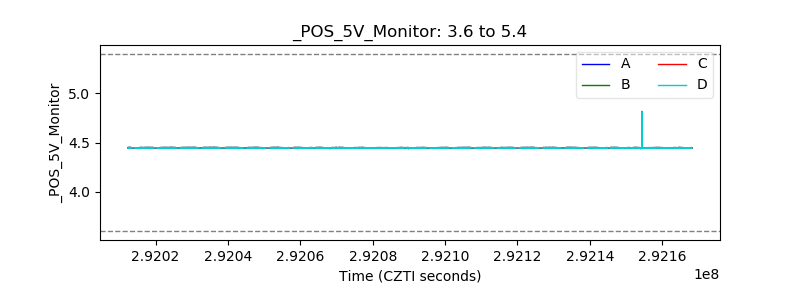 |
| _ROLL_ROT | 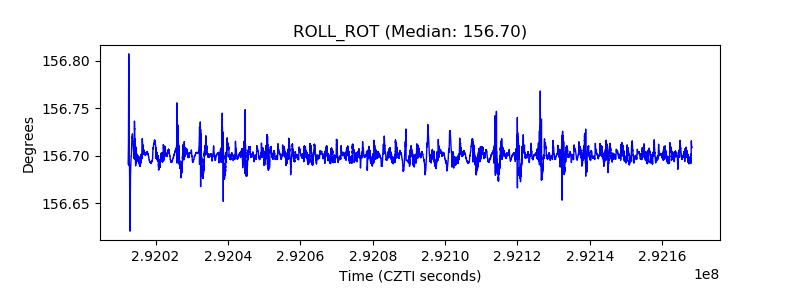 |
| _Roll_DEC | 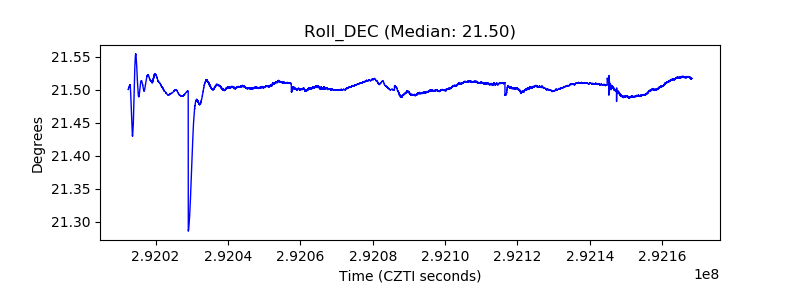 |
| _Roll_RA | 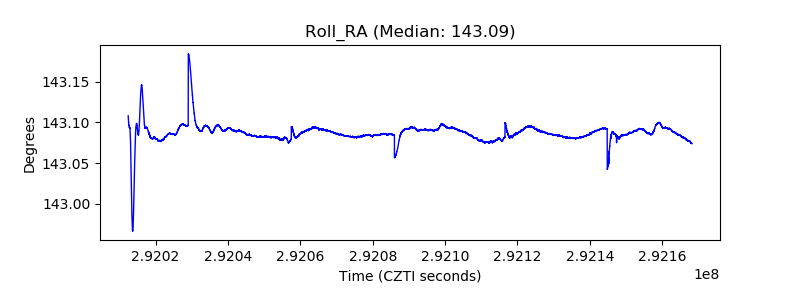 |
| Veto Counter |  |