| Param | Original file | Final file |
|---|---|---|
| Filename | modeM0/AS1A06_003T05_9000002830_18999cztM0_level2.evt | modeM0/AS1A06_003T05_9000002830_18999cztM0_level2_quad_clean.evt |
| Size (bytes) | 235,955,520 | 34,966,080 |
| Size | 225.0 MB | 33.3 MB |
| Events in quadrant A | 2,727,738 | 205,713 |
| Events in quadrant B | 1,340,294 | 235,292 |
| Events in quadrant C | 1,228,625 | 228,076 |
| Events in quadrant D | 1,690,035 | 222,134 |
| Mode M9 | |||
|---|---|---|---|
| Quadrant | BADHDUFLAG | Total packets | Discarded packets |
| A | 0 | 8 | 0 |
| B | 0 | 8 | 0 |
| C | 0 | 8 | 0 |
| D | 0 | 8 | 0 |
| Mode SS | |||
|---|---|---|---|
| Quadrant | BADHDUFLAG | Total packets | Discarded packets |
| A | 0 | 50 | 0 |
| B | 0 | 50 | 0 |
| C | 0 | 50 | 0 |
| D | 0 | 50 | 0 |
| Mode M0 | |||
|---|---|---|---|
| Quadrant | BADHDUFLAG | Total packets | Discarded packets |
| A | 0 | 9580 | 1 |
| B | 0 | 5343 | 1 |
| C | 0 | 5016 | 1 |
| D | 0 | 6689 | 1 |
| Quadrant | Total seconds | Saturated seconds | Saturation percentage |
|---|---|---|---|
| A | 2310 | 816 | 35.324675% |
| B | 2310 | 90 | 3.896104% |
| C | 2310 | 52 | 2.251082% |
| D | 2310 | 78 | 3.376623% |
Noise dominated data is calculated using 1-second bins in cleaned event files. If a bin has >2000 counts, and if more than 50% of those come from <1% of pixels, then it is considered to be noise-dominated and hence unusable.
| Quadrant | # 1 sec bins | Bins with >0 counts | Bins with >2000 counts | High rate bins dominated by noise | Noise dominated (total time) | Noise dominated (detector-on time) | Marked lightcurve |
|---|---|---|---|---|---|---|---|
| A | 3150 | 2310 | 666 | 666 | 21.14% | 28.83% | 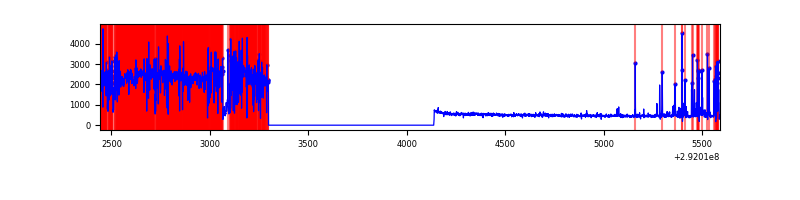 |
| B | 3150 | 2311 | 21 | 21 | 0.67% | 0.91% | 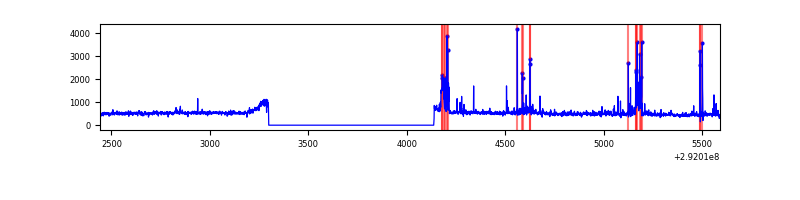 |
| C | 3150 | 2311 | 0 | 0 | 0.00% | 0.00% | 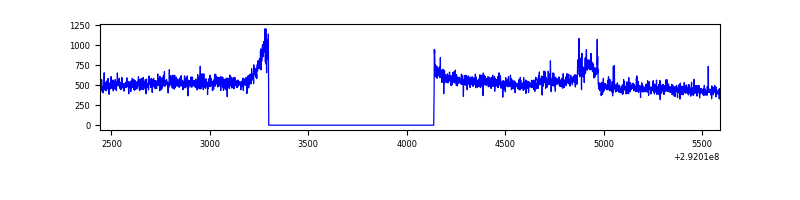 |
| D | 3150 | 2311 | 16 | 16 | 0.51% | 0.69% | 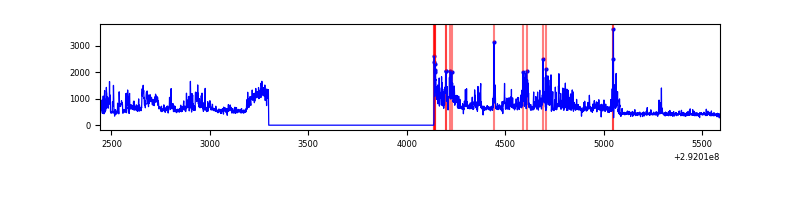 |
Top three noisy pixels from each quadrant. If the there are fewer than three noisy pixels in the level2.evt file, extra rows are filled as -1
| Pixel properties | Quadrant properties | ||||||
|---|---|---|---|---|---|---|---|
| Quadrant | DetID | PixID | Counts | Sigma | Mean | Median | Sigma |
| A | 14 | 235 | 1880008 | 41398.09 | 217 | 213 | 45.4 |
| A | 9 | 143 | 5923 | 125.75 | 217 | 213 | 45.4 |
| A | 4 | 2 | 1904 | 37.24 | 217 | 213 | 45.4 |
| B | 3 | 112 | 86964 | 1437.84 | 299 | 291 | 60.3 |
| B | 0 | 197 | 24502 | 401.64 | 299 | 291 | 60.3 |
| B | 0 | 190 | 23986 | 393.08 | 299 | 291 | 60.3 |
| C | 14 | 238 | 44735 | 641.82 | 290 | 291 | 69.2 |
| C | 9 | 54 | 35699 | 511.33 | 290 | 291 | 69.2 |
| C | 3 | 233 | 14967 | 211.94 | 290 | 291 | 69.2 |
| D | 7 | 238 | 511415 | 6991.26 | 295 | 287 | 73.1 |
| D | 9 | 1 | 47590 | 647.01 | 295 | 287 | 73.1 |
| D | 2 | 234 | 10316 | 137.18 | 295 | 287 | 73.1 |
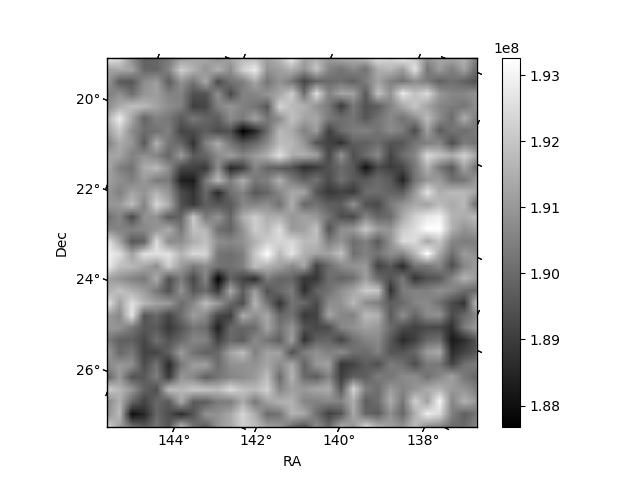
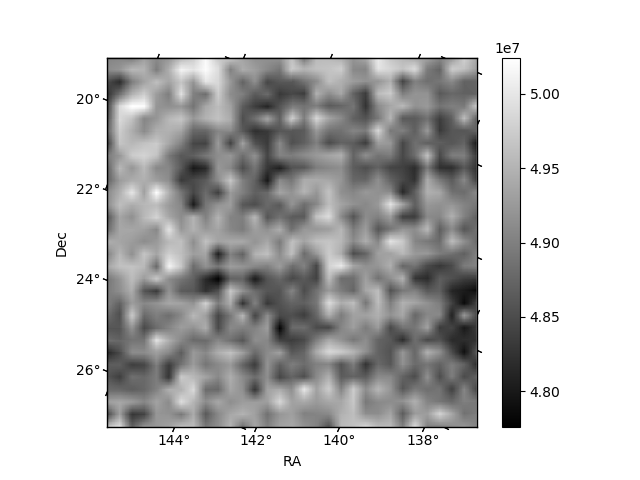
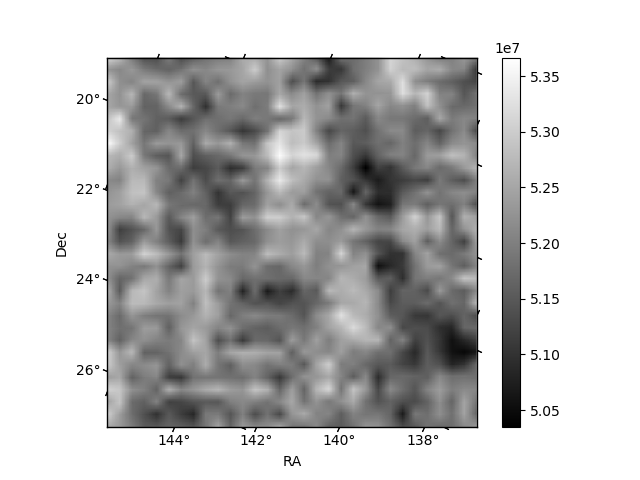
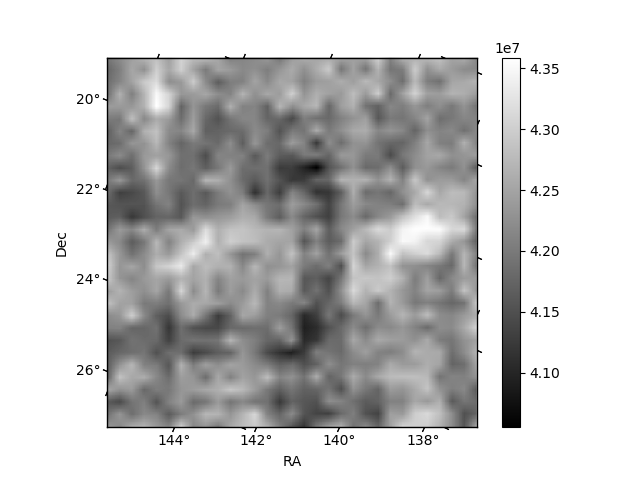
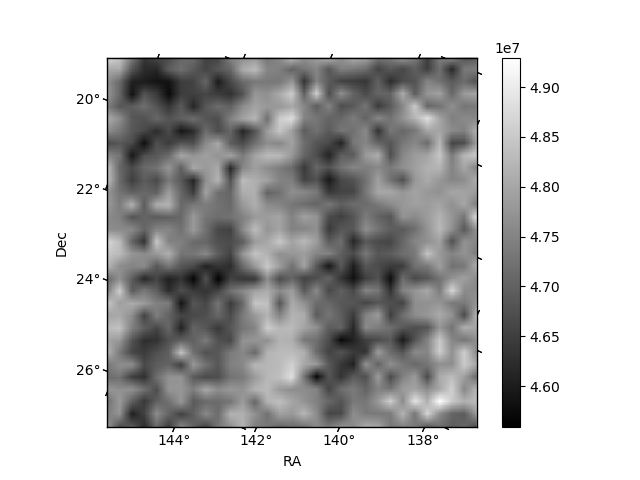
Histogram calculated using DETX and DETY for each event in the final _common_clean file
| Quadrant A | 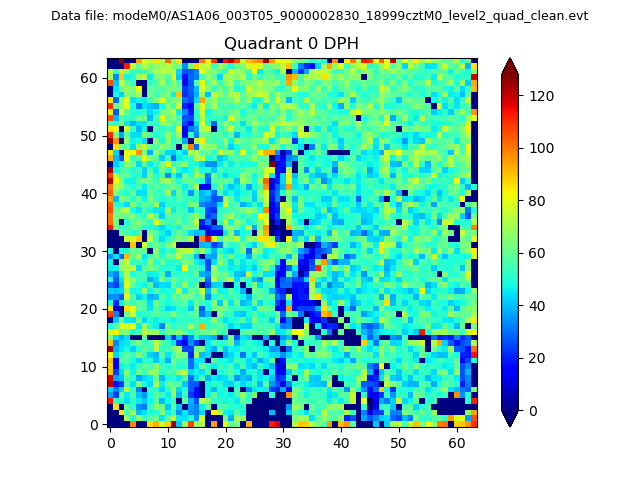 |
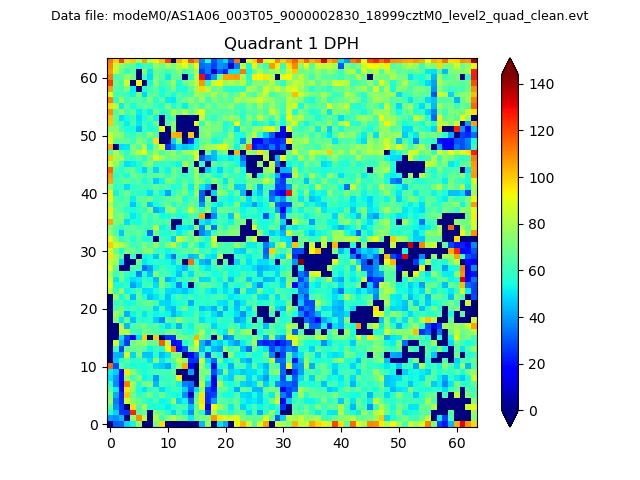 |
Quadrant B |
|---|---|---|---|
| Quadrant D | 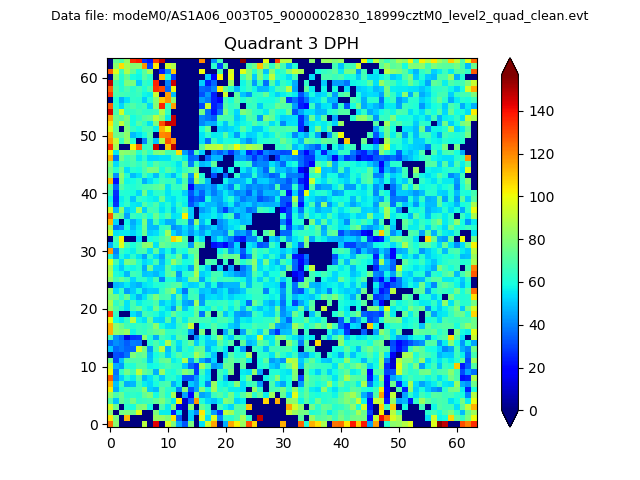 |
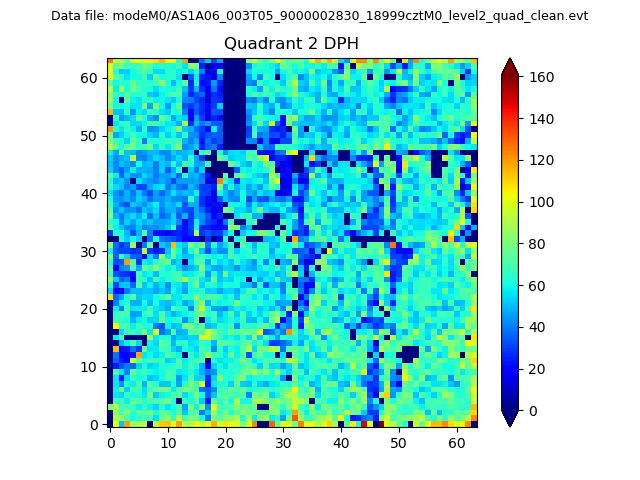 |
Quadrant C |
| Plot type | Count rate plots | Images |
|---|---|---|
| Comparison with Poisson distribution Blue bars denote a histogram of data divided into 1 sec bins. Red curve is a Poisson curve with rate = median count rate of data. |
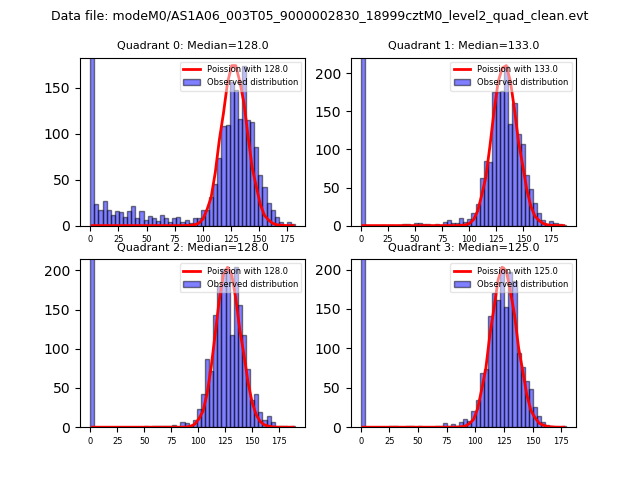 |
 |
| Quadrant-wise count rates Data is divided into 100 sec bins |
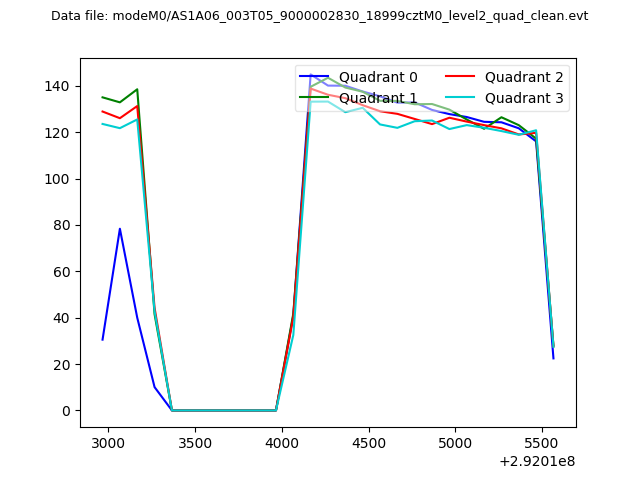 |
|
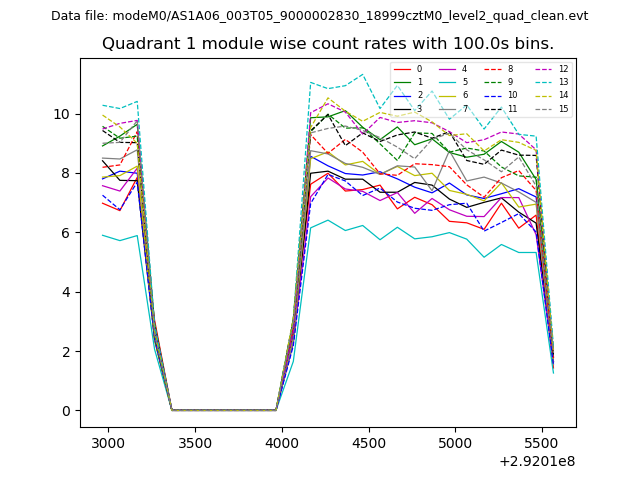
| Module-wise count rates for Quadrant A Data is divided into 100 sec bins |
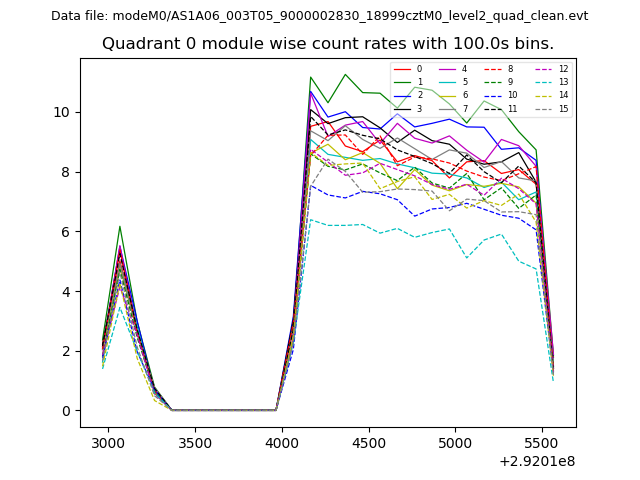 |
 |
| Module-wise count rates for Quadrant B Data is divided into 100 sec bins |
 |
 |
| Module-wise count rates for Quadrant C Data is divided into 100 sec bins |
 |
 |
| Module-wise count rates for Quadrant D Data is divided into 100 sec bins |
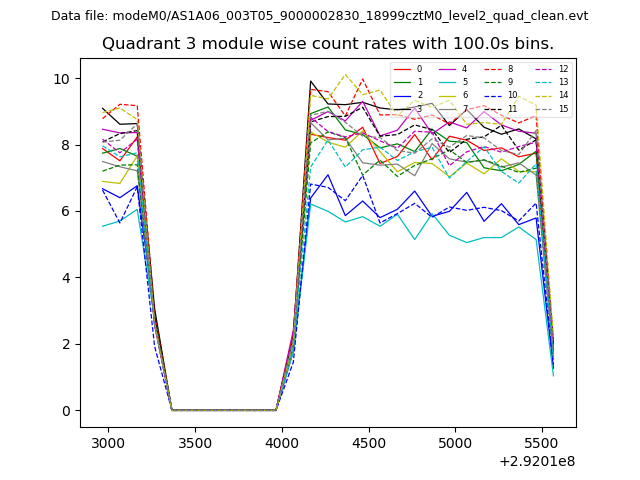 |
 |
| Parameter | Plot |
|---|---|
| CZT HV Monitor | 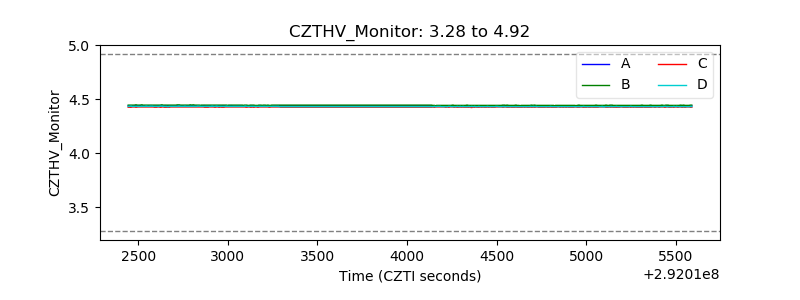 |
| D_VDD | 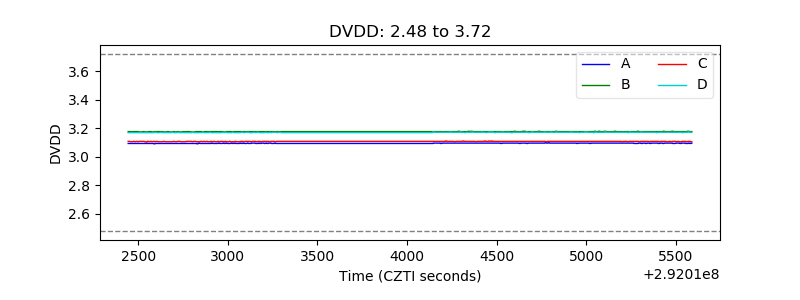 |
| Temperature 1 | 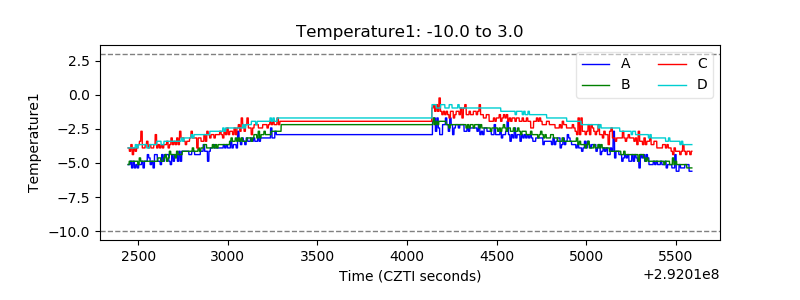 |
| Veto HV Monitor | 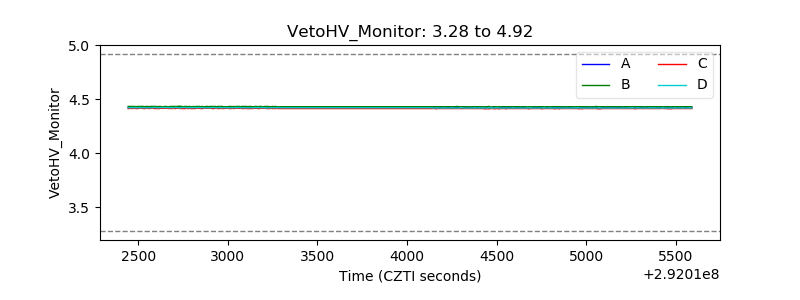 |
| Veto LLD | 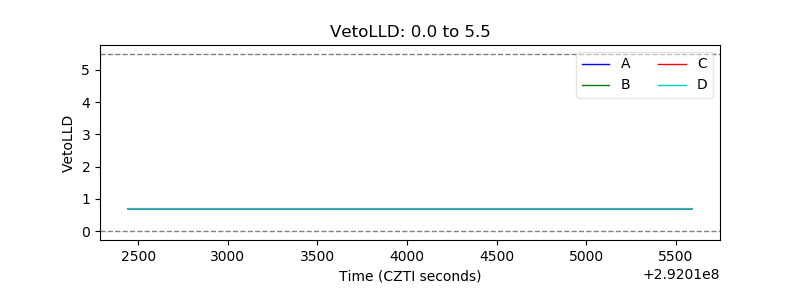 |
| Alpha Counter | 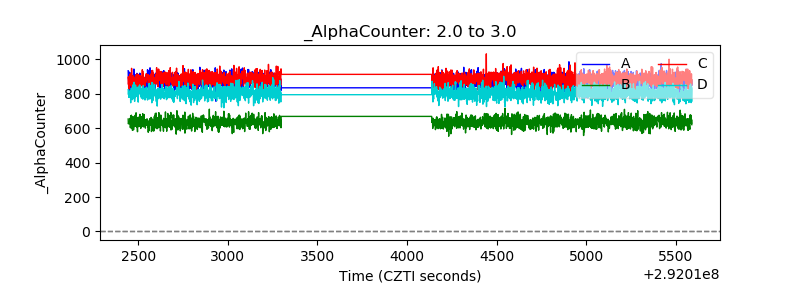 |
| _CPM_Rate | 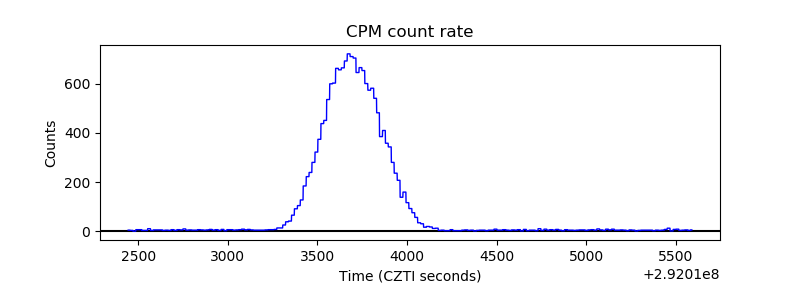 |
| CZT Counter | 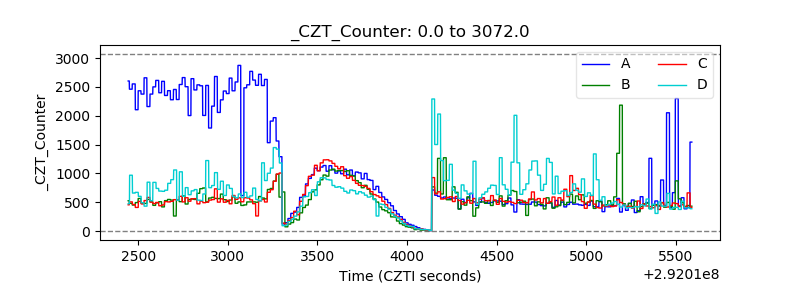 |
| +2.5 Volts monitor |  |
| +5 Volts monitor |  |
| _ROLL_ROT |  |
| _Roll_DEC | 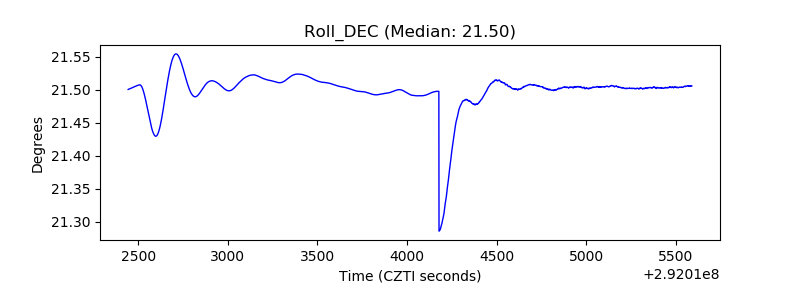 |
| _Roll_RA | 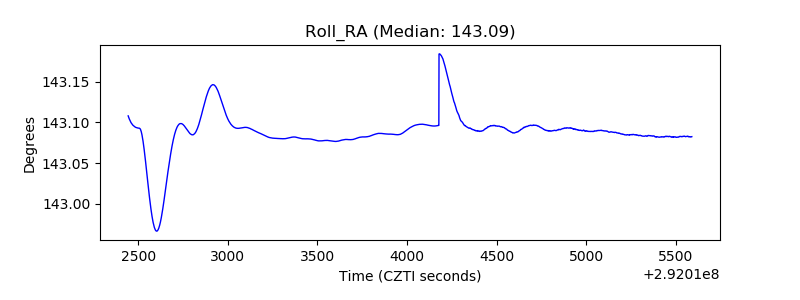 |
| Veto Counter | 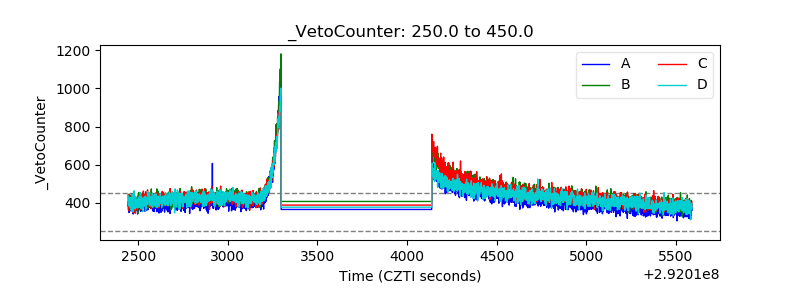 |