| Param | Original file | Final file |
|---|---|---|
| Filename | modeM0/AS1A06_003T05_9000002830_19000cztM0_level2.evt | modeM0/AS1A06_003T05_9000002830_19000cztM0_level2_quad_clean.evt |
| Size (bytes) | 603,351,360 | 87,776,640 |
| Size | 575.4 MB | 83.7 MB |
| Events in quadrant A | 6,807,743 | 527,807 |
| Events in quadrant B | 3,529,966 | 577,864 |
| Events in quadrant C | 3,149,635 | 556,407 |
| Events in quadrant D | 4,339,808 | 537,560 |
| Mode M9 | |||
|---|---|---|---|
| Quadrant | BADHDUFLAG | Total packets | Discarded packets |
| A | 0 | 13 | 0 |
| B | 0 | 14 | 0 |
| C | 0 | 14 | 0 |
| D | 0 | 14 | 0 |
| Mode SS | |||
|---|---|---|---|
| Quadrant | BADHDUFLAG | Total packets | Discarded packets |
| A | 0 | 134 | 0 |
| B | 0 | 134 | 0 |
| C | 0 | 134 | 0 |
| D | 0 | 134 | 0 |
| Mode M0 | |||
|---|---|---|---|
| Quadrant | BADHDUFLAG | Total packets | Discarded packets |
| A | 0 | 24588 | 2 |
| B | 0 | 14620 | 2 |
| C | 0 | 13681 | 2 |
| D | 0 | 17686 | 2 |
| Quadrant | Total seconds | Saturated seconds | Saturation percentage |
|---|---|---|---|
| A | 6568 | 1665 | 25.350183% |
| B | 6568 | 99 | 1.507308% |
| C | 6568 | 48 | 0.730816% |
| D | 6568 | 146 | 2.222899% |
Noise dominated data is calculated using 1-second bins in cleaned event files. If a bin has >2000 counts, and if more than 50% of those come from <1% of pixels, then it is considered to be noise-dominated and hence unusable.
| Quadrant | # 1 sec bins | Bins with >0 counts | Bins with >2000 counts | High rate bins dominated by noise | Noise dominated (total time) | Noise dominated (detector-on time) | Marked lightcurve |
|---|---|---|---|---|---|---|---|
| A | 7563 | 6568 | 1179 | 1179 | 15.59% | 17.95% | 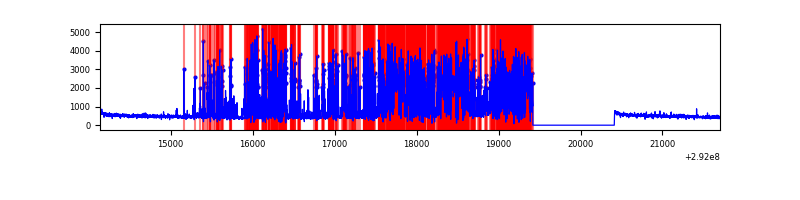 |
| B | 7563 | 6569 | 24 | 24 | 0.32% | 0.37% | 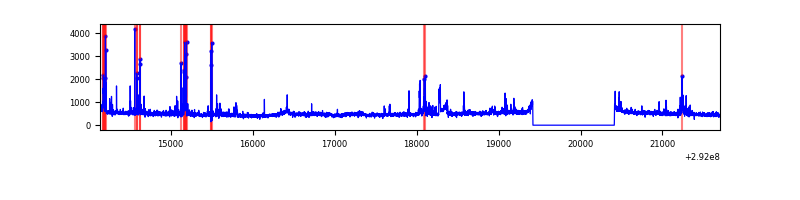 |
| C | 7563 | 6569 | 0 | 0 | 0.00% | 0.00% | 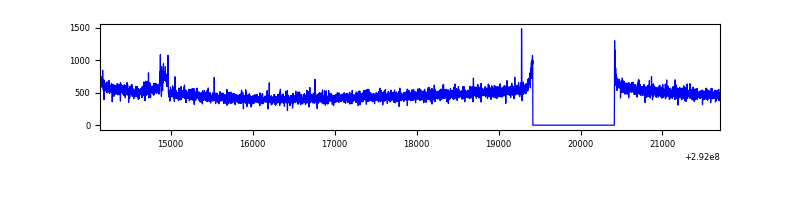 |
| D | 7563 | 6569 | 60 | 60 | 0.79% | 0.91% | 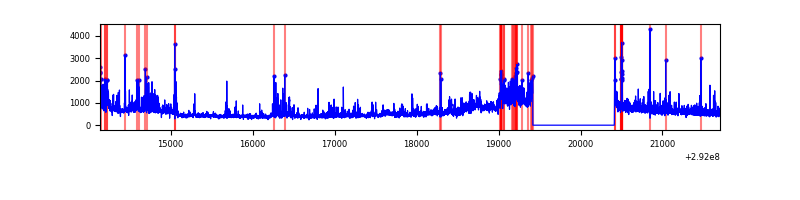 |
Top three noisy pixels from each quadrant. If the there are fewer than three noisy pixels in the level2.evt file, extra rows are filled as -1
| Pixel properties | Quadrant properties | ||||||
|---|---|---|---|---|---|---|---|
| Quadrant | DetID | PixID | Counts | Sigma | Mean | Median | Sigma |
| A | 14 | 235 | 4186812 | 30693.72 | 677 | 663 | 136.4 |
| A | 9 | 143 | 10798 | 74.31 | 677 | 663 | 136.4 |
| A | 0 | 226 | 5936 | 38.66 | 677 | 663 | 136.4 |
| B | 3 | 112 | 317760 | 2090.45 | 786 | 765 | 151.6 |
| B | 0 | 197 | 51930 | 337.41 | 786 | 765 | 151.6 |
| B | 0 | 190 | 31213 | 200.79 | 786 | 765 | 151.6 |
| C | 14 | 238 | 119071 | 666.19 | 759 | 766 | 177.6 |
| C | 9 | 54 | 36143 | 199.21 | 759 | 766 | 177.6 |
| C | 3 | 233 | 30633 | 168.19 | 759 | 766 | 177.6 |
| D | 7 | 238 | 1311701 | 7013.49 | 763 | 741 | 186.9 |
| D | 1 | 52 | 110653 | 588.02 | 763 | 741 | 186.9 |
| D | 2 | 234 | 28120 | 146.47 | 763 | 741 | 186.9 |
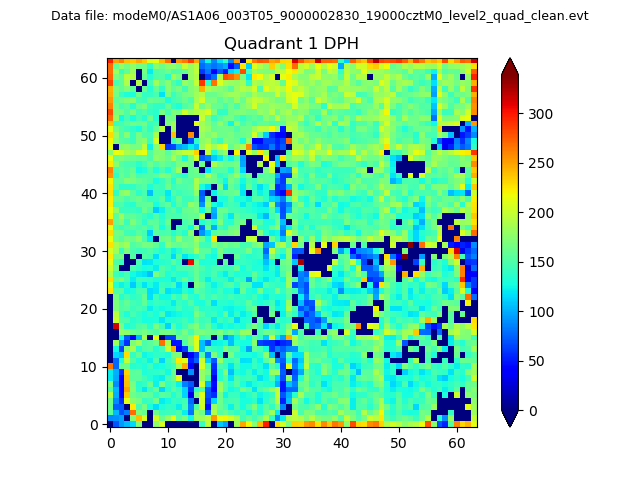
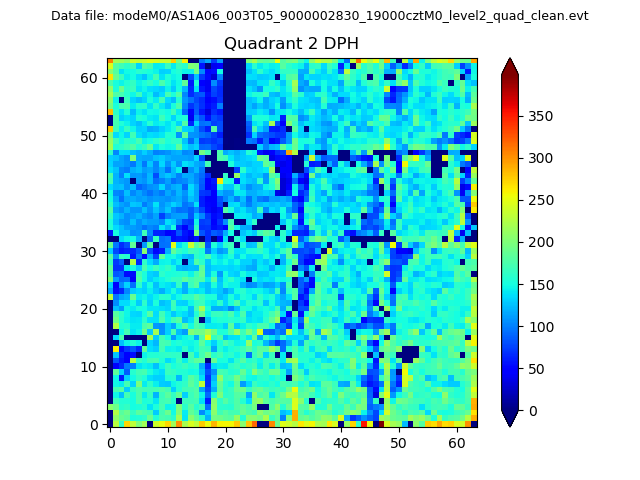
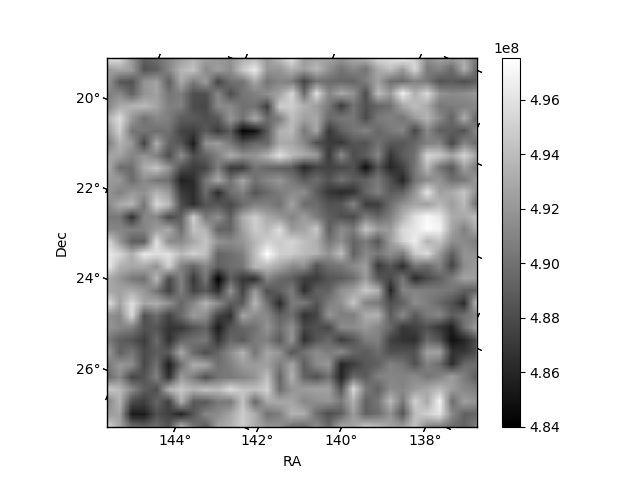
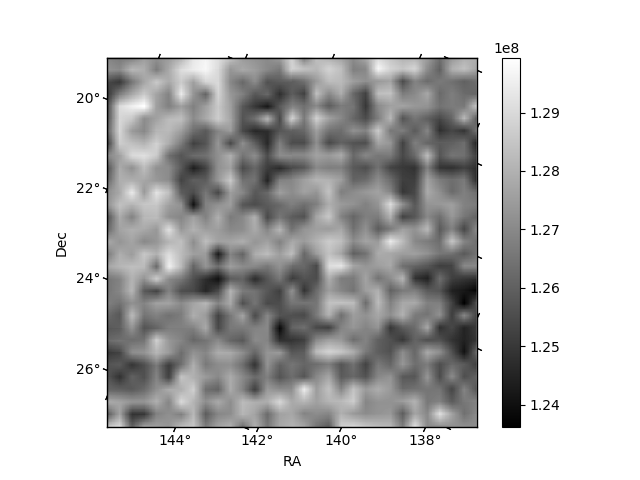
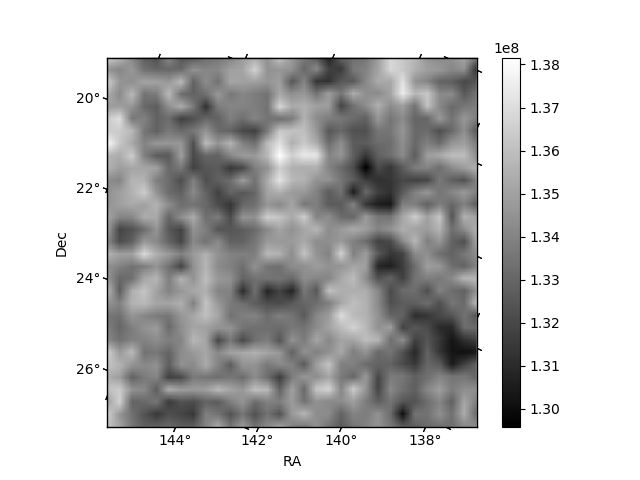
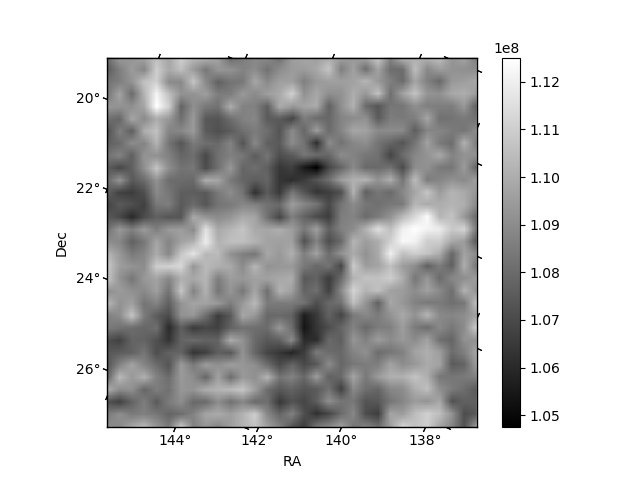
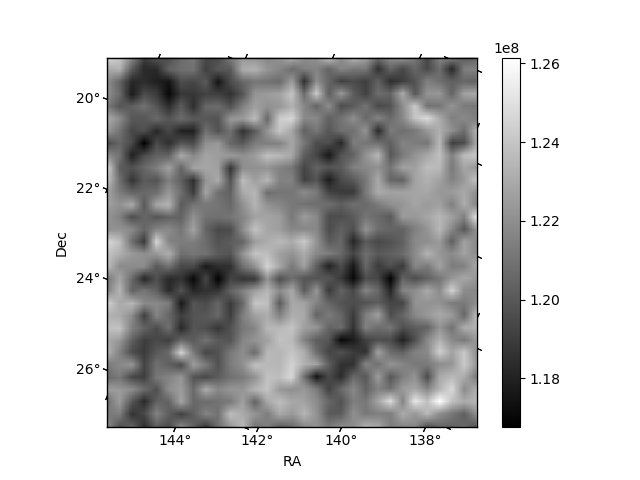
Histogram calculated using DETX and DETY for each event in the final _common_clean file
| Quadrant A |  |
 |
Quadrant B |
|---|---|---|---|
| Quadrant D | 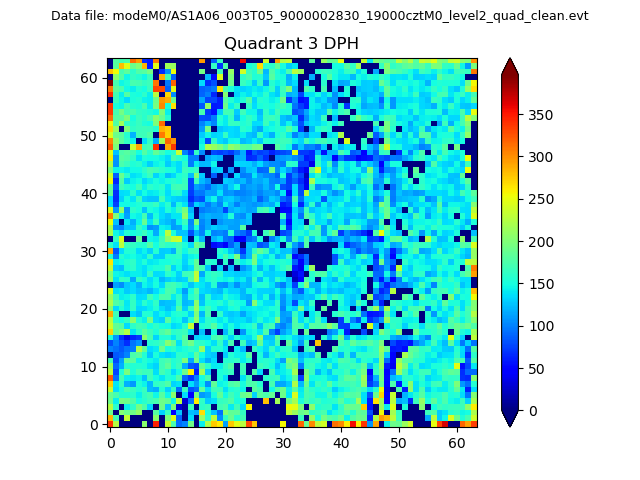 |
 |
Quadrant C |
| Plot type | Count rate plots | Images |
|---|---|---|
| Comparison with Poisson distribution Blue bars denote a histogram of data divided into 1 sec bins. Red curve is a Poisson curve with rate = median count rate of data. |
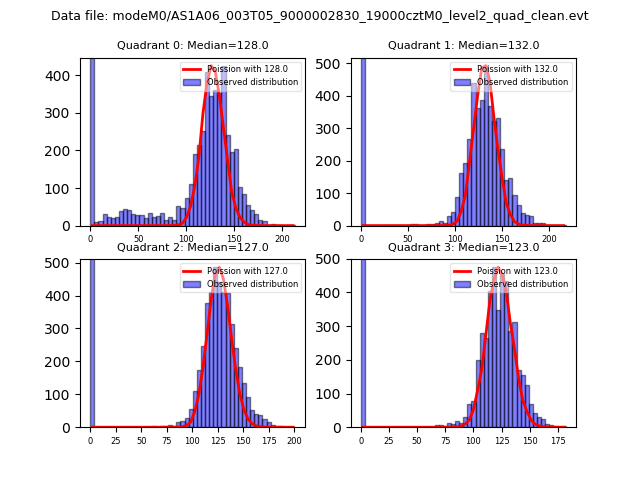 |
 |
| Quadrant-wise count rates Data is divided into 100 sec bins |
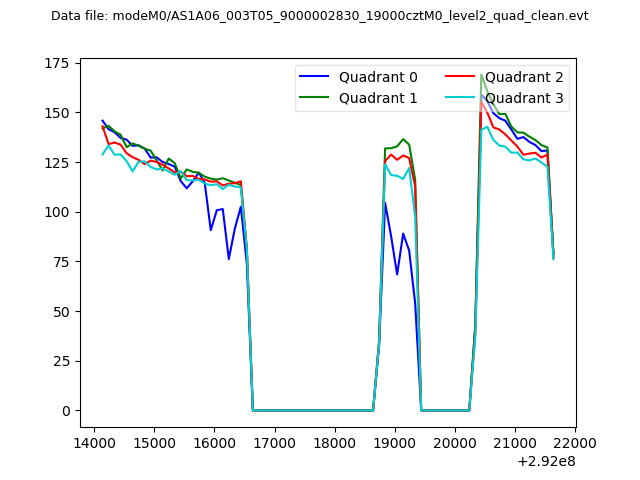 |
|
| Module-wise count rates for Quadrant A Data is divided into 100 sec bins |
 |
 |
| Module-wise count rates for Quadrant B Data is divided into 100 sec bins |
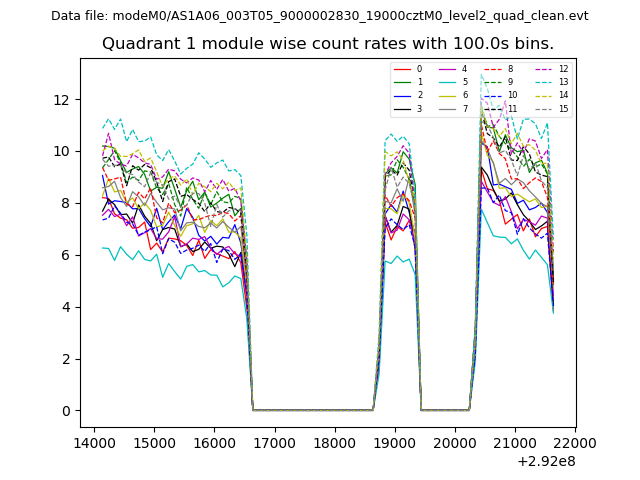 |
 |
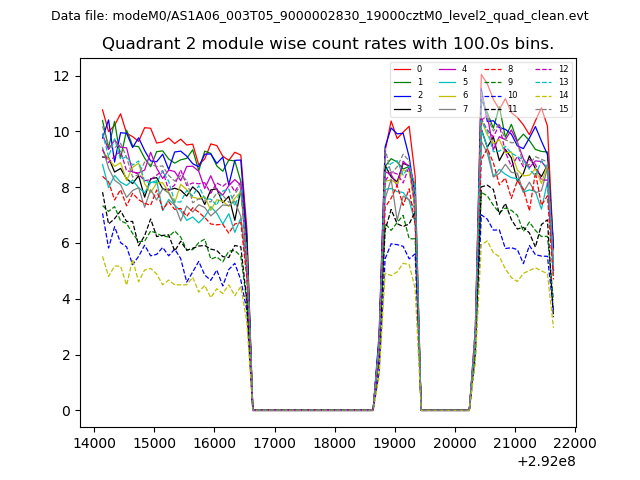
| Module-wise count rates for Quadrant C Data is divided into 100 sec bins |
 |
 |
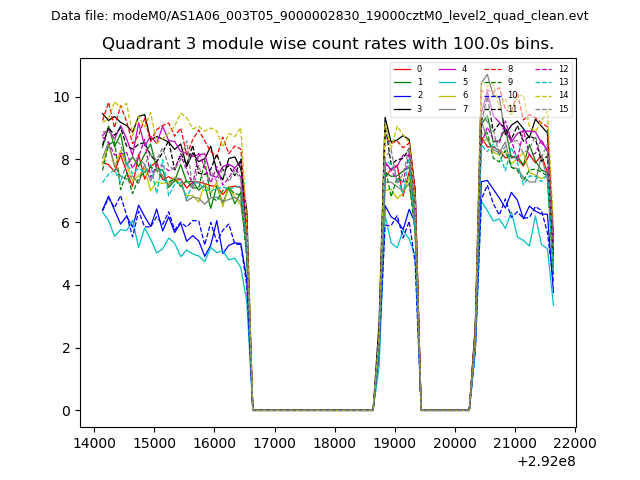
| Module-wise count rates for Quadrant D Data is divided into 100 sec bins |
 |
 |
| Parameter | Plot |
|---|---|
| CZT HV Monitor |  |
| D_VDD | 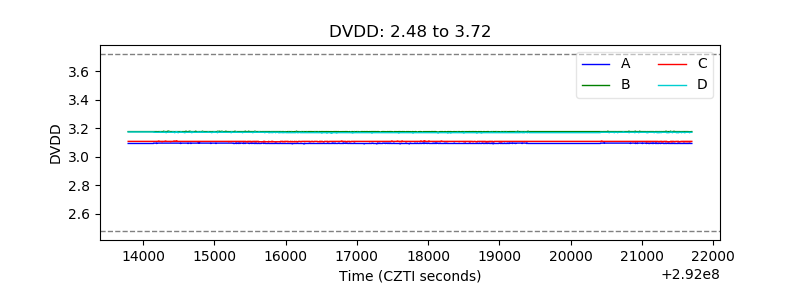 |
| Temperature 1 | 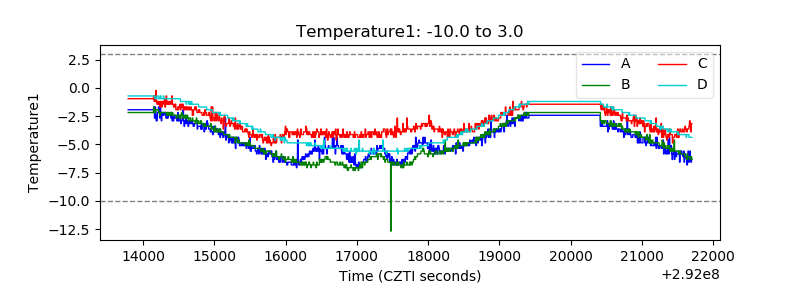 |
| Veto HV Monitor | 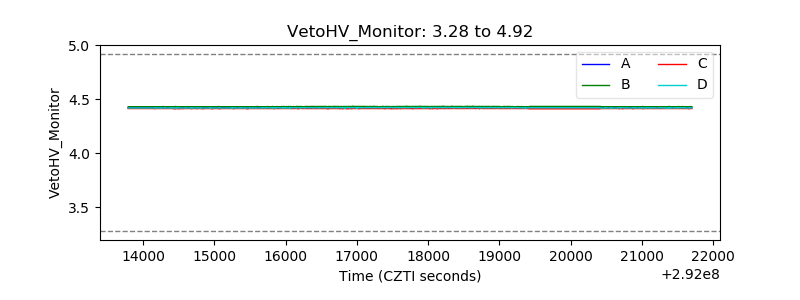 |
| Veto LLD | 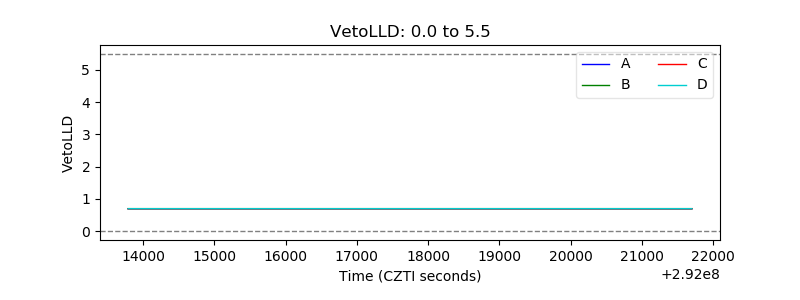 |
| Alpha Counter | 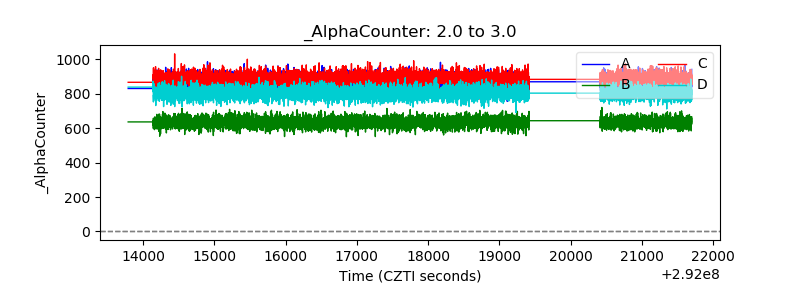 |
| _CPM_Rate | 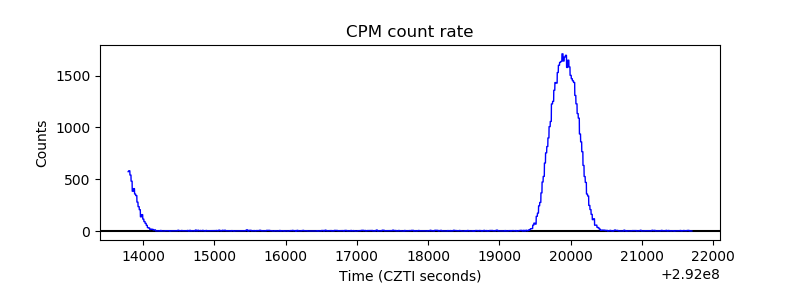 |
| CZT Counter | 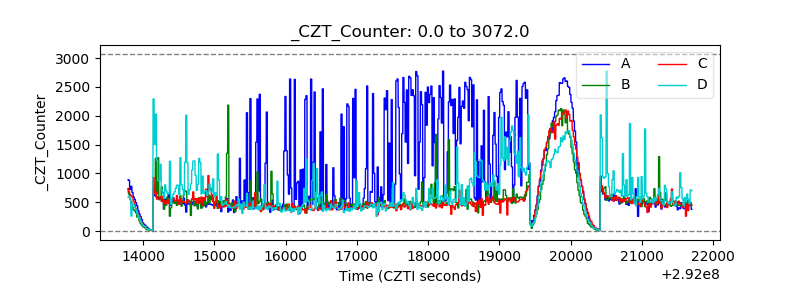 |
| +2.5 Volts monitor |  |
| +5 Volts monitor | 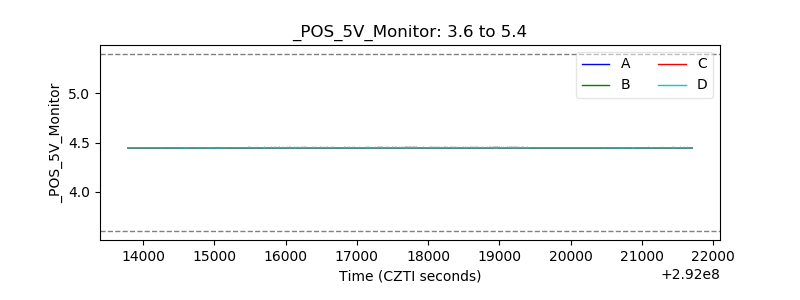 |
| _ROLL_ROT | 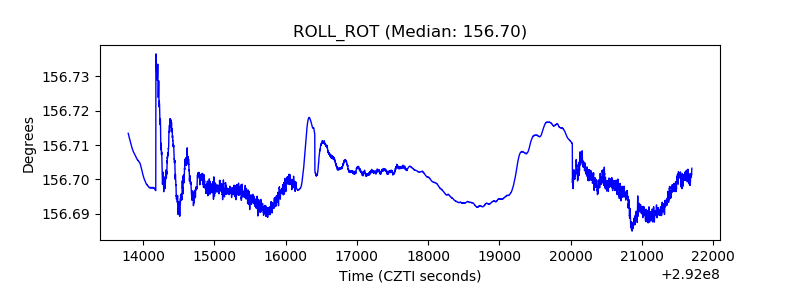 |
| _Roll_DEC | 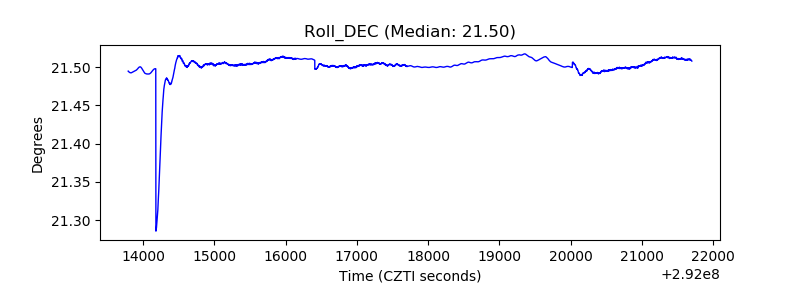 |
| _Roll_RA | 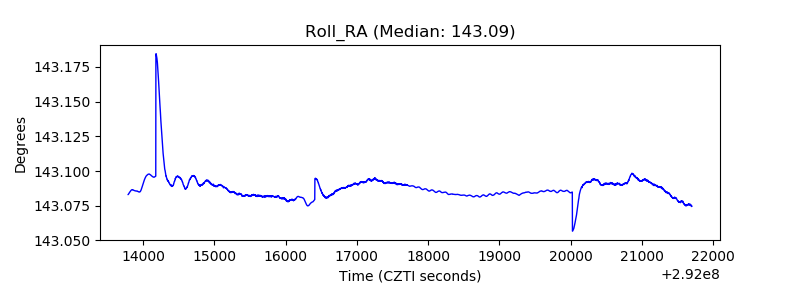 |
| Veto Counter | 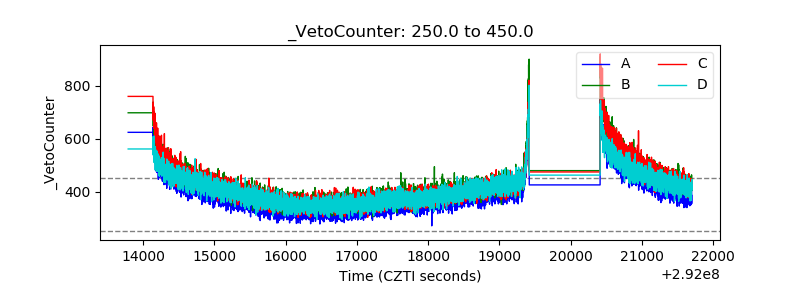 |