| Param | Original file | Final file |
|---|---|---|
| Filename | modeM0/AS1A06_003T05_9000002830_19004cztM0_level2.evt | modeM0/AS1A06_003T05_9000002830_19004cztM0_level2_quad_clean.evt |
| Size (bytes) | 681,707,520 | 82,552,320 |
| Size | 650.1 MB | 78.7 MB |
| Events in quadrant A | 7,089,825 | 510,627 |
| Events in quadrant B | 3,324,539 | 563,716 |
| Events in quadrant C | 3,239,257 | 524,402 |
| Events in quadrant D | 6,570,854 | 465,740 |
| Mode M9 | |||
|---|---|---|---|
| Quadrant | BADHDUFLAG | Total packets | Discarded packets |
| A | 0 | 17 | 0 |
| B | 0 | 18 | 0 |
| C | 0 | 18 | 0 |
| D | 0 | 18 | 0 |
| Mode SS | |||
|---|---|---|---|
| Quadrant | BADHDUFLAG | Total packets | Discarded packets |
| A | 0 | 128 | 0 |
| B | 0 | 128 | 0 |
| C | 0 | 128 | 0 |
| D | 0 | 128 | 0 |
| Mode M0 | |||
|---|---|---|---|
| Quadrant | BADHDUFLAG | Total packets | Discarded packets |
| A | 0 | 25232 | 2 |
| B | 0 | 13605 | 2 |
| C | 0 | 13282 | 2 |
| D | 0 | 23787 | 2 |
| Quadrant | Total seconds | Saturated seconds | Saturation percentage |
|---|---|---|---|
| A | 6226 | 1512 | 24.285255% |
| B | 6226 | 63 | 1.011886% |
| C | 6226 | 69 | 1.108256% |
| D | 6226 | 789 | 12.672663% |
Noise dominated data is calculated using 1-second bins in cleaned event files. If a bin has >2000 counts, and if more than 50% of those come from <1% of pixels, then it is considered to be noise-dominated and hence unusable.
| Quadrant | # 1 sec bins | Bins with >0 counts | Bins with >2000 counts | High rate bins dominated by noise | Noise dominated (total time) | Noise dominated (detector-on time) | Marked lightcurve |
|---|---|---|---|---|---|---|---|
| A | 7541 | 6227 | 1096 | 1096 | 14.53% | 17.60% | 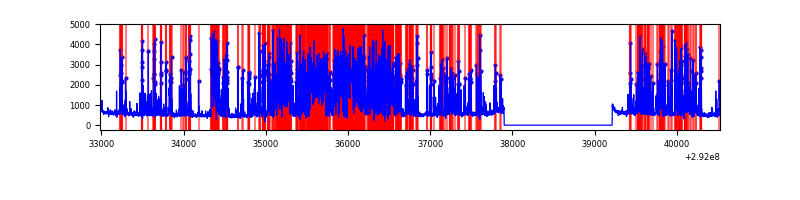 |
| B | 7541 | 6227 | 2 | 2 | 0.03% | 0.03% | 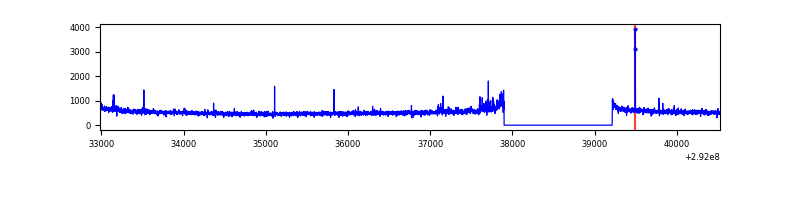 |
| C | 7541 | 6227 | 0 | 0 | 0.00% | 0.00% | 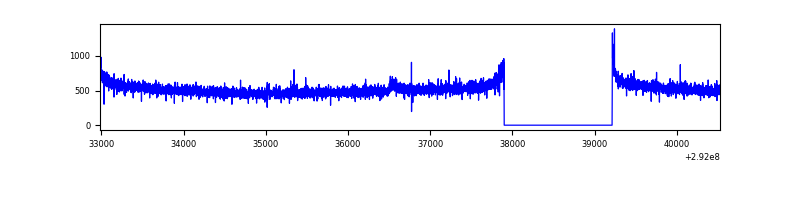 |
| D | 7541 | 6227 | 640 | 640 | 8.49% | 10.28% | 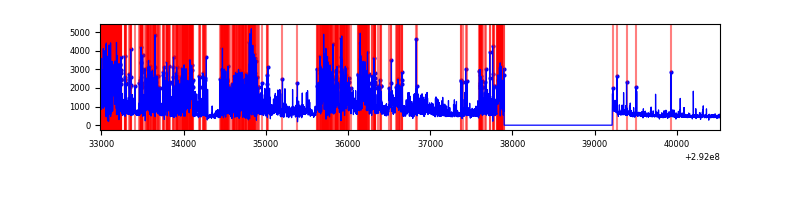 |
Top three noisy pixels from each quadrant. If the there are fewer than three noisy pixels in the level2.evt file, extra rows are filled as -1
| Pixel properties | Quadrant properties | ||||||
|---|---|---|---|---|---|---|---|
| Quadrant | DetID | PixID | Counts | Sigma | Mean | Median | Sigma |
| A | 14 | 235 | 4282226 | 29808.99 | 728 | 717 | 143.6 |
| A | 8 | 144 | 6692 | 41.6 | 728 | 717 | 143.6 |
| A | 0 | 226 | 6336 | 39.12 | 728 | 717 | 143.6 |
| B | 7 | 220 | 41998 | 266.05 | 825 | 808 | 154.8 |
| B | 12 | 111 | 17762 | 109.51 | 825 | 808 | 154.8 |
| B | 3 | 112 | 17067 | 105.02 | 825 | 808 | 154.8 |
| C | 14 | 238 | 123319 | 673.3 | 783 | 792 | 182.0 |
| C | 3 | 233 | 59365 | 321.86 | 783 | 792 | 182.0 |
| C | 13 | 61 | 5517 | 25.96 | 783 | 792 | 182.0 |
| D | 7 | 238 | 2975402 | 16600.48 | 741 | 721 | 179.2 |
| D | 1 | 52 | 665706 | 3711.01 | 741 | 721 | 179.2 |
| D | 7 | 96 | 61808 | 340.9 | 741 | 721 | 179.2 |
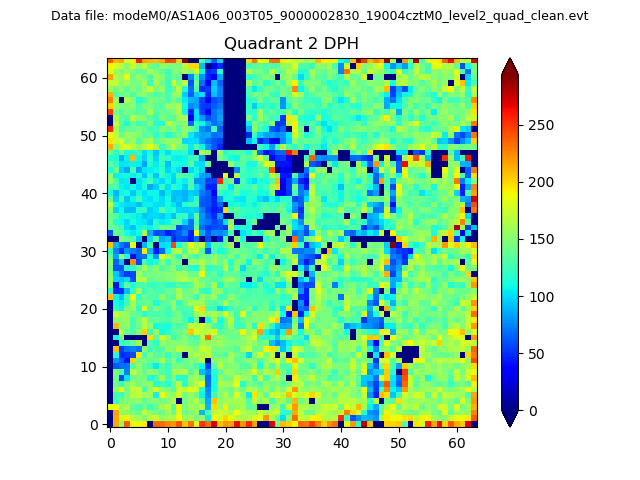
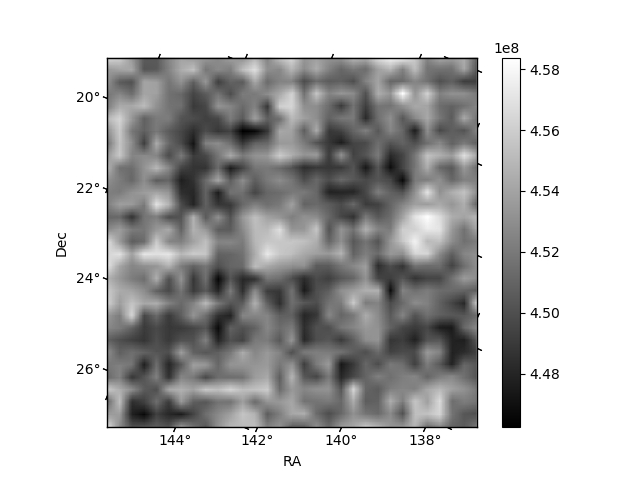
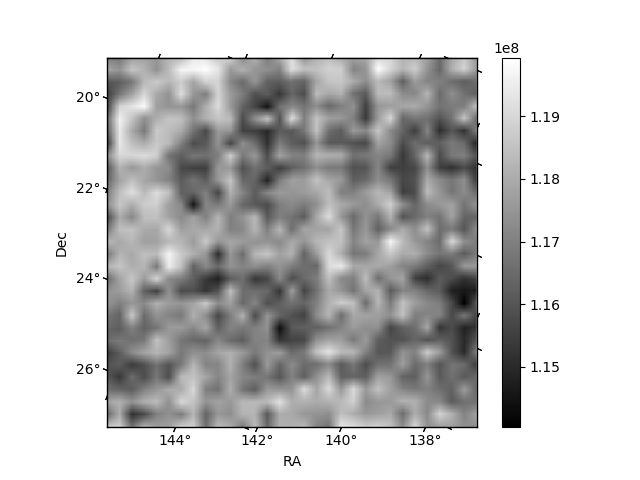
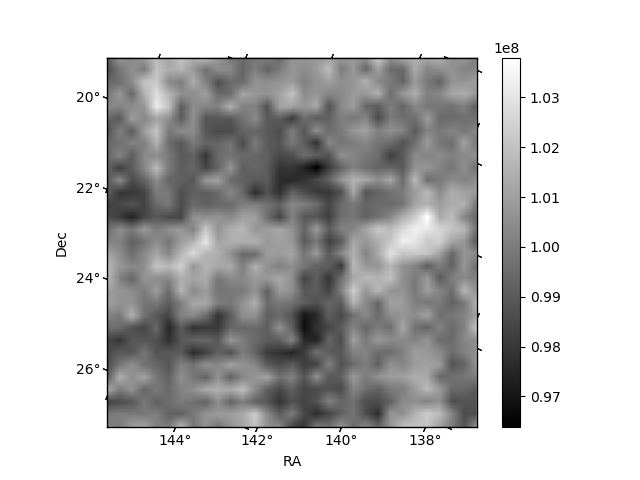
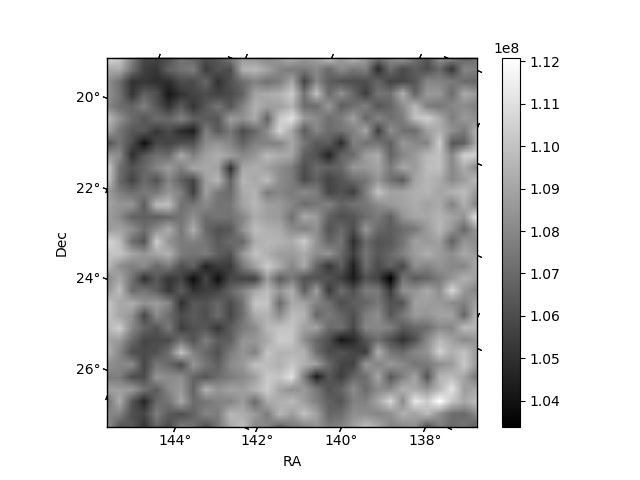
Histogram calculated using DETX and DETY for each event in the final _common_clean file
| Quadrant A | 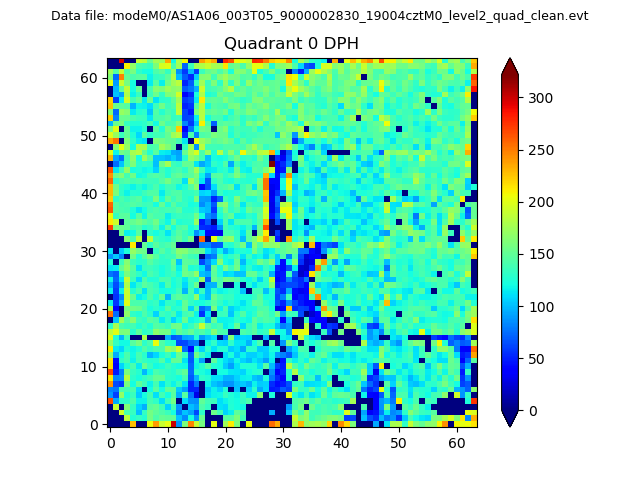 |
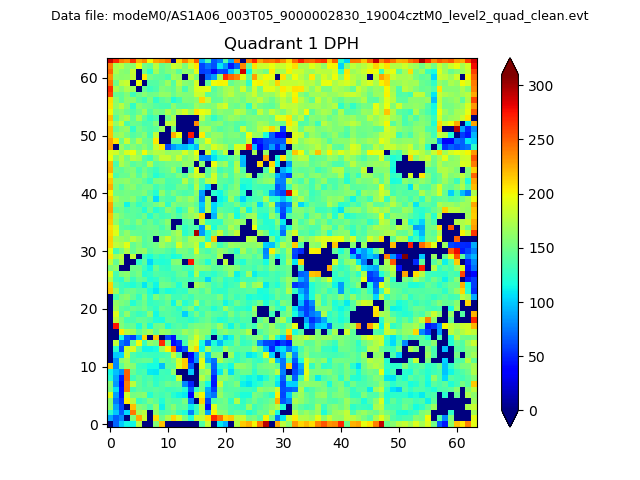 |
Quadrant B |
|---|---|---|---|
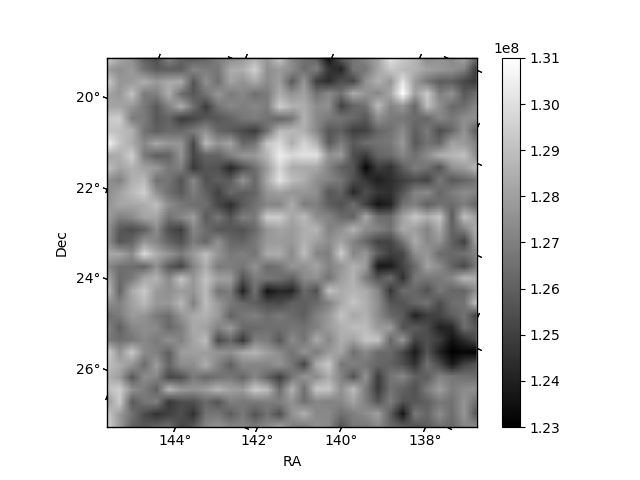
| Quadrant D | 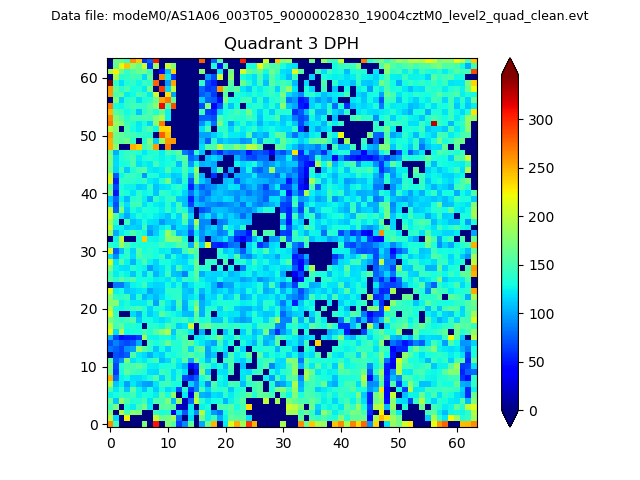 |
 |
Quadrant C |
| Plot type | Count rate plots | Images |
|---|---|---|
| Comparison with Poisson distribution Blue bars denote a histogram of data divided into 1 sec bins. Red curve is a Poisson curve with rate = median count rate of data. |
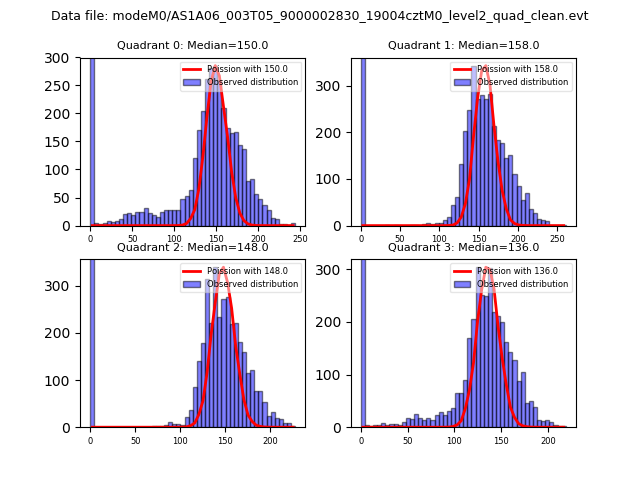 |
 |
| Quadrant-wise count rates Data is divided into 100 sec bins |
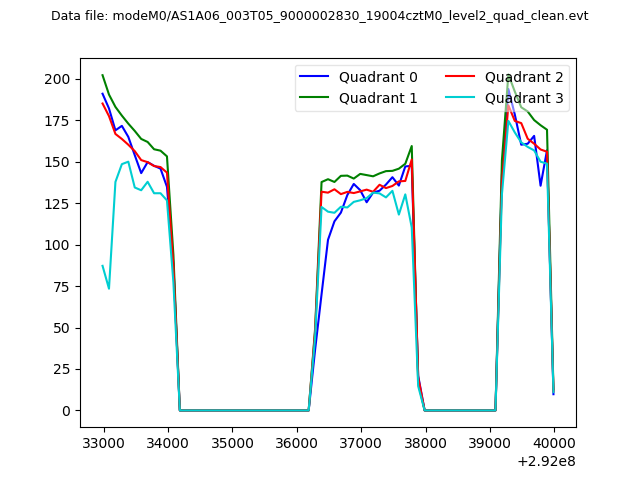 |
|
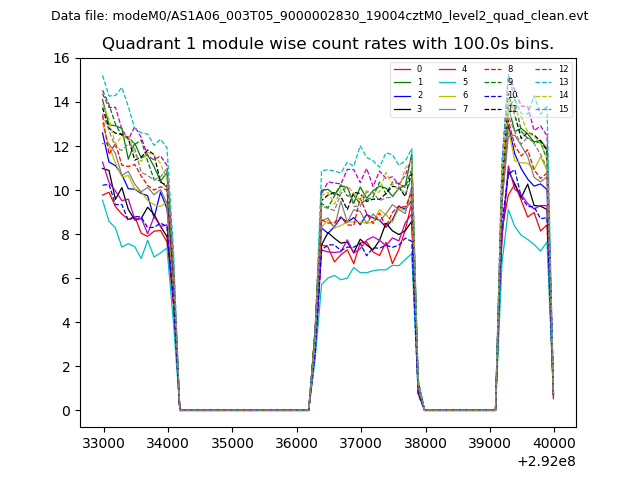
| Module-wise count rates for Quadrant A Data is divided into 100 sec bins |
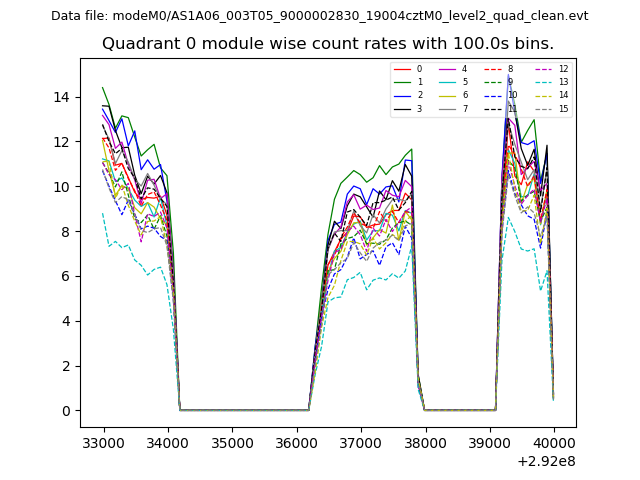 |
 |
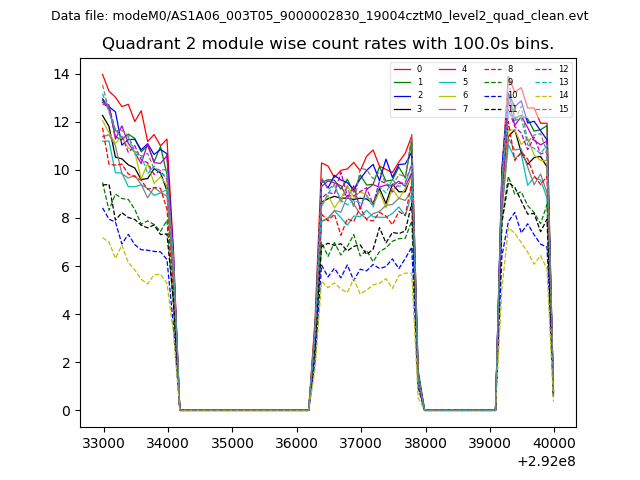
| Module-wise count rates for Quadrant B Data is divided into 100 sec bins |
 |
 |
| Module-wise count rates for Quadrant C Data is divided into 100 sec bins |
 |
 |
| Module-wise count rates for Quadrant D Data is divided into 100 sec bins |
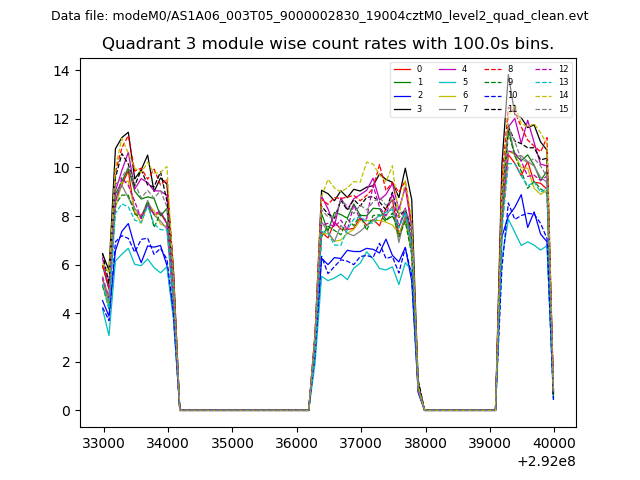 |
 |
| Parameter | Plot |
|---|---|
| CZT HV Monitor | 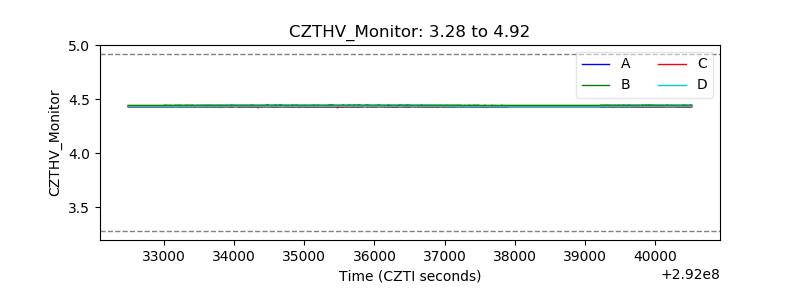 |
| D_VDD | 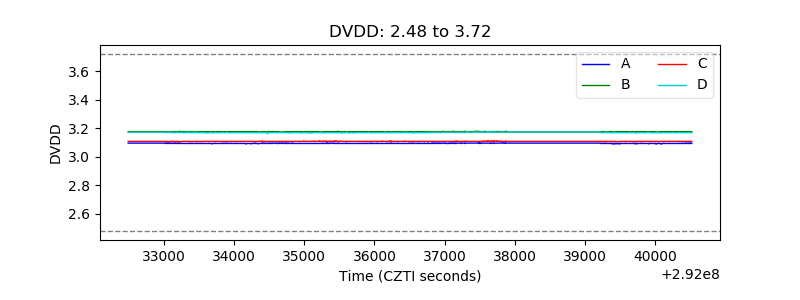 |
| Temperature 1 | 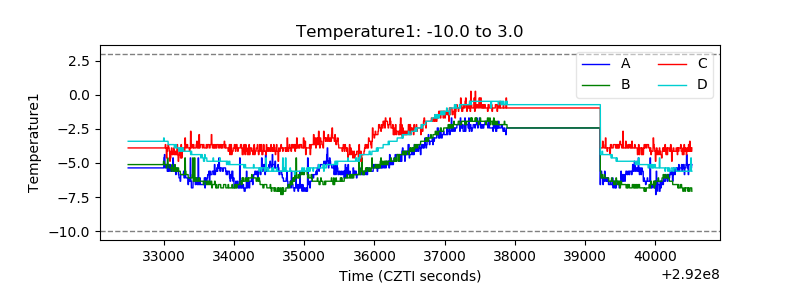 |
| Veto HV Monitor | 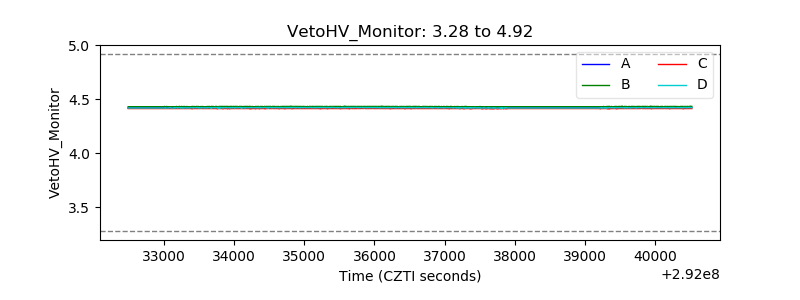 |
| Veto LLD |  |
| Alpha Counter | 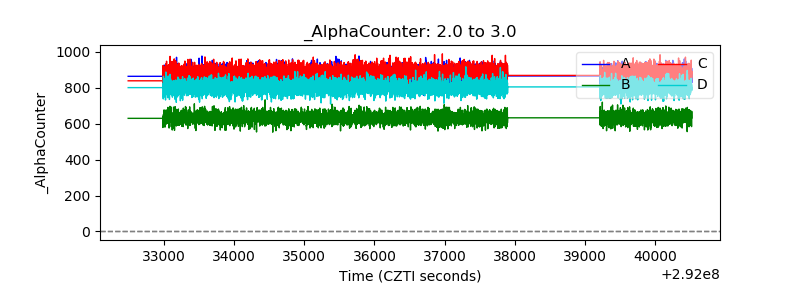 |
| _CPM_Rate | 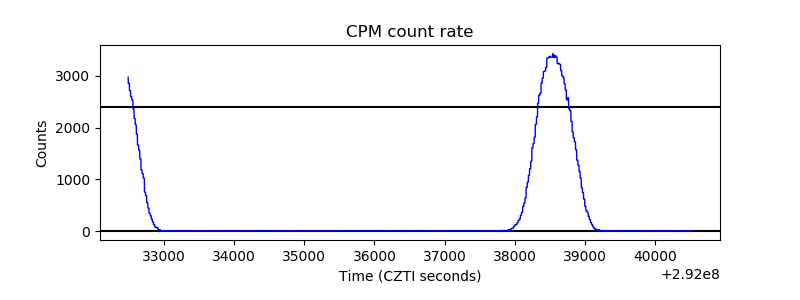 |
| CZT Counter | 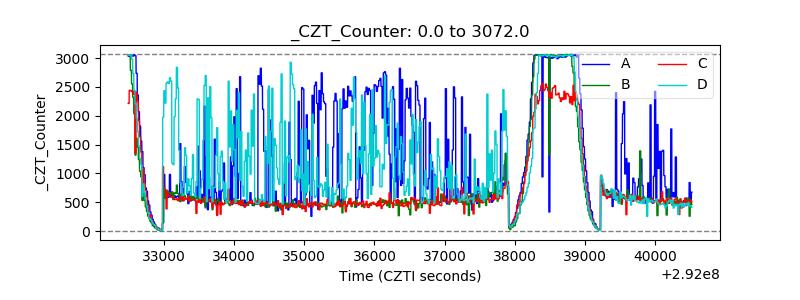 |
| +2.5 Volts monitor |  |
| +5 Volts monitor |  |
| _ROLL_ROT | 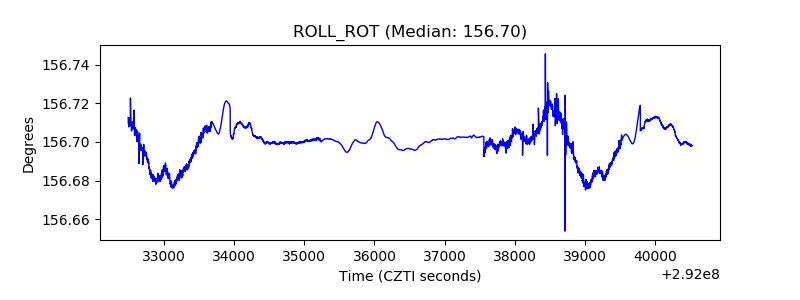 |
| _Roll_DEC | 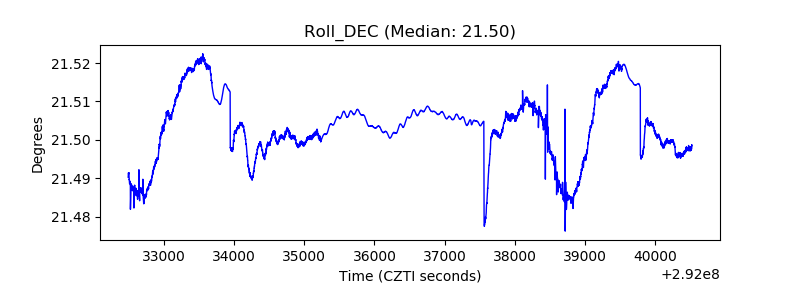 |
| _Roll_RA | 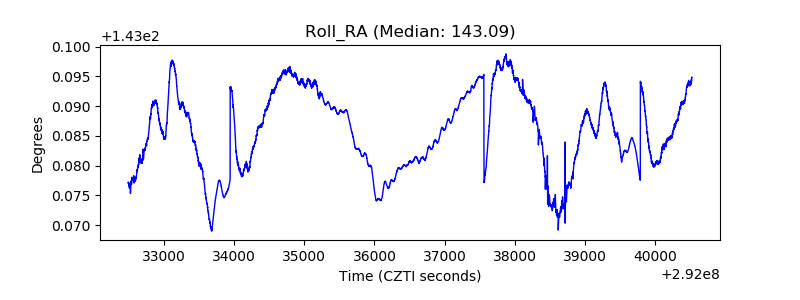 |
| Veto Counter | 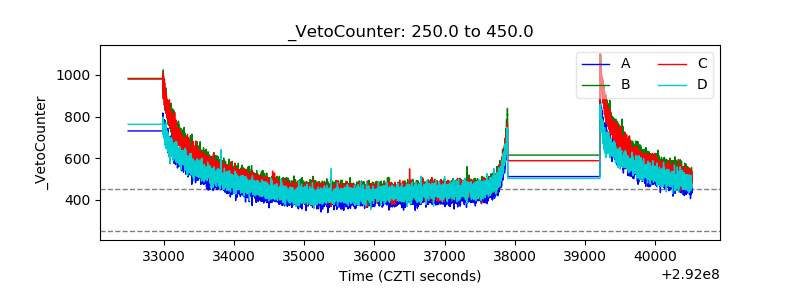 |