| Param | Original file | Final file |
|---|---|---|
| Filename | modeM0/AS1A06_003T05_9000002830_19008cztM0_level2.evt | modeM0/AS1A06_003T05_9000002830_19008cztM0_level2_quad_clean.evt |
| Size (bytes) | 646,813,440 | 77,362,560 |
| Size | 616.8 MB | 73.8 MB |
| Events in quadrant A | 5,928,475 | 455,270 |
| Events in quadrant B | 3,753,690 | 486,970 |
| Events in quadrant C | 3,641,262 | 463,923 |
| Events in quadrant D | 5,780,632 | 437,828 |
| Mode M9 | |||
|---|---|---|---|
| Quadrant | BADHDUFLAG | Total packets | Discarded packets |
| A | 0 | 6 | 0 |
| B | 0 | 6 | 0 |
| C | 0 | 6 | 0 |
| D | 0 | 6 | 0 |
| Mode SS | |||
|---|---|---|---|
| Quadrant | BADHDUFLAG | Total packets | Discarded packets |
| A | 0 | 144 | 0 |
| B | 0 | 144 | 0 |
| C | 0 | 144 | 0 |
| D | 0 | 144 | 0 |
| Mode M0 | |||
|---|---|---|---|
| Quadrant | BADHDUFLAG | Total packets | Discarded packets |
| A | 0 | 22222 | 2 |
| B | 0 | 15479 | 2 |
| C | 0 | 15084 | 2 |
| D | 0 | 21989 | 2 |
| Quadrant | Total seconds | Saturated seconds | Saturation percentage |
|---|---|---|---|
| A | 7160 | 1015 | 14.175978% |
| B | 7161 | 213 | 2.974445% |
| C | 7161 | 204 | 2.848764% |
| D | 7161 | 587 | 8.197179% |
Noise dominated data is calculated using 1-second bins in cleaned event files. If a bin has >2000 counts, and if more than 50% of those come from <1% of pixels, then it is considered to be noise-dominated and hence unusable.
| Quadrant | # 1 sec bins | Bins with >0 counts | Bins with >2000 counts | High rate bins dominated by noise | Noise dominated (total time) | Noise dominated (detector-on time) | Marked lightcurve |
|---|---|---|---|---|---|---|---|
| A | 7730 | 7160 | 582 | 582 | 7.53% | 8.13% | 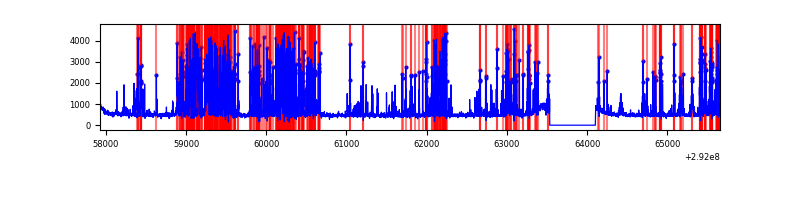 |
| B | 7731 | 7162 | 8 | 8 | 0.10% | 0.11% | 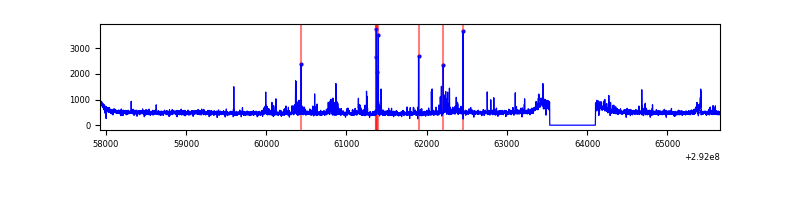 |
| C | 7731 | 7162 | 1 | 1 | 0.01% | 0.01% | 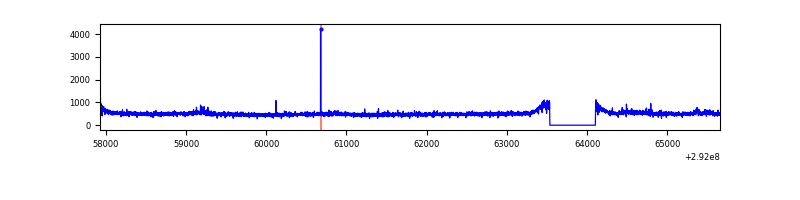 |
| D | 7731 | 7162 | 390 | 390 | 5.04% | 5.45% | 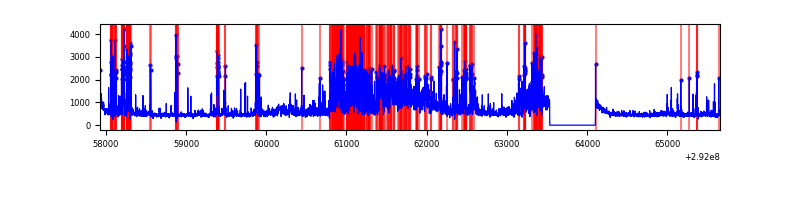 |
Top three noisy pixels from each quadrant. If the there are fewer than three noisy pixels in the level2.evt file, extra rows are filled as -1
| Pixel properties | Quadrant properties | ||||||
|---|---|---|---|---|---|---|---|
| Quadrant | DetID | PixID | Counts | Sigma | Mean | Median | Sigma |
| A | 14 | 235 | 2644481 | 15367.31 | 847 | 827 | 172.0 |
| A | 9 | 143 | 11968 | 64.76 | 847 | 827 | 172.0 |
| A | 8 | 205 | 8670 | 45.59 | 847 | 827 | 172.0 |
| B | 3 | 112 | 152921 | 883.45 | 895 | 871 | 172.1 |
| B | 7 | 220 | 28331 | 159.55 | 895 | 871 | 172.1 |
| B | 15 | 201 | 25152 | 141.08 | 895 | 871 | 172.1 |
| C | 3 | 233 | 160653 | 797.85 | 854 | 859 | 200.3 |
| C | 14 | 238 | 133678 | 663.16 | 854 | 859 | 200.3 |
| C | 0 | 207 | 6328 | 27.31 | 854 | 859 | 200.3 |
| D | 7 | 238 | 1346441 | 6488.01 | 850 | 826 | 207.4 |
| D | 2 | 233 | 662563 | 3190.63 | 850 | 826 | 207.4 |
| D | 1 | 52 | 533093 | 2566.37 | 850 | 826 | 207.4 |
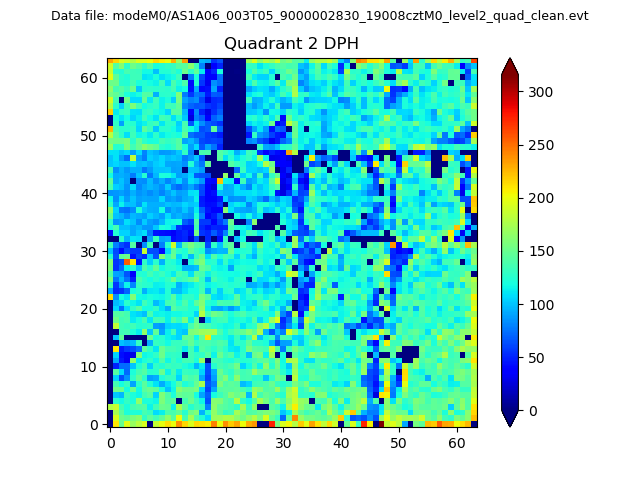
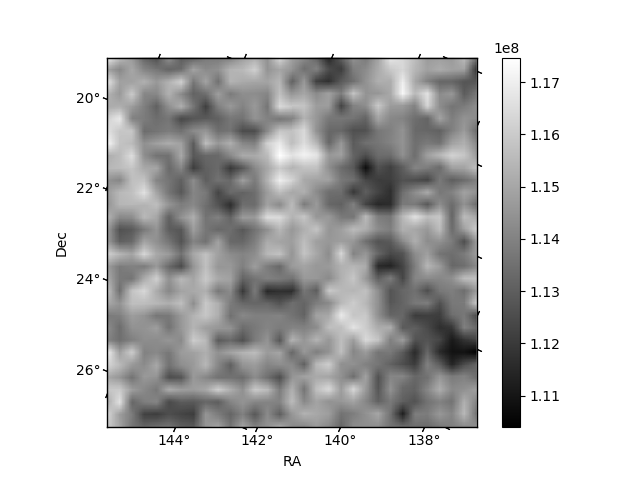
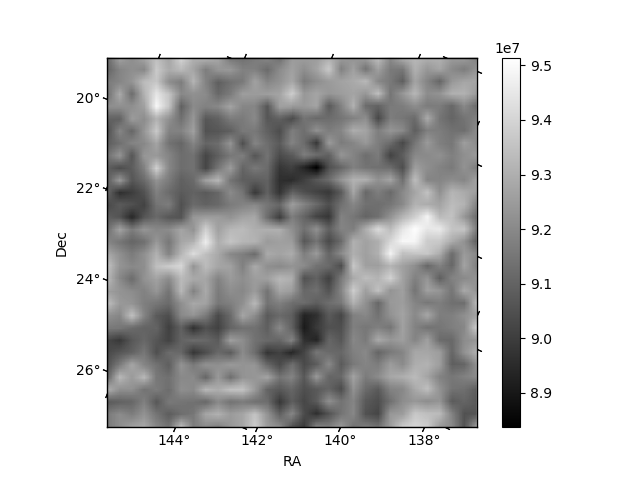
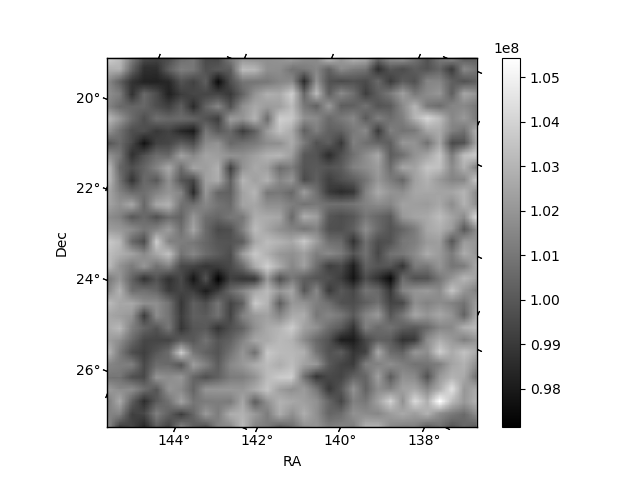
Histogram calculated using DETX and DETY for each event in the final _common_clean file
| Quadrant A | 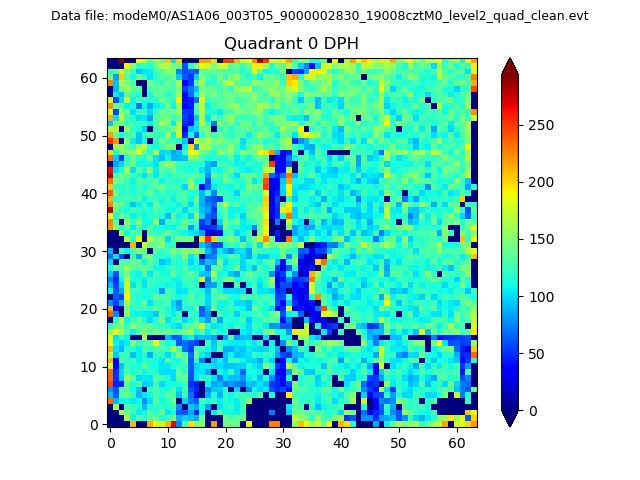 |
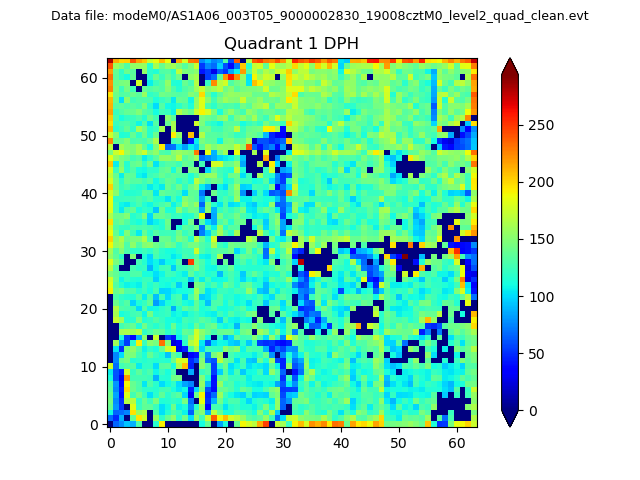 |
Quadrant B |
|---|---|---|---|
| Quadrant D | 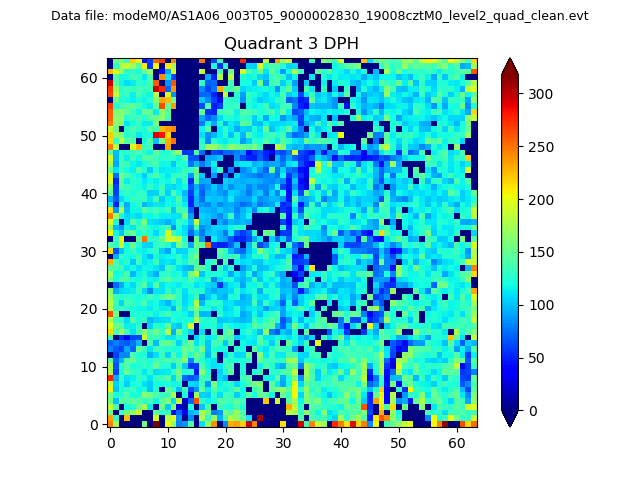 |
 |
Quadrant C |
| Plot type | Count rate plots | Images |
|---|---|---|
| Comparison with Poisson distribution Blue bars denote a histogram of data divided into 1 sec bins. Red curve is a Poisson curve with rate = median count rate of data. |
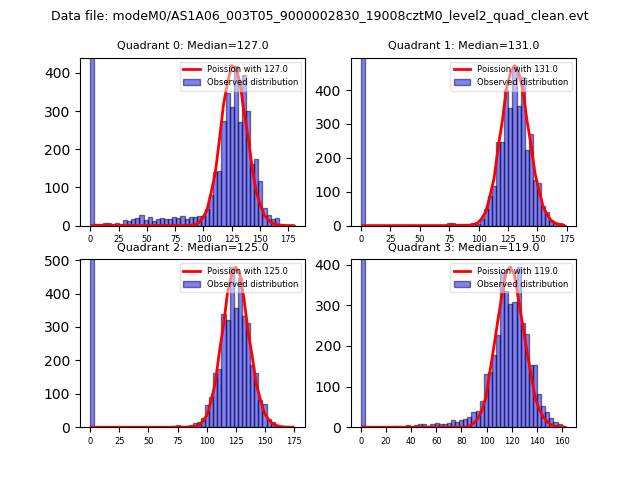 |
 |
| Quadrant-wise count rates Data is divided into 100 sec bins |
 |
|
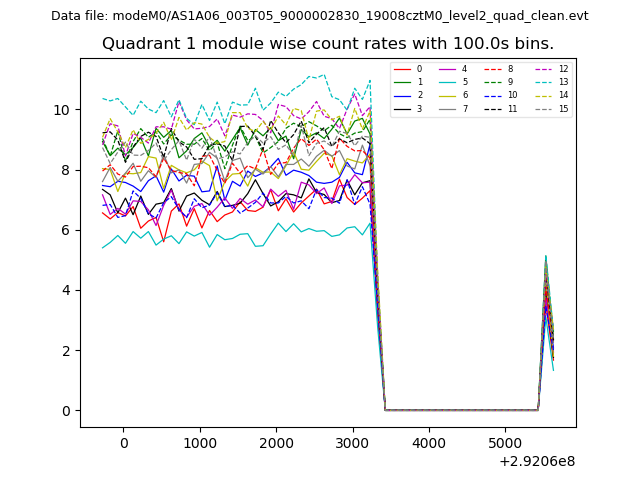
| Module-wise count rates for Quadrant A Data is divided into 100 sec bins |
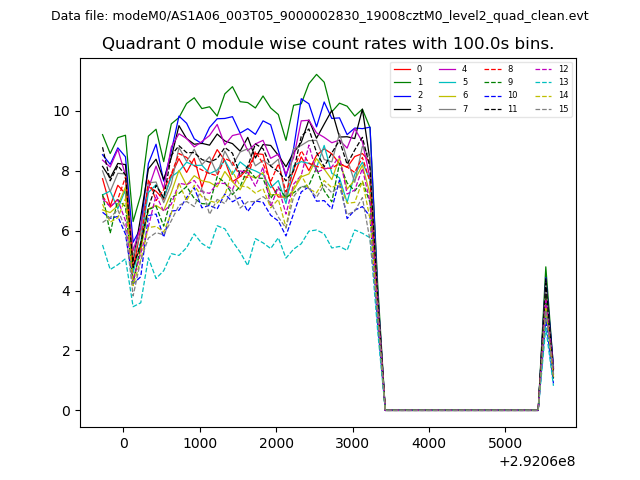 |
 |
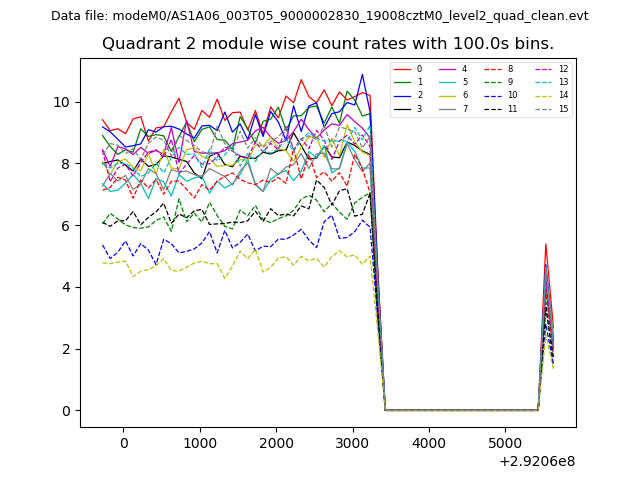
| Module-wise count rates for Quadrant B Data is divided into 100 sec bins |
 |
 |
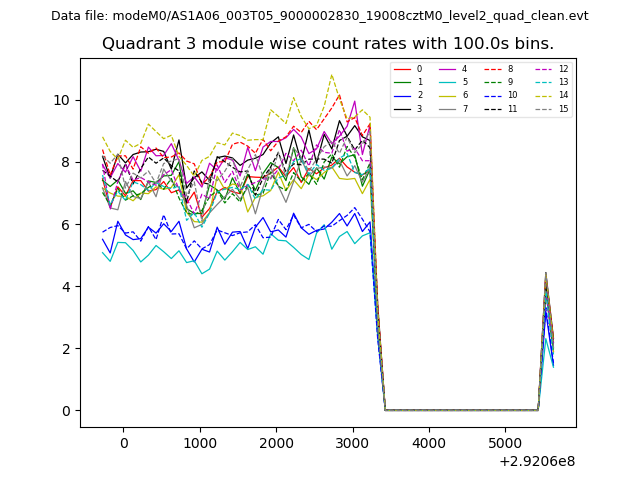
| Module-wise count rates for Quadrant C Data is divided into 100 sec bins |
 |
 |
| Module-wise count rates for Quadrant D Data is divided into 100 sec bins |
 |
 |
| Parameter | Plot |
|---|---|
| CZT HV Monitor | 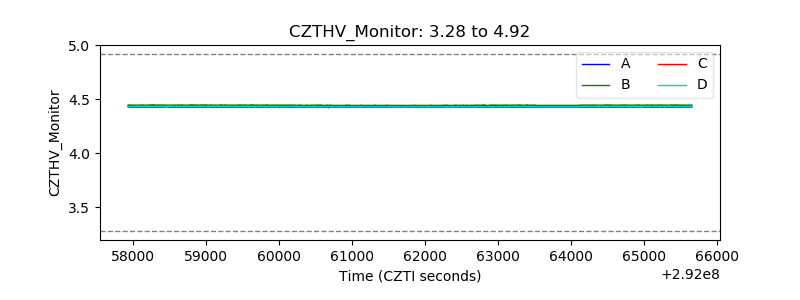 |
| D_VDD | 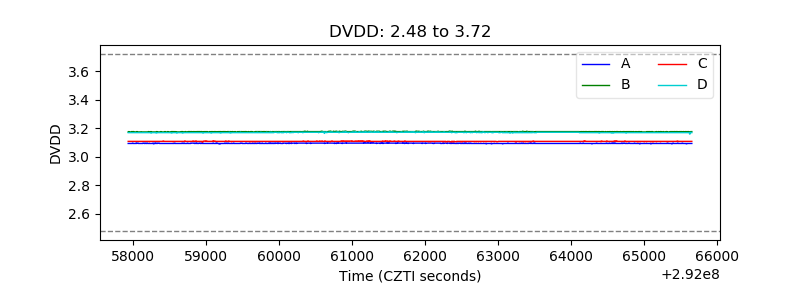 |
| Temperature 1 | 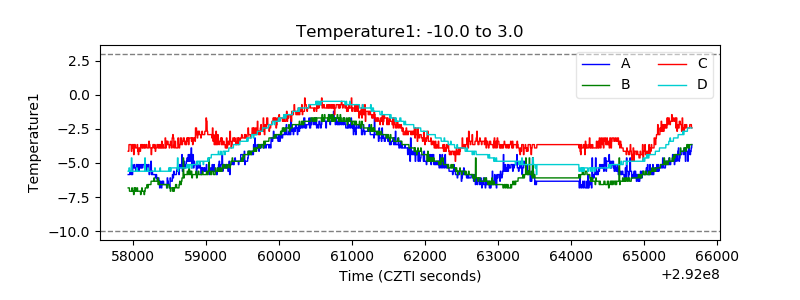 |
| Veto HV Monitor | 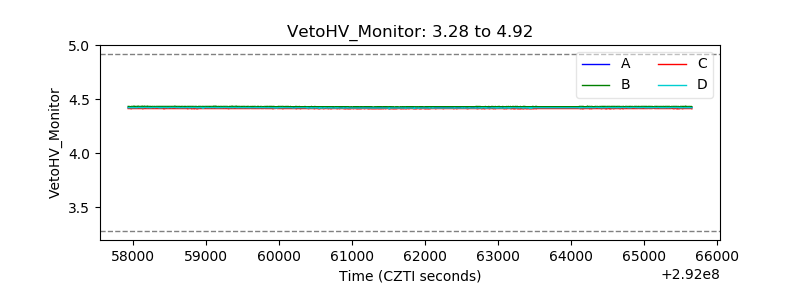 |
| Veto LLD | 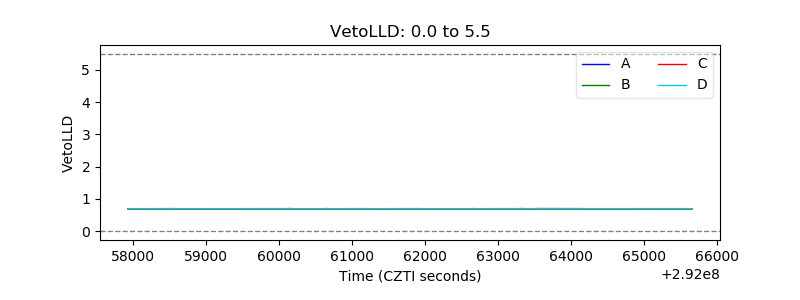 |
| Alpha Counter | 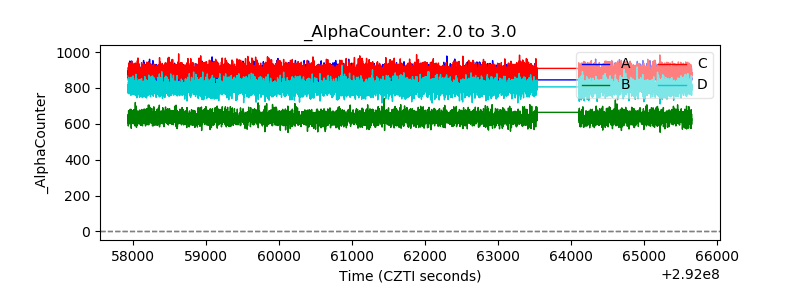 |
| _CPM_Rate |  |
| CZT Counter | 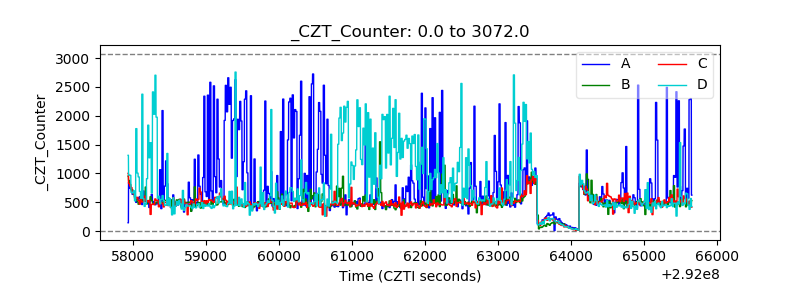 |
| +2.5 Volts monitor |  |
| +5 Volts monitor |  |
| _ROLL_ROT | 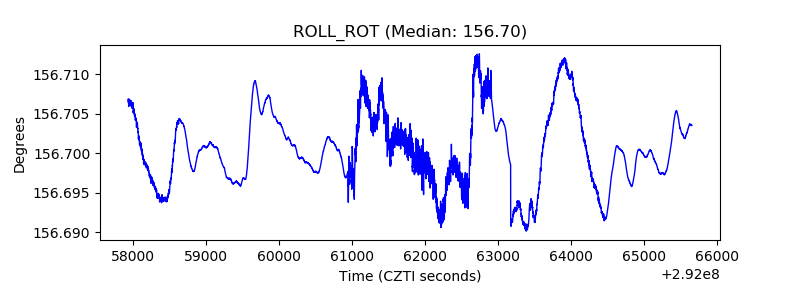 |
| _Roll_DEC | 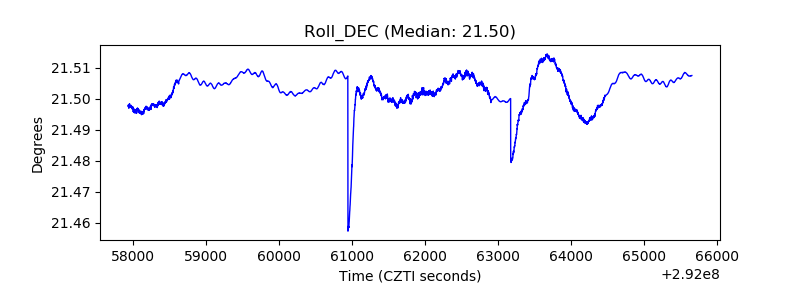 |
| _Roll_RA | 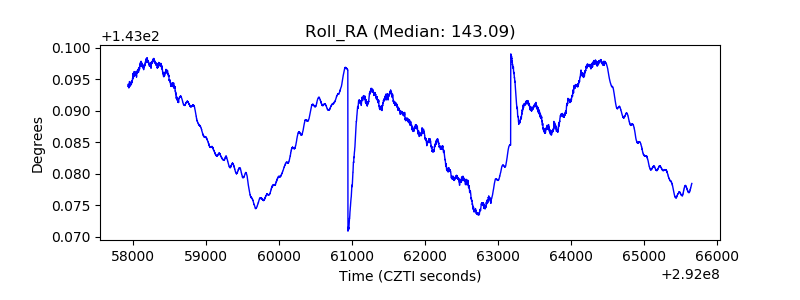 |
| Veto Counter | 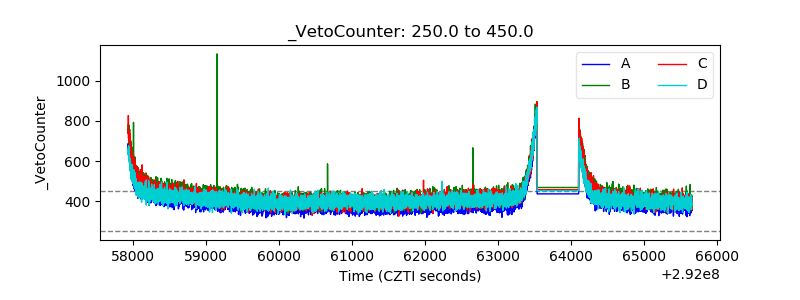 |