| Param | Original file | Final file |
|---|---|---|
| Filename | modeM0/AS1A06_003T05_9000002830_19009cztM0_level2.evt | modeM0/AS1A06_003T05_9000002830_19009cztM0_level2_quad_clean.evt |
| Size (bytes) | 655,977,600 | 82,658,880 |
| Size | 625.6 MB | 78.8 MB |
| Events in quadrant A | 6,317,470 | 472,448 |
| Events in quadrant B | 4,344,799 | 516,196 |
| Events in quadrant C | 3,894,123 | 495,771 |
| Events in quadrant D | 4,783,010 | 478,131 |
| Mode SS | |||
|---|---|---|---|
| Quadrant | BADHDUFLAG | Total packets | Discarded packets |
| A | 0 | 156 | 0 |
| B | 0 | 156 | 0 |
| C | 0 | 156 | 0 |
| D | 0 | 156 | 0 |
| Mode M0 | |||
|---|---|---|---|
| Quadrant | BADHDUFLAG | Total packets | Discarded packets |
| A | 0 | 23877 | 3 |
| B | 0 | 17859 | 2 |
| C | 0 | 16356 | 2 |
| D | 0 | 19404 | 2 |
| Quadrant | Total seconds | Saturated seconds | Saturation percentage |
|---|---|---|---|
| A | 7763 | 1287 | 16.578642% |
| B | 7764 | 478 | 6.156620% |
| C | 7764 | 406 | 5.229263% |
| D | 7764 | 477 | 6.143740% |
Noise dominated data is calculated using 1-second bins in cleaned event files. If a bin has >2000 counts, and if more than 50% of those come from <1% of pixels, then it is considered to be noise-dominated and hence unusable.
| Quadrant | # 1 sec bins | Bins with >0 counts | Bins with >2000 counts | High rate bins dominated by noise | Noise dominated (total time) | Noise dominated (detector-on time) | Marked lightcurve |
|---|---|---|---|---|---|---|---|
| A | 7778 | 7764 | 605 | 605 | 7.78% | 7.79% | 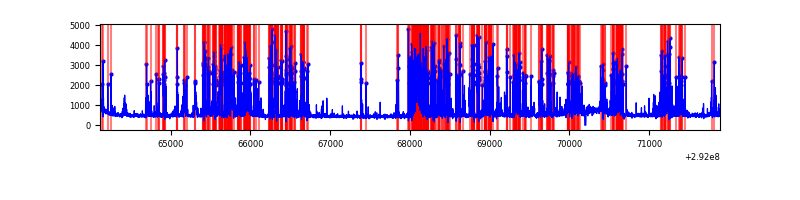 |
| B | 7779 | 7765 | 44 | 44 | 0.57% | 0.57% | 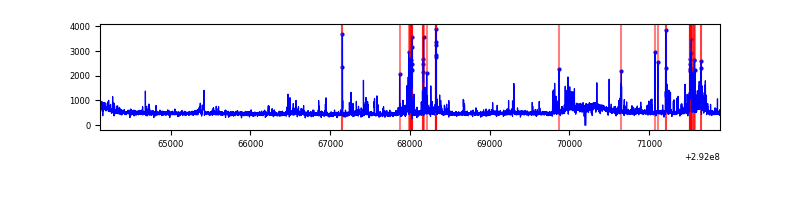 |
| C | 7779 | 7765 | 0 | 0 | 0.00% | 0.00% | 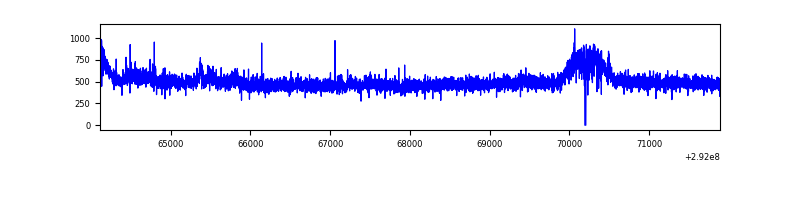 |
| D | 7779 | 7765 | 151 | 151 | 1.94% | 1.94% | 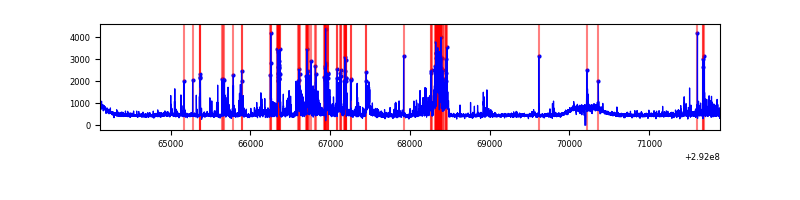 |
Top three noisy pixels from each quadrant. If the there are fewer than three noisy pixels in the level2.evt file, extra rows are filled as -1
| Pixel properties | Quadrant properties | ||||||
|---|---|---|---|---|---|---|---|
| Quadrant | DetID | PixID | Counts | Sigma | Mean | Median | Sigma |
| A | 14 | 235 | 2810938 | 15133.56 | 907 | 885 | 185.7 |
| A | 9 | 143 | 7995 | 38.29 | 907 | 885 | 185.7 |
| A | 0 | 226 | 7872 | 37.63 | 907 | 885 | 185.7 |
| B | 3 | 112 | 423880 | 2279.33 | 960 | 933 | 185.6 |
| B | 10 | 245 | 44986 | 237.41 | 960 | 933 | 185.6 |
| B | 7 | 220 | 44869 | 236.78 | 960 | 933 | 185.6 |
| C | 14 | 238 | 143033 | 656.66 | 924 | 928 | 216.4 |
| C | 3 | 233 | 127793 | 586.24 | 924 | 928 | 216.4 |
| C | 9 | 54 | 6940 | 27.78 | 924 | 928 | 216.4 |
| D | 2 | 233 | 642015 | 2799.06 | 935 | 906 | 229.0 |
| D | 7 | 238 | 431510 | 1880.0 | 935 | 906 | 229.0 |
| D | 1 | 52 | 88284 | 381.49 | 935 | 906 | 229.0 |
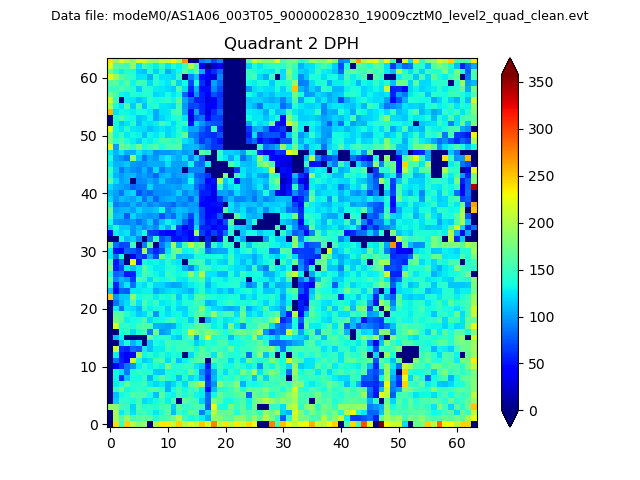
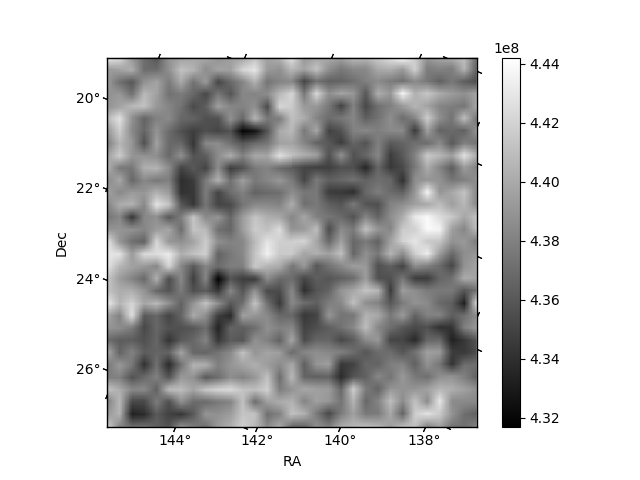
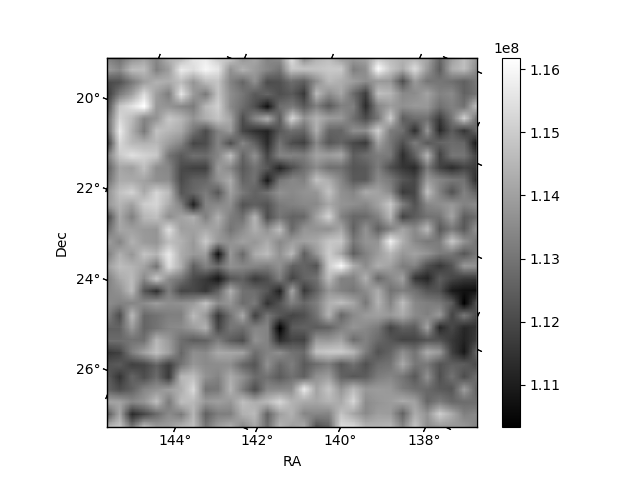
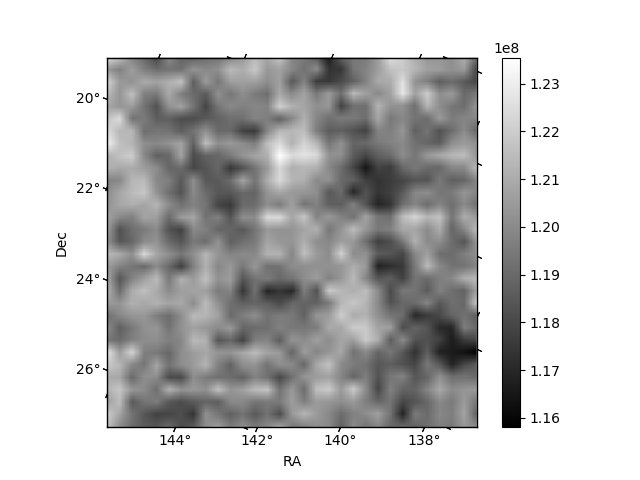
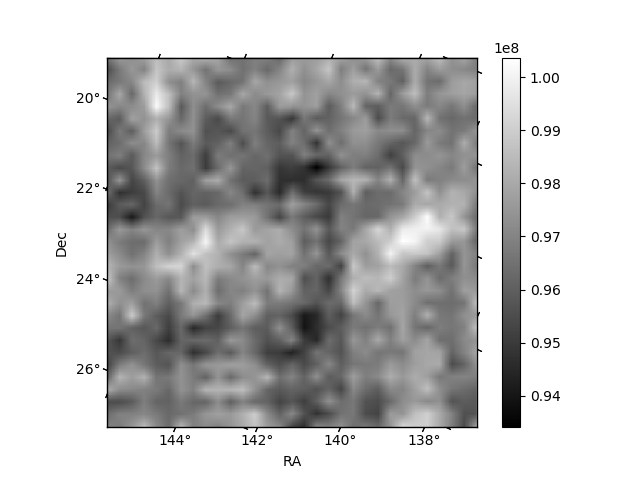
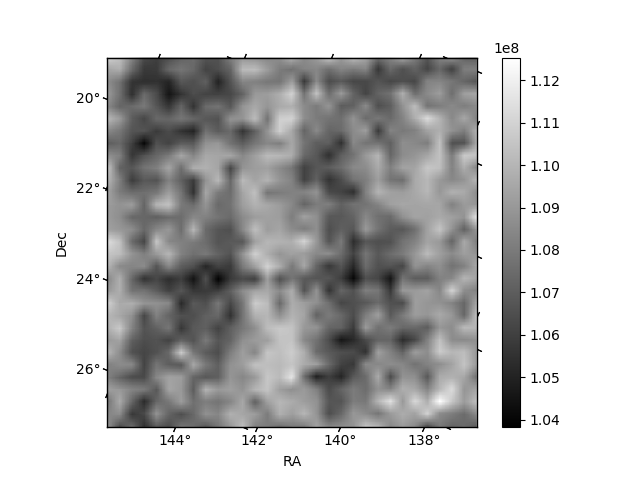
Histogram calculated using DETX and DETY for each event in the final _common_clean file
| Quadrant A | 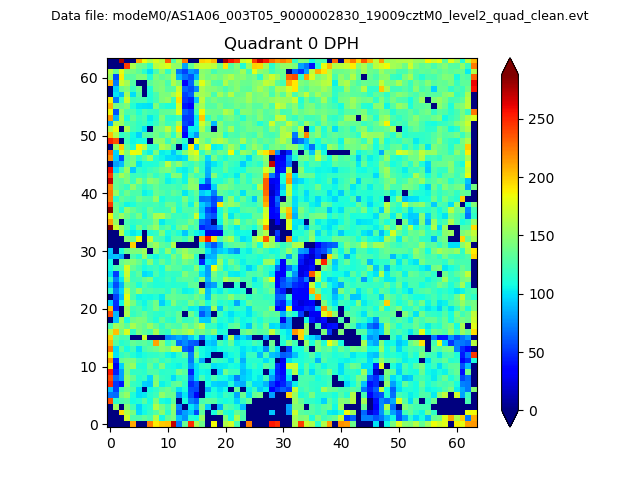 |
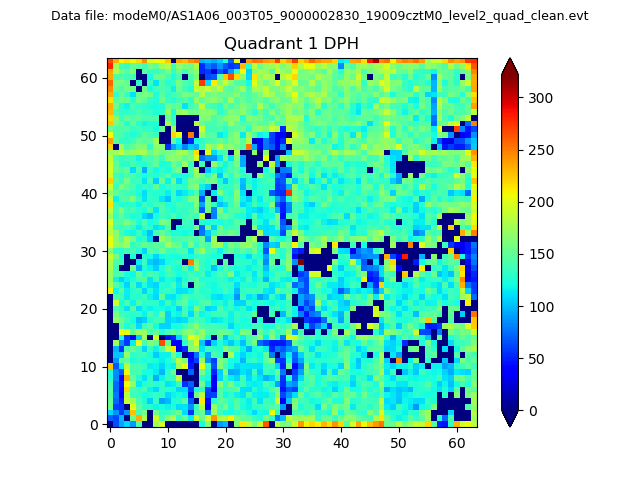 |
Quadrant B |
|---|---|---|---|
| Quadrant D | 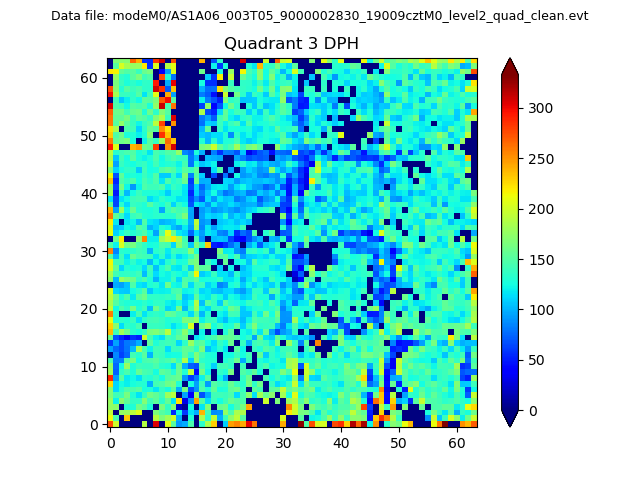 |
 |
Quadrant C |
| Plot type | Count rate plots | Images |
|---|---|---|
| Comparison with Poisson distribution Blue bars denote a histogram of data divided into 1 sec bins. Red curve is a Poisson curve with rate = median count rate of data. |
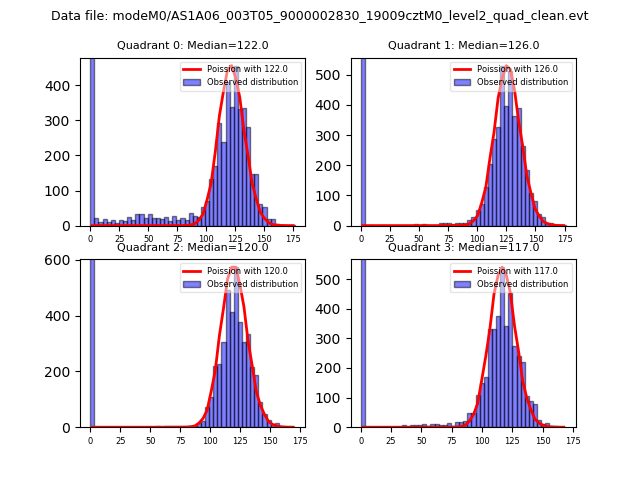 |
 |
| Quadrant-wise count rates Data is divided into 100 sec bins |
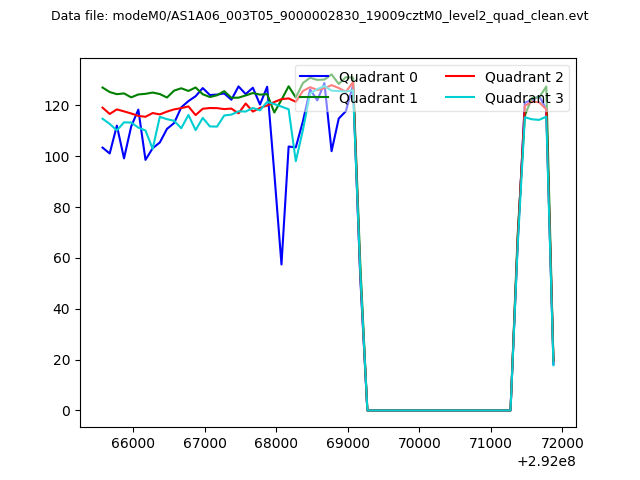 |
|
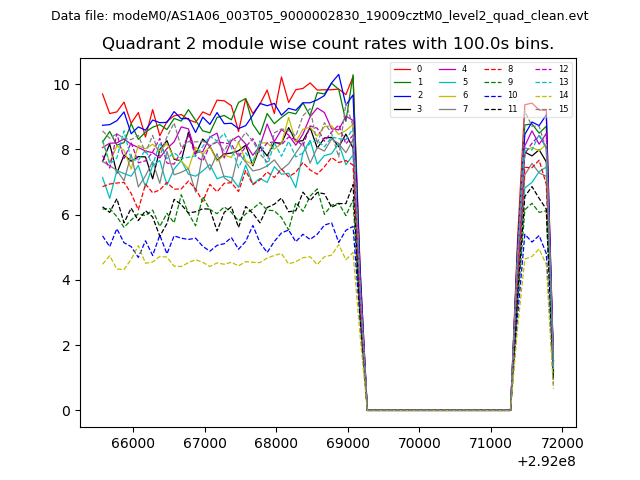
| Module-wise count rates for Quadrant A Data is divided into 100 sec bins |
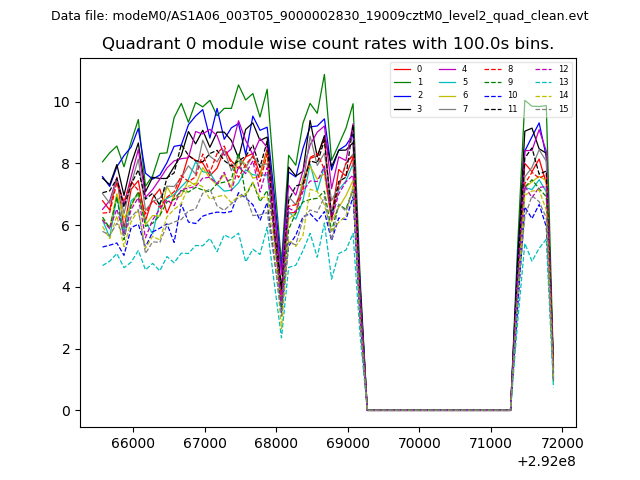 |
 |
| Module-wise count rates for Quadrant B Data is divided into 100 sec bins |
 |
 |
| Module-wise count rates for Quadrant C Data is divided into 100 sec bins |
 |
 |
| Module-wise count rates for Quadrant D Data is divided into 100 sec bins |
 |
 |
| Parameter | Plot |
|---|---|
| CZT HV Monitor | 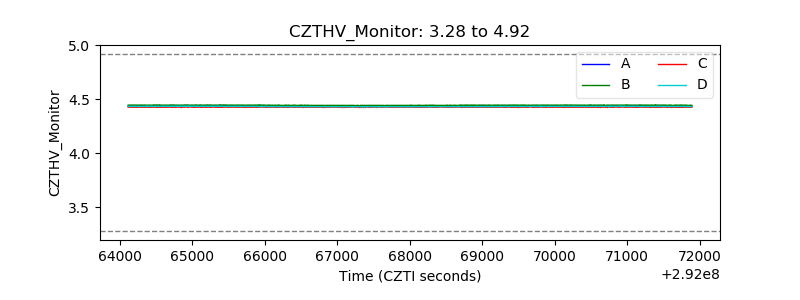 |
| D_VDD | 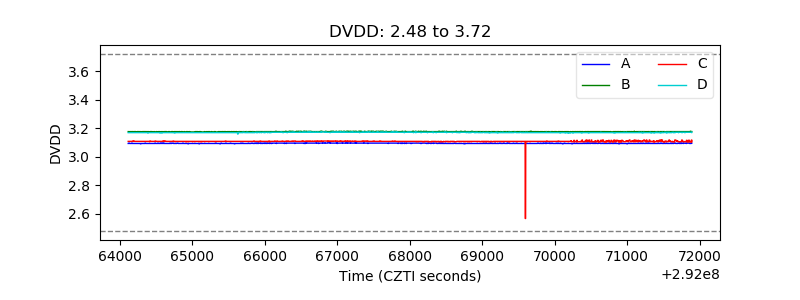 |
| Temperature 1 | 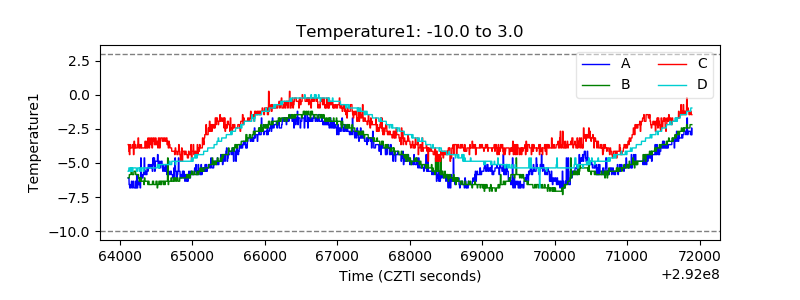 |
| Veto HV Monitor | 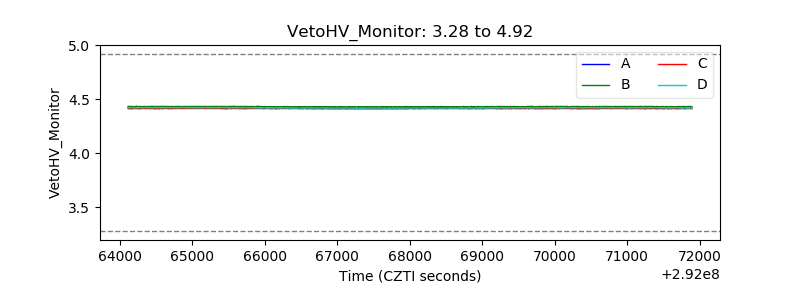 |
| Veto LLD | 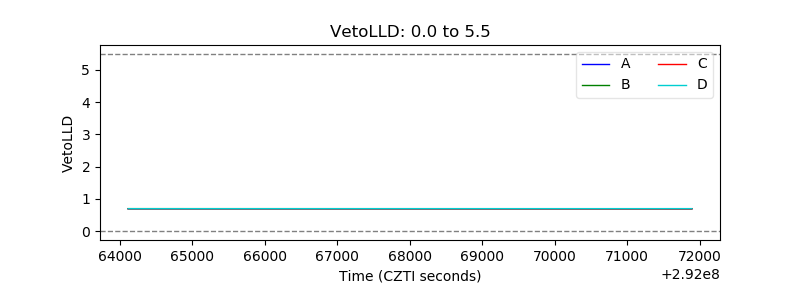 |
| Alpha Counter | 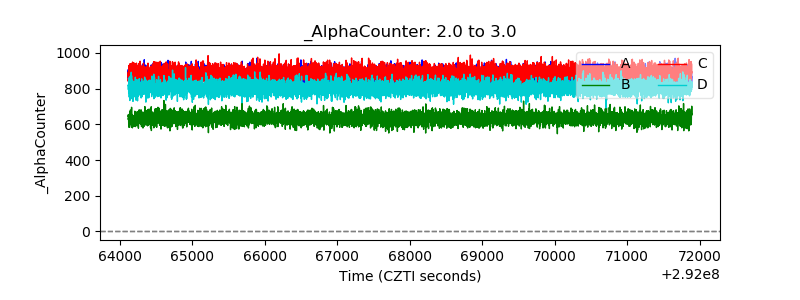 |
| _CPM_Rate | 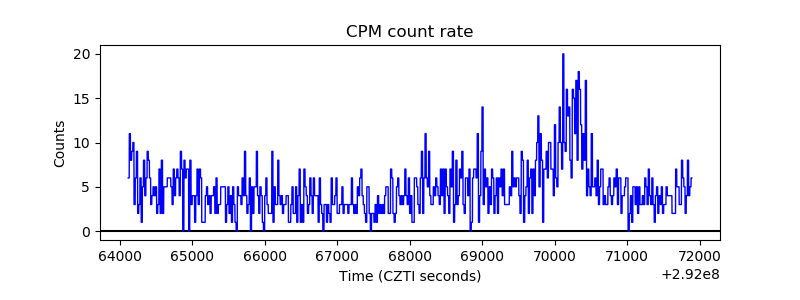 |
| CZT Counter | 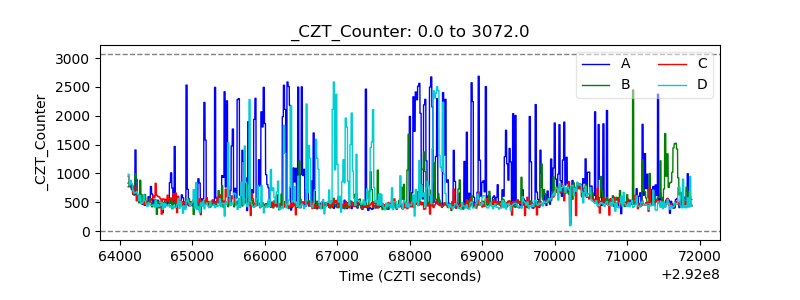 |
| +2.5 Volts monitor | 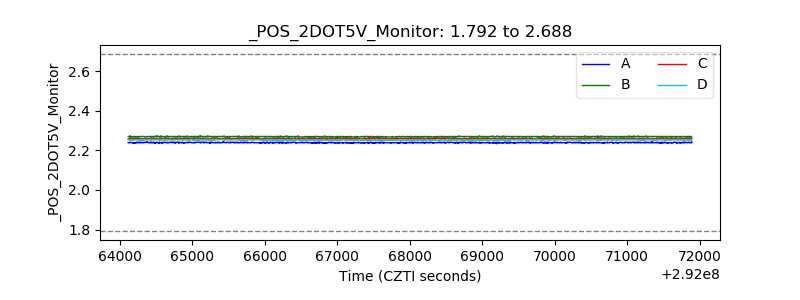 |
| +5 Volts monitor |  |
| _ROLL_ROT |  |
| _Roll_DEC | 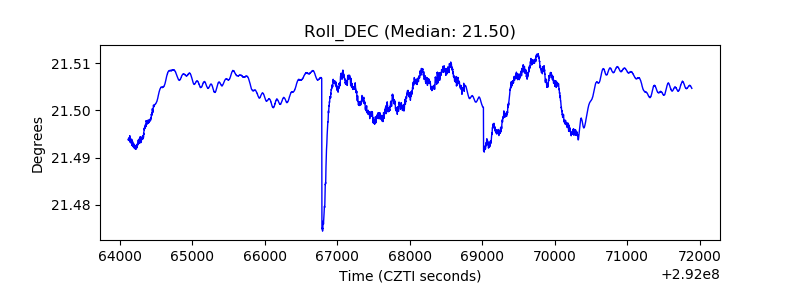 |
| _Roll_RA | 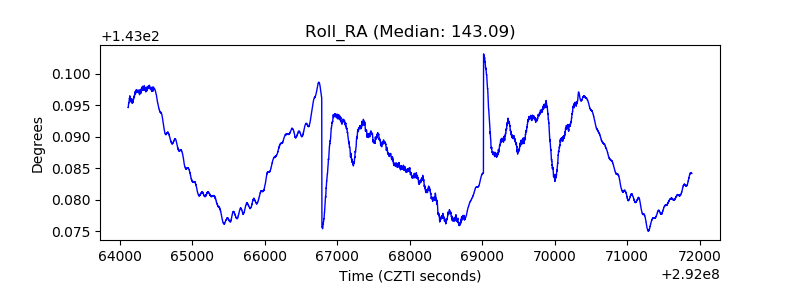 |
| Veto Counter | 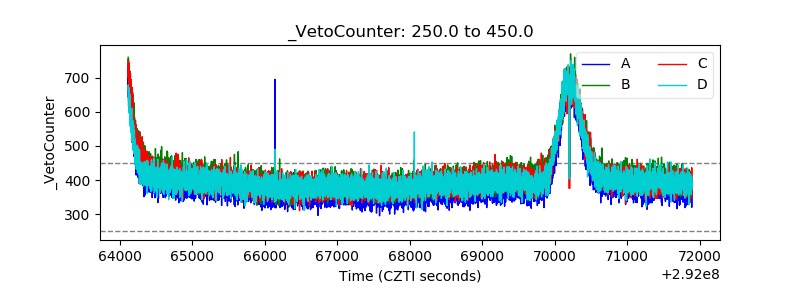 |