| Param | Original file | Final file |
|---|---|---|
| Filename | modeM0/AS1A06_003T05_9000002830_19010cztM0_level2.evt | modeM0/AS1A06_003T05_9000002830_19010cztM0_level2_quad_clean.evt |
| Size (bytes) | 618,266,880 | 92,171,520 |
| Size | 589.6 MB | 87.9 MB |
| Events in quadrant A | 4,806,784 | 567,944 |
| Events in quadrant B | 4,943,477 | 574,133 |
| Events in quadrant C | 3,927,409 | 557,520 |
| Events in quadrant D | 4,512,385 | 543,731 |
| Mode M9 | |||
|---|---|---|---|
| Quadrant | BADHDUFLAG | Total packets | Discarded packets |
| A | 0 | 1 | 0 |
| B | 0 | 1 | 0 |
| C | 0 | 1 | 0 |
| D | 0 | 1 | 0 |
| Mode SS | |||
|---|---|---|---|
| Quadrant | BADHDUFLAG | Total packets | Discarded packets |
| A | 0 | 158 | 0 |
| B | 0 | 158 | 0 |
| C | 0 | 158 | 0 |
| D | 0 | 158 | 0 |
| Mode M0 | |||
|---|---|---|---|
| Quadrant | BADHDUFLAG | Total packets | Discarded packets |
| A | 0 | 19468 | 6 |
| B | 0 | 19618 | 1 |
| C | 0 | 16468 | 1 |
| D | 0 | 18643 | 5 |
| Quadrant | Total seconds | Saturated seconds | Saturation percentage |
|---|---|---|---|
| A | 7880 | 596 | 7.563452% |
| B | 7883 | 453 | 5.746543% |
| C | 7883 | 268 | 3.399721% |
| D | 7882 | 292 | 3.704643% |
Noise dominated data is calculated using 1-second bins in cleaned event files. If a bin has >2000 counts, and if more than 50% of those come from <1% of pixels, then it is considered to be noise-dominated and hence unusable.
| Quadrant | # 1 sec bins | Bins with >0 counts | Bins with >2000 counts | High rate bins dominated by noise | Noise dominated (total time) | Noise dominated (detector-on time) | Marked lightcurve |
|---|---|---|---|---|---|---|---|
| A | 7927 | 7884 | 209 | 209 | 2.64% | 2.65% | 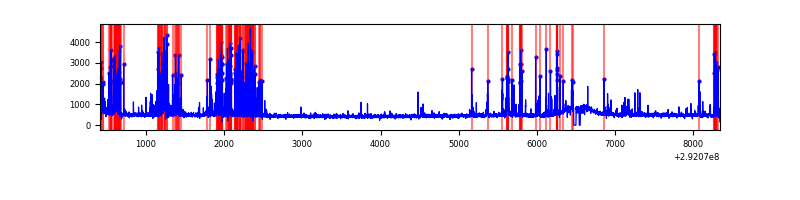 |
| B | 7928 | 7885 | 147 | 147 | 1.85% | 1.86% | 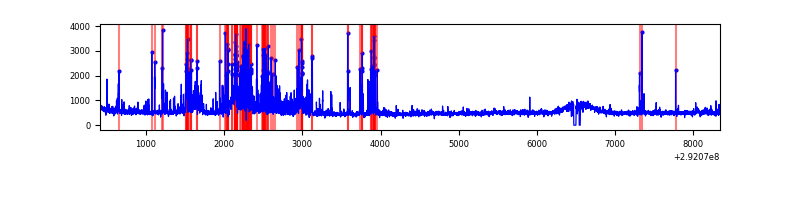 |
| C | 7928 | 7885 | 1 | 1 | 0.01% | 0.01% | 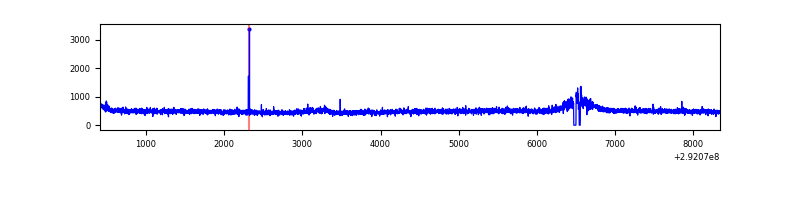 |
| D | 7928 | 7885 | 83 | 83 | 1.05% | 1.05% | 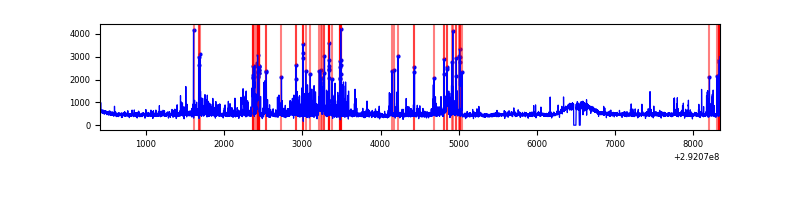 |
Top three noisy pixels from each quadrant. If the there are fewer than three noisy pixels in the level2.evt file, extra rows are filled as -1
| Pixel properties | Quadrant properties | ||||||
|---|---|---|---|---|---|---|---|
| Quadrant | DetID | PixID | Counts | Sigma | Mean | Median | Sigma |
| A | 14 | 235 | 1103287 | 5690.1 | 955 | 933 | 193.7 |
| A | 9 | 143 | 23526 | 116.62 | 955 | 933 | 193.7 |
| A | 0 | 226 | 8270 | 37.87 | 955 | 933 | 193.7 |
| B | 3 | 112 | 885781 | 4712.31 | 961 | 933 | 187.8 |
| B | 7 | 220 | 136501 | 721.98 | 961 | 933 | 187.8 |
| B | 10 | 245 | 68509 | 359.88 | 961 | 933 | 187.8 |
| C | 14 | 238 | 145052 | 657.91 | 930 | 934 | 219.1 |
| C | 3 | 233 | 126554 | 573.47 | 930 | 934 | 219.1 |
| C | 0 | 207 | 10497 | 43.66 | 930 | 934 | 219.1 |
| D | 7 | 238 | 693270 | 2951.44 | 947 | 915 | 234.6 |
| D | 7 | 38 | 122608 | 518.76 | 947 | 915 | 234.6 |
| D | 1 | 52 | 53948 | 226.07 | 947 | 915 | 234.6 |
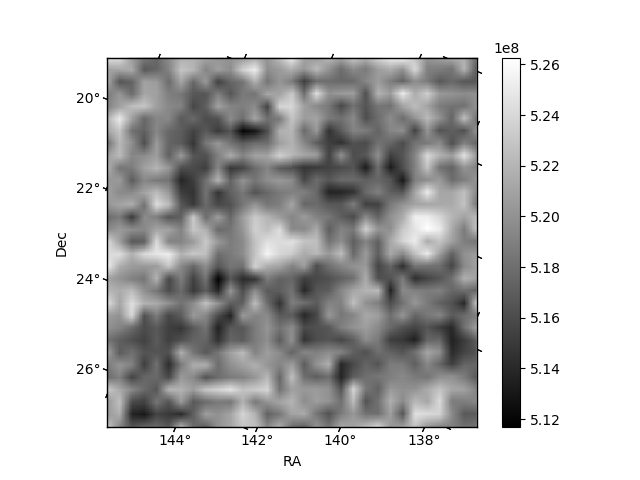
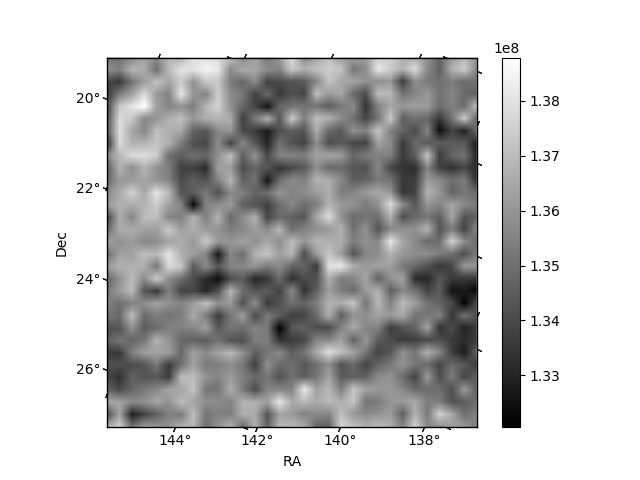
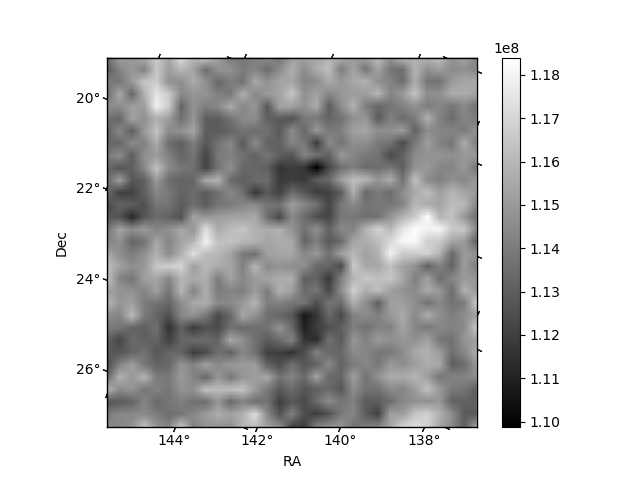
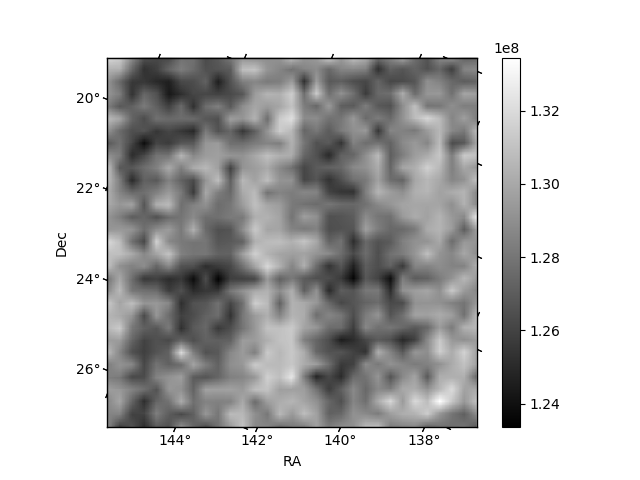
Histogram calculated using DETX and DETY for each event in the final _common_clean file
| Quadrant A | 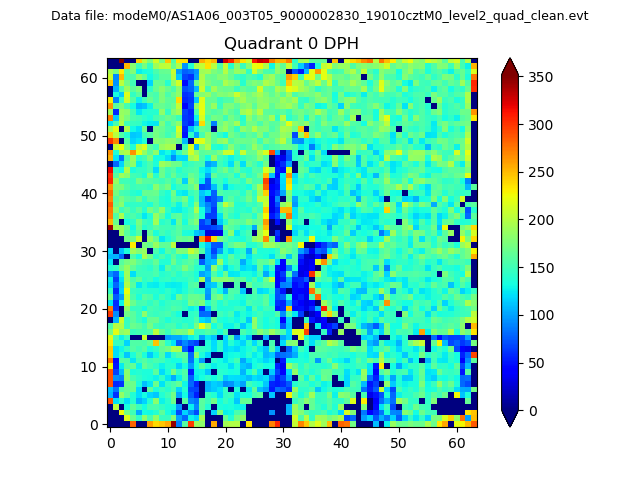 |
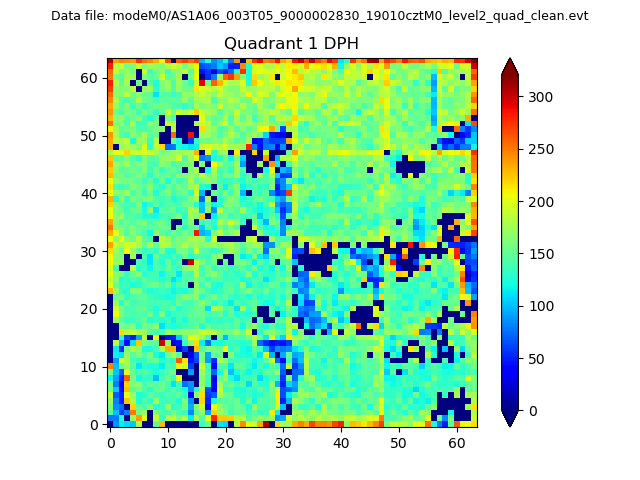 |
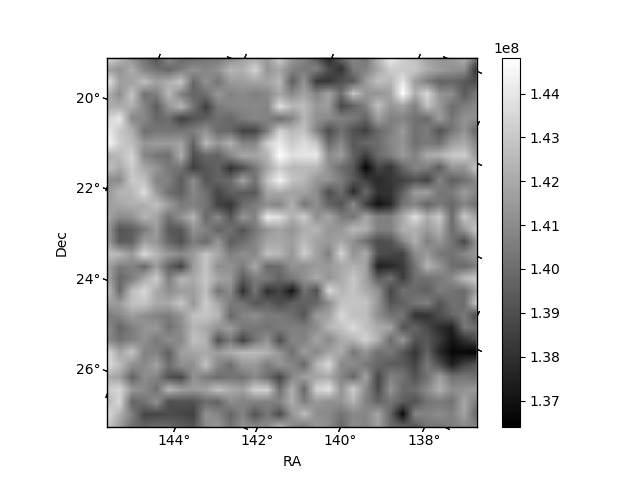
Quadrant B |
|---|---|---|---|
| Quadrant D | 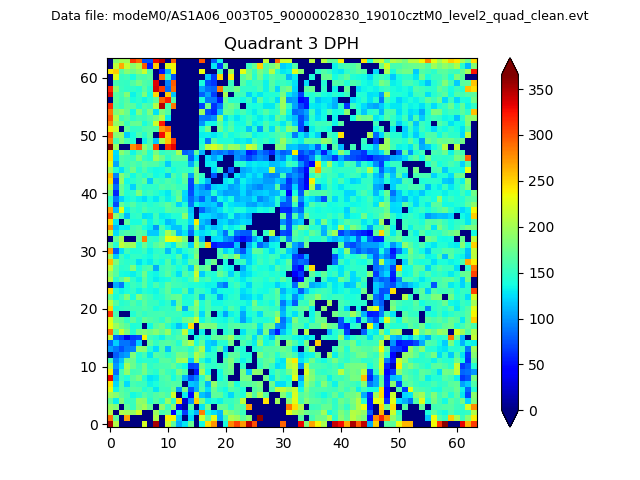 |
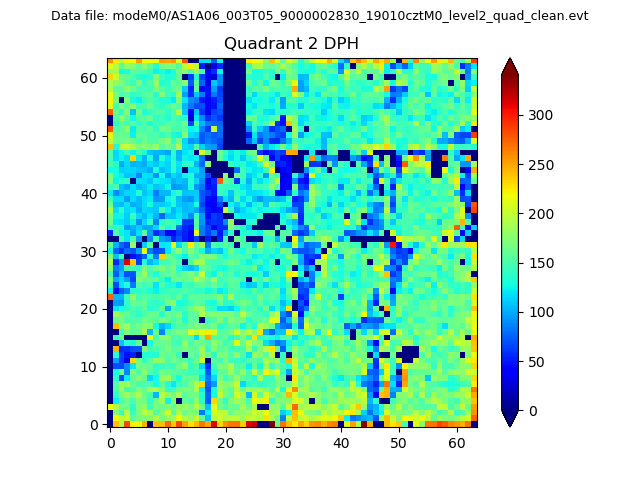 |
Quadrant C |
| Plot type | Count rate plots | Images |
|---|---|---|
| Comparison with Poisson distribution Blue bars denote a histogram of data divided into 1 sec bins. Red curve is a Poisson curve with rate = median count rate of data. |
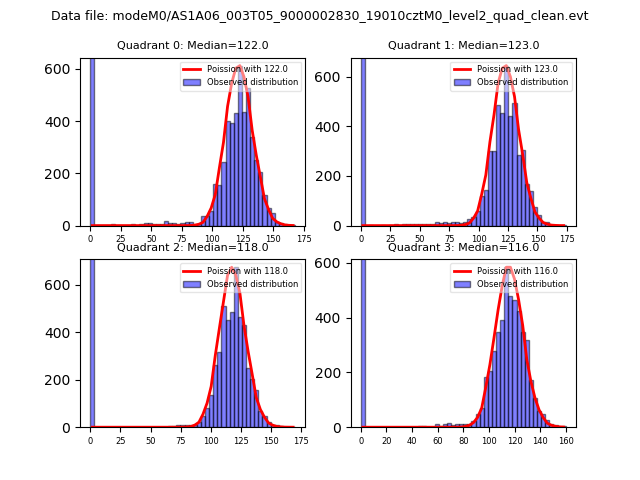 |
 |
| Quadrant-wise count rates Data is divided into 100 sec bins |
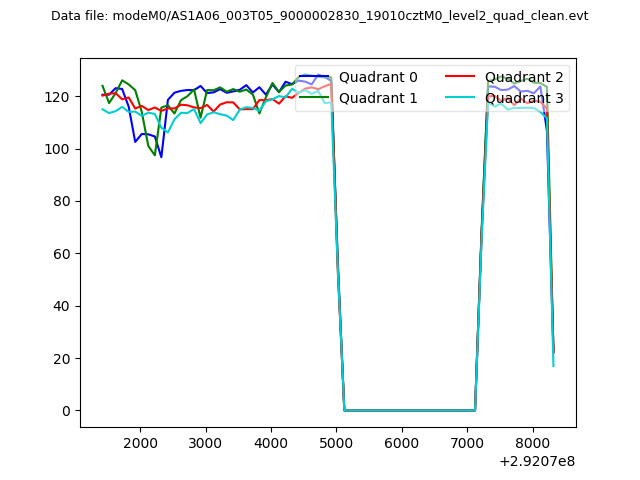 |
|
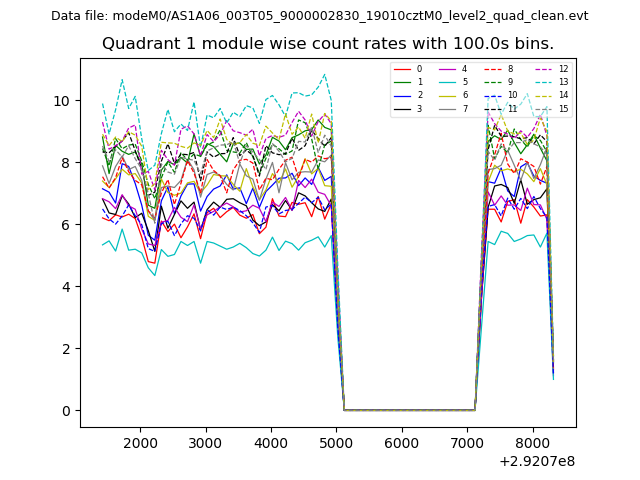
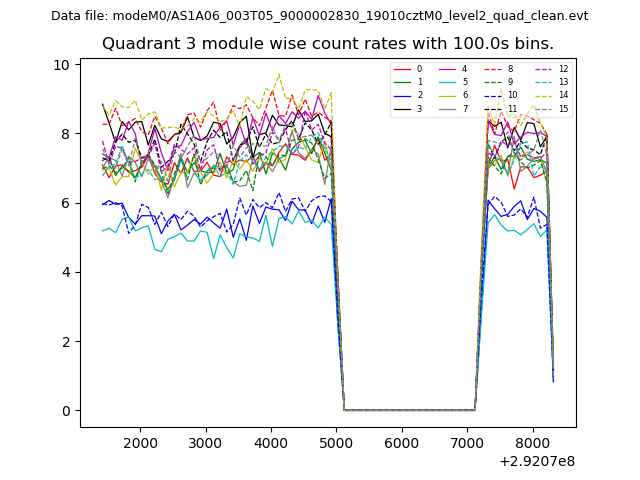
| Module-wise count rates for Quadrant A Data is divided into 100 sec bins |
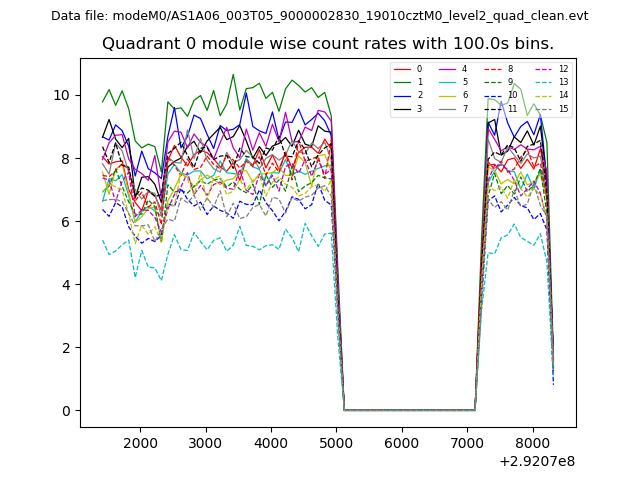 |
 |
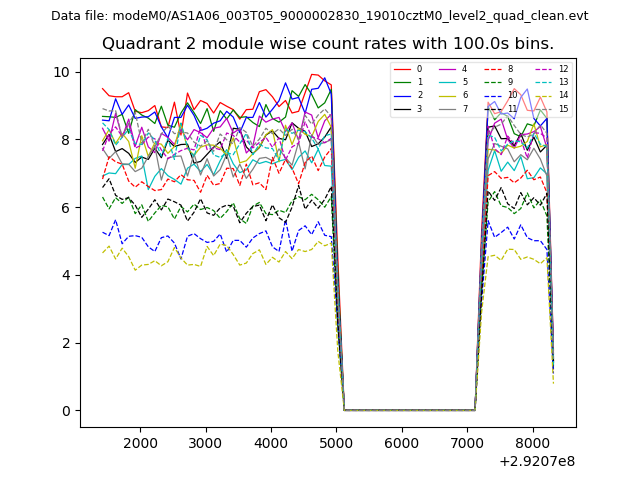
| Module-wise count rates for Quadrant B Data is divided into 100 sec bins |
 |
 |
| Module-wise count rates for Quadrant C Data is divided into 100 sec bins |
 |
 |
| Module-wise count rates for Quadrant D Data is divided into 100 sec bins |
 |
 |
| Parameter | Plot |
|---|---|
| CZT HV Monitor | 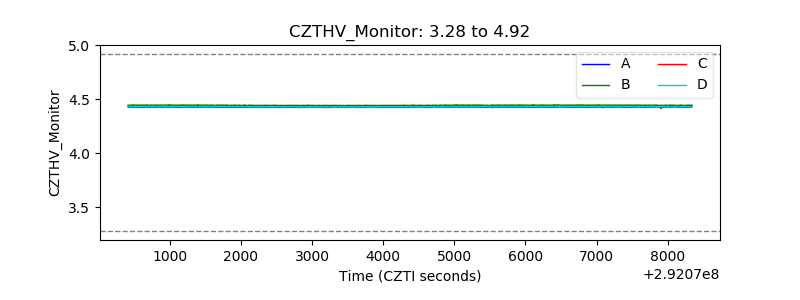 |
| D_VDD | 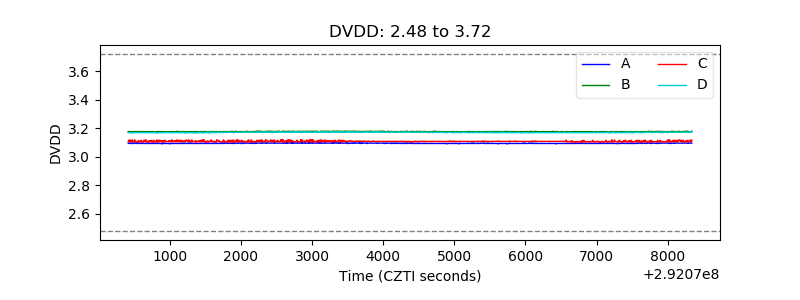 |
| Temperature 1 | 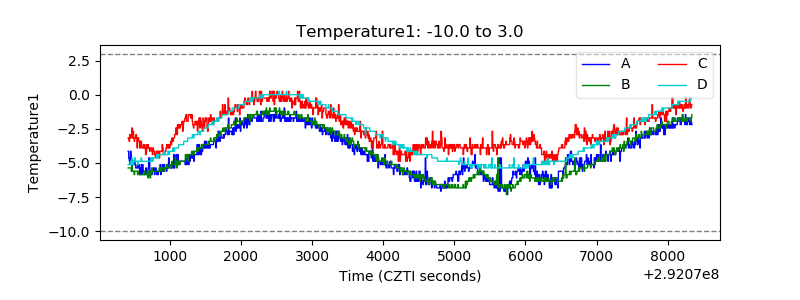 |
| Veto HV Monitor | 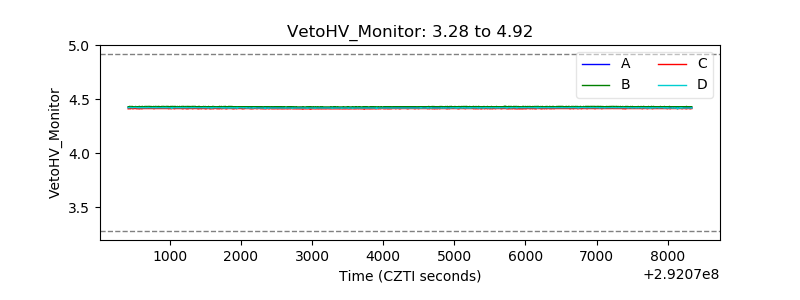 |
| Veto LLD | 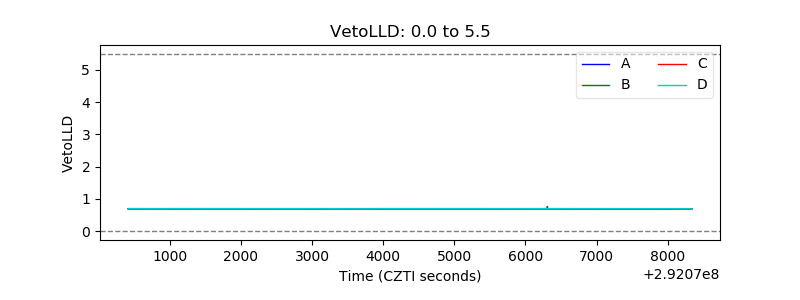 |
| Alpha Counter | 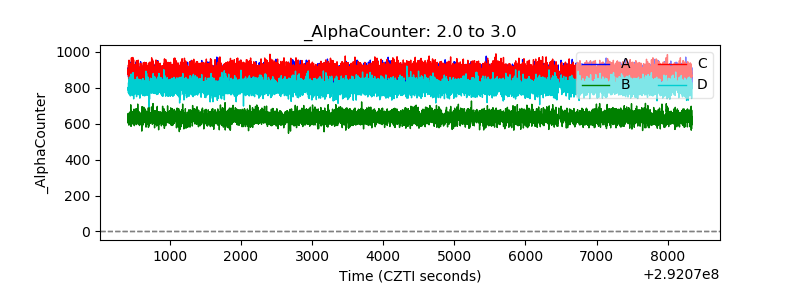 |
| _CPM_Rate | 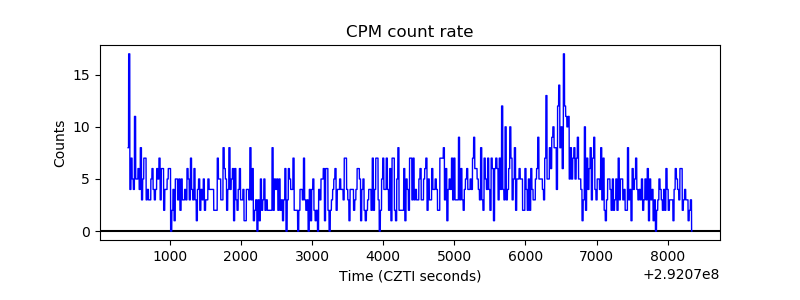 |
| CZT Counter | 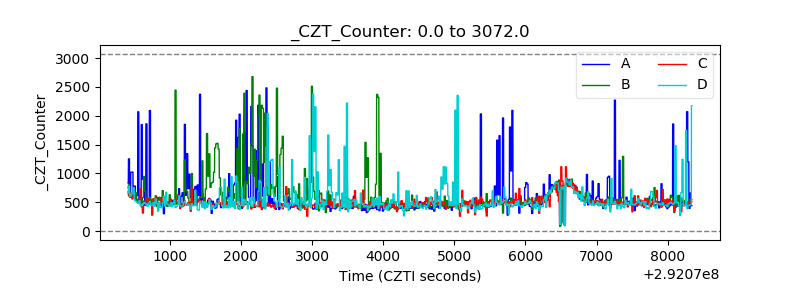 |
| +2.5 Volts monitor |  |
| +5 Volts monitor |  |
| _ROLL_ROT | 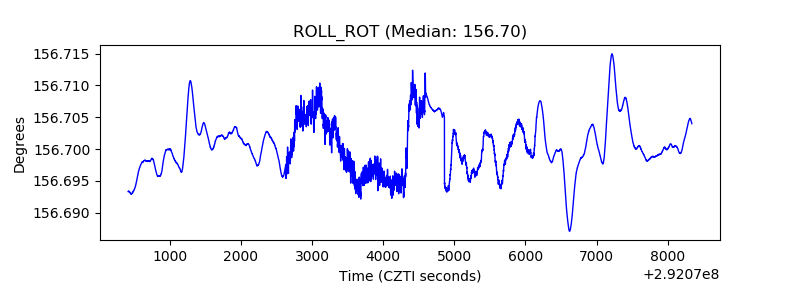 |
| _Roll_DEC | 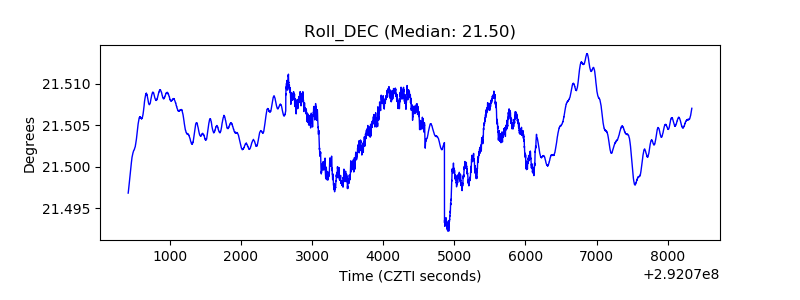 |
| _Roll_RA | 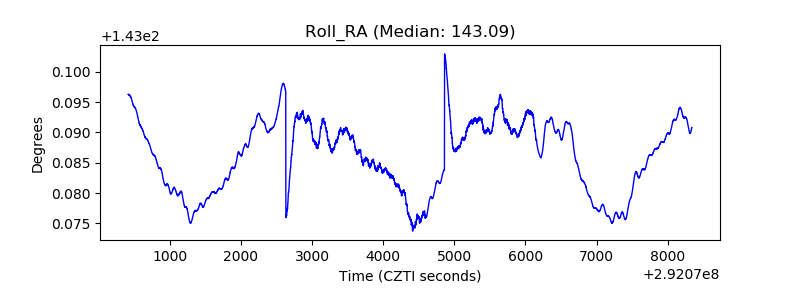 |
| Veto Counter | 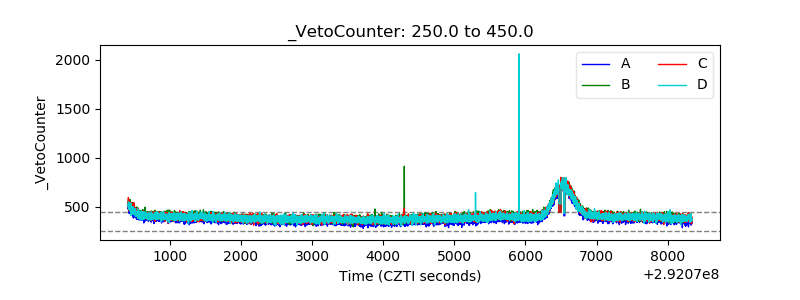 |