| Param | Original file | Final file |
|---|---|---|
| Filename | modeM0/AS1A06_003T05_9000002830_19013cztM0_level2.evt | modeM0/AS1A06_003T05_9000002830_19013cztM0_level2_quad_clean.evt |
| Size (bytes) | 1,633,449,600 | 232,125,120 |
| Size | 1.5 GB | 221.4 MB |
| Events in quadrant A | 14,622,558 | 1,422,950 |
| Events in quadrant B | 9,689,954 | 1,504,469 |
| Events in quadrant C | 9,327,849 | 1,438,531 |
| Events in quadrant D | 14,574,847 | 1,382,138 |
| Mode M9 | |||
|---|---|---|---|
| Quadrant | BADHDUFLAG | Total packets | Discarded packets |
| A | 0 | 17 | 0 |
| B | 0 | 17 | 0 |
| C | 0 | 17 | 0 |
| D | 0 | 17 | 0 |
| Mode SS | |||
|---|---|---|---|
| Quadrant | BADHDUFLAG | Total packets | Discarded packets |
| A | 0 | 376 | 0 |
| B | 0 | 376 | 0 |
| C | 0 | 376 | 0 |
| D | 0 | 376 | 0 |
| Mode M0 | |||
|---|---|---|---|
| Quadrant | BADHDUFLAG | Total packets | Discarded packets |
| A | 0 | 55844 | 4 |
| B | 0 | 40846 | 4 |
| C | 0 | 39379 | 4 |
| D | 0 | 55906 | 4 |
| Quadrant | Total seconds | Saturated seconds | Saturation percentage |
|---|---|---|---|
| A | 18605 | 2345 | 12.604139% |
| B | 18605 | 312 | 1.676969% |
| C | 18606 | 332 | 1.784371% |
| D | 18606 | 1170 | 6.288294% |
Noise dominated data is calculated using 1-second bins in cleaned event files. If a bin has >2000 counts, and if more than 50% of those come from <1% of pixels, then it is considered to be noise-dominated and hence unusable.
| Quadrant | # 1 sec bins | Bins with >0 counts | Bins with >2000 counts | High rate bins dominated by noise | Noise dominated (total time) | Noise dominated (detector-on time) | Marked lightcurve |
|---|---|---|---|---|---|---|---|
| A | 20240 | 18607 | 1418 | 1418 | 7.01% | 7.62% | 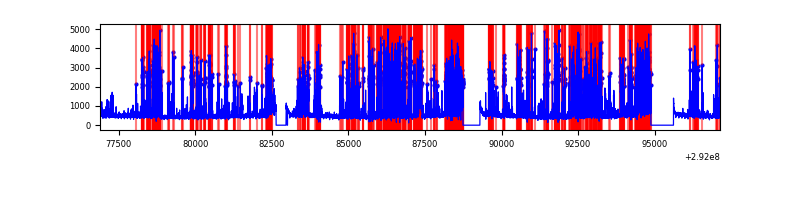 |
| B | 20240 | 18609 | 55 | 55 | 0.27% | 0.30% | 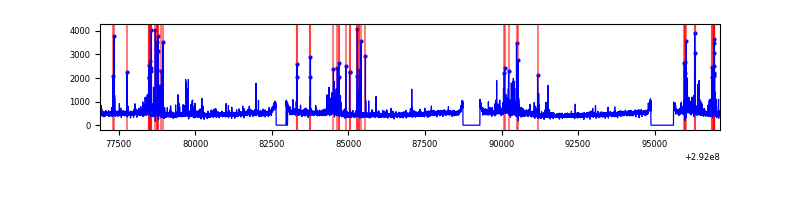 |
| C | 20241 | 18610 | 18 | 18 | 0.09% | 0.10% | 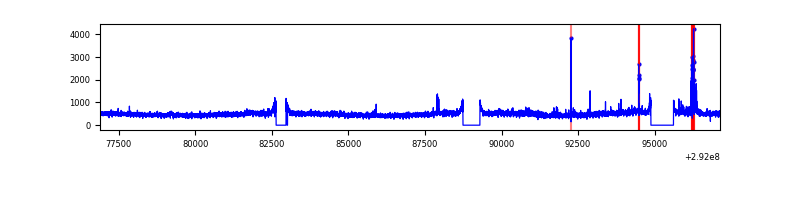 |
| D | 20241 | 18610 | 724 | 724 | 3.58% | 3.89% | 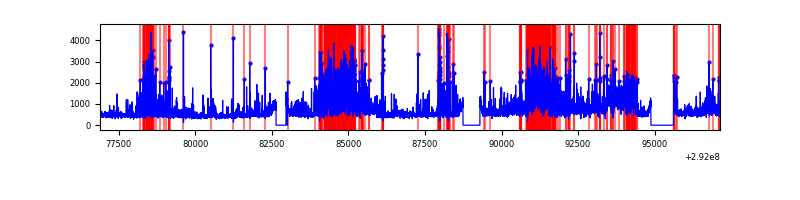 |
Top three noisy pixels from each quadrant. If the there are fewer than three noisy pixels in the level2.evt file, extra rows are filled as -1
| Pixel properties | Quadrant properties | ||||||
|---|---|---|---|---|---|---|---|
| Quadrant | DetID | PixID | Counts | Sigma | Mean | Median | Sigma |
| A | 14 | 235 | 6424043 | 15069.11 | 2112 | 2063 | 426.2 |
| A | 9 | 143 | 48329 | 108.56 | 2112 | 2063 | 426.2 |
| A | 0 | 226 | 18307 | 38.12 | 2112 | 2063 | 426.2 |
| B | 7 | 220 | 489545 | 1154.98 | 2215 | 2156 | 422.0 |
| B | 0 | 189 | 191363 | 448.37 | 2215 | 2156 | 422.0 |
| B | 3 | 112 | 168128 | 393.31 | 2215 | 2156 | 422.0 |
| C | 3 | 233 | 474066 | 943.61 | 2132 | 2143 | 500.1 |
| C | 14 | 238 | 330544 | 656.64 | 2132 | 2143 | 500.1 |
| C | 5 | 112 | 175245 | 346.12 | 2132 | 2143 | 500.1 |
| D | 7 | 238 | 4938849 | 9481.7 | 2140 | 2075 | 520.7 |
| D | 1 | 52 | 1338435 | 2566.65 | 2140 | 2075 | 520.7 |
| D | 2 | 234 | 77597 | 145.05 | 2140 | 2075 | 520.7 |
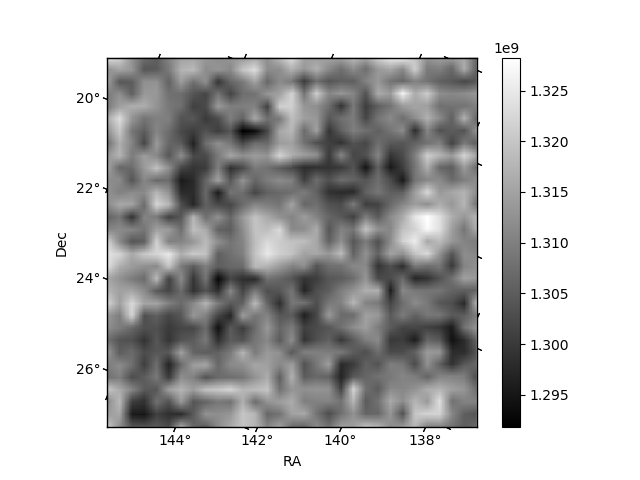
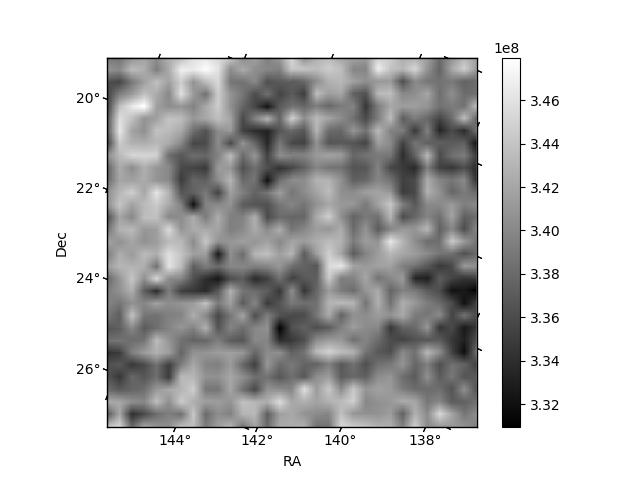
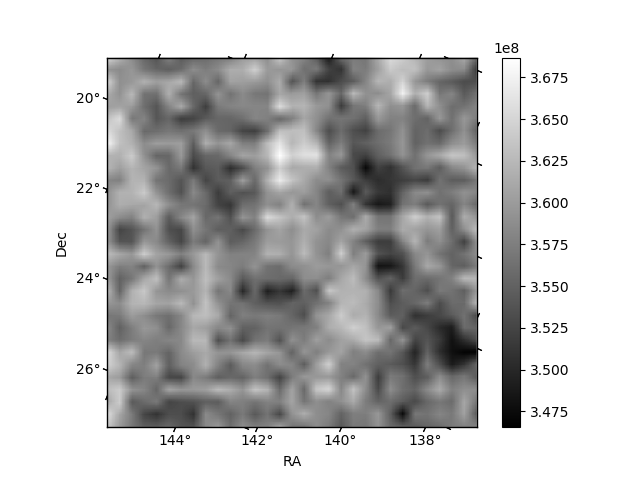
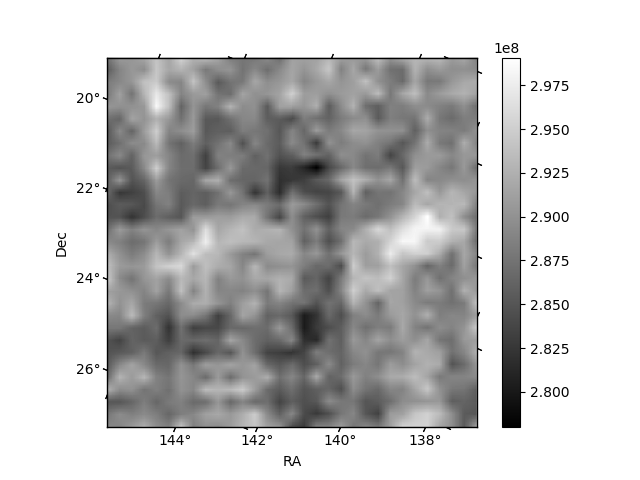
Histogram calculated using DETX and DETY for each event in the final _common_clean file
| Quadrant A | 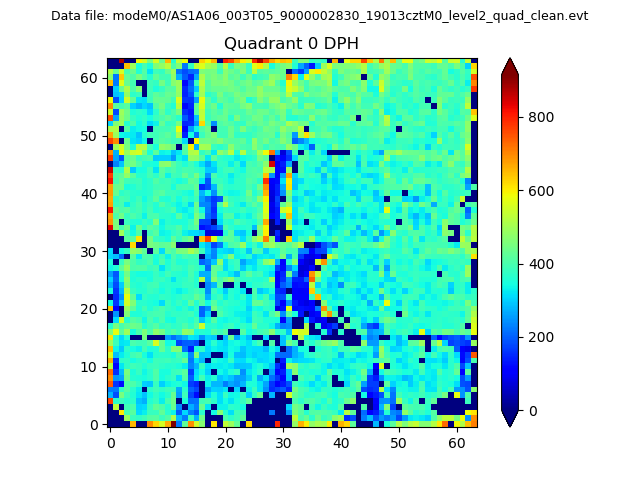 |
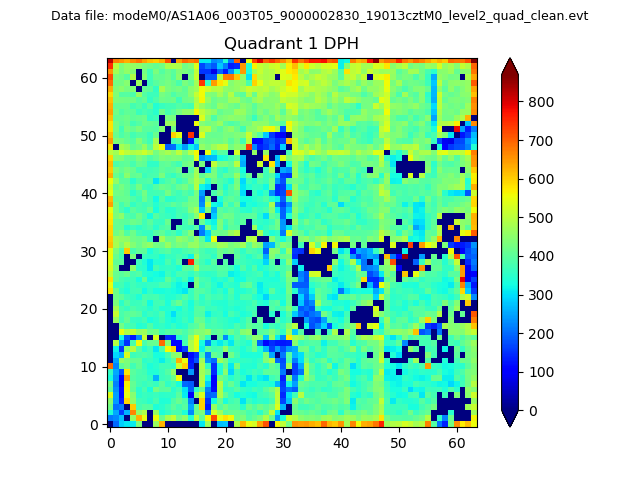 |
Quadrant B |
|---|---|---|---|
| Quadrant D | 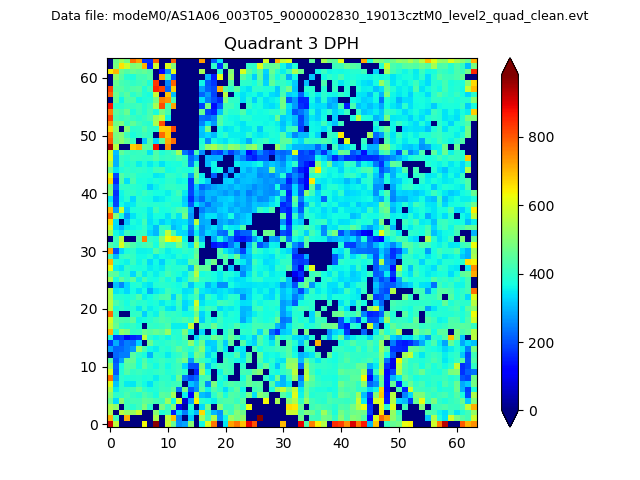 |
 |
Quadrant C |
| Plot type | Count rate plots | Images |
|---|---|---|
| Comparison with Poisson distribution Blue bars denote a histogram of data divided into 1 sec bins. Red curve is a Poisson curve with rate = median count rate of data. |
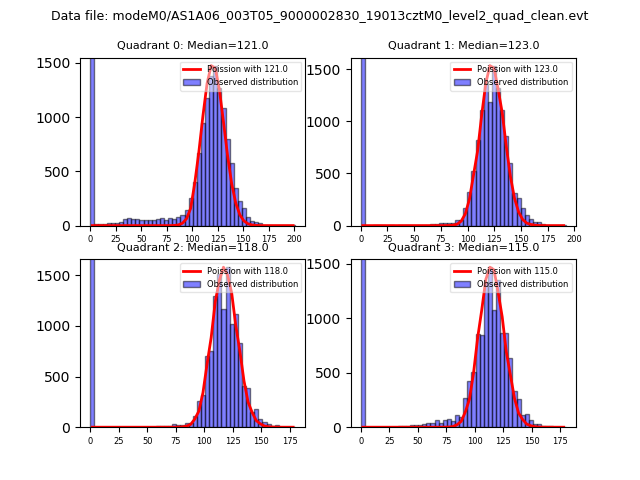 |
 |
| Quadrant-wise count rates Data is divided into 100 sec bins |
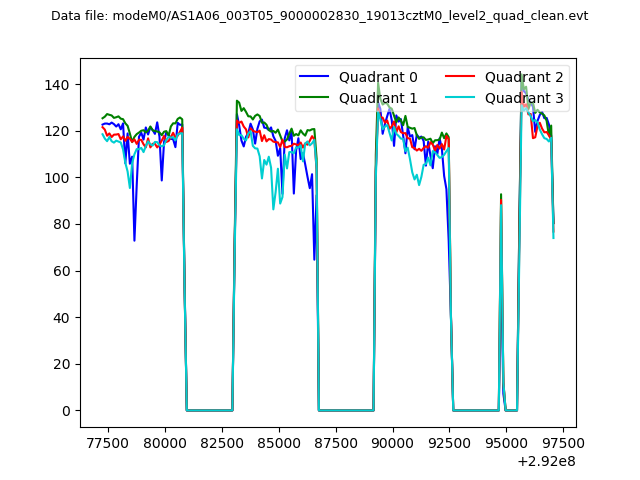 |
|
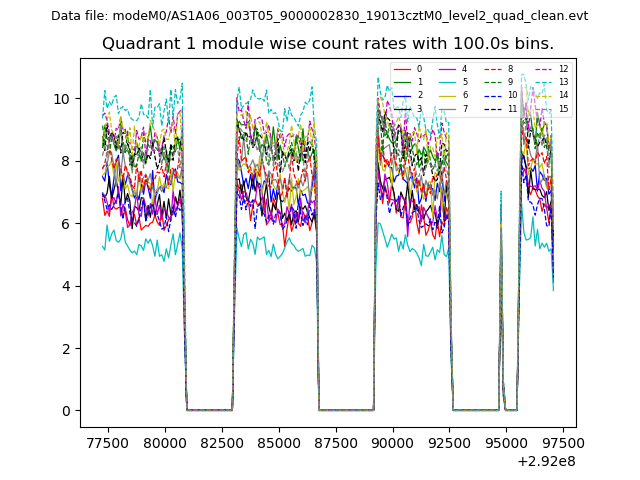
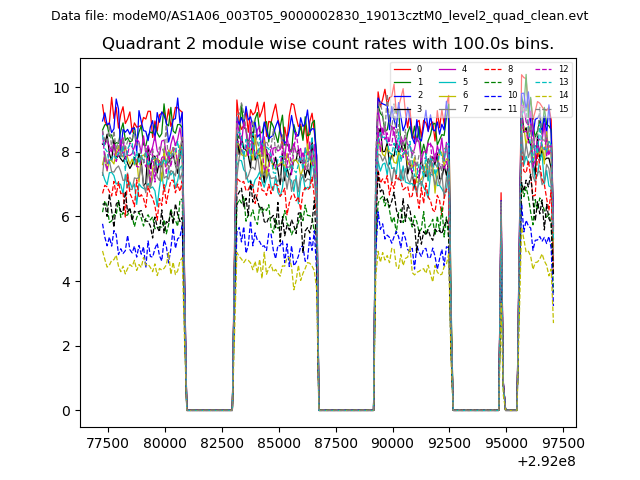
| Module-wise count rates for Quadrant A Data is divided into 100 sec bins |
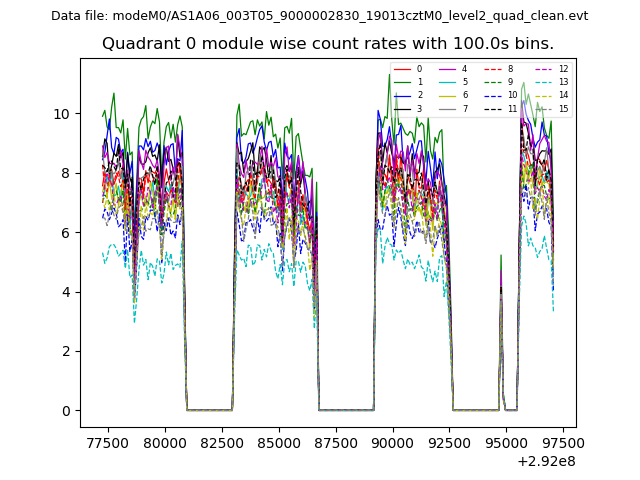 |
 |
| Module-wise count rates for Quadrant B Data is divided into 100 sec bins |
 |
 |
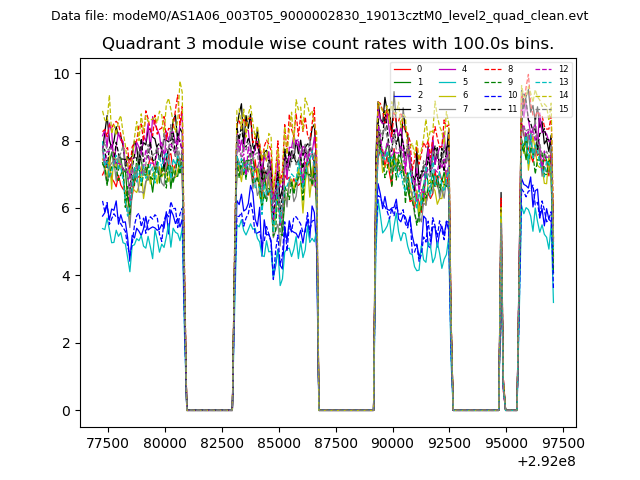
| Module-wise count rates for Quadrant C Data is divided into 100 sec bins |
 |
 |
| Module-wise count rates for Quadrant D Data is divided into 100 sec bins |
 |
 |
| Parameter | Plot |
|---|---|
| CZT HV Monitor | 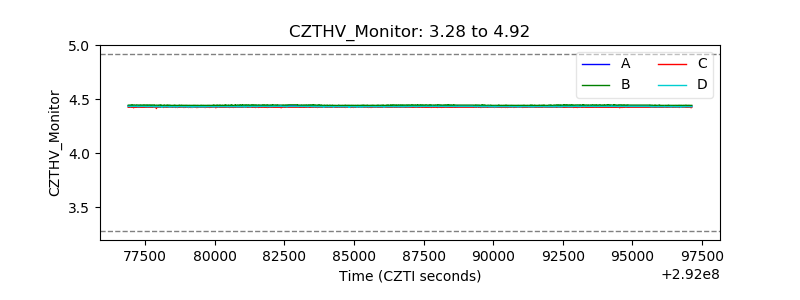 |
| D_VDD | 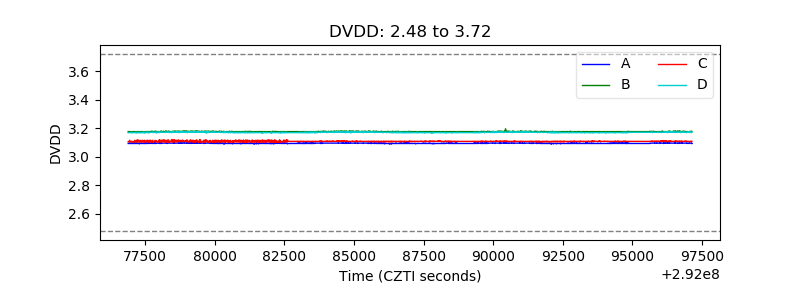 |
| Temperature 1 |  |
| Veto HV Monitor | 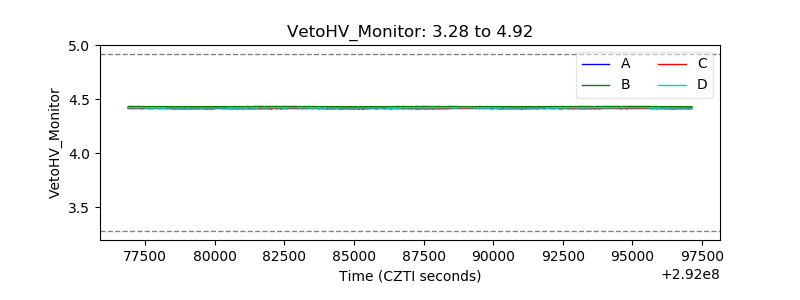 |
| Veto LLD | 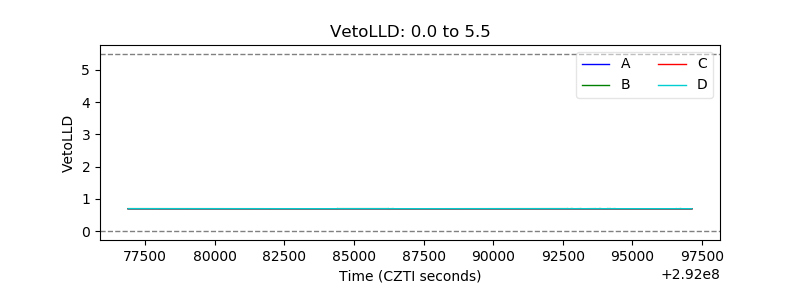 |
| Alpha Counter | 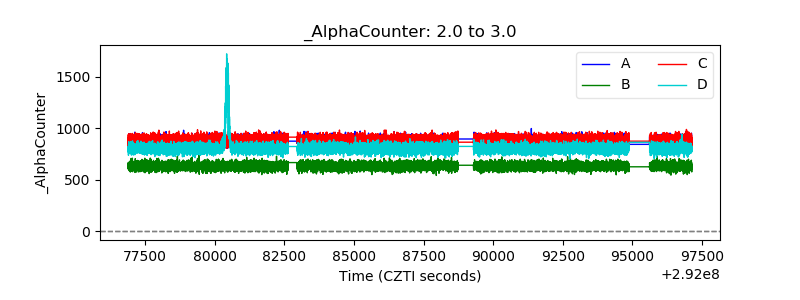 |
| _CPM_Rate | 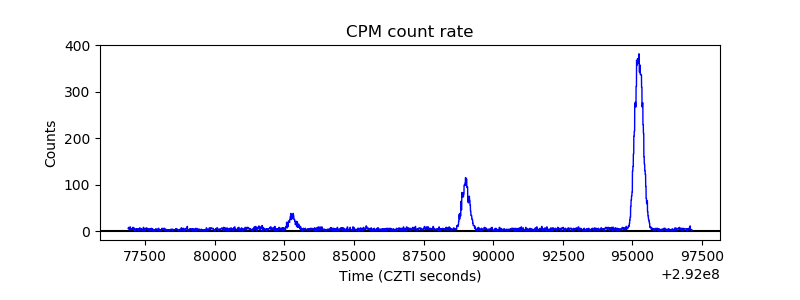 |
| CZT Counter |  |
| +2.5 Volts monitor |  |
| +5 Volts monitor | 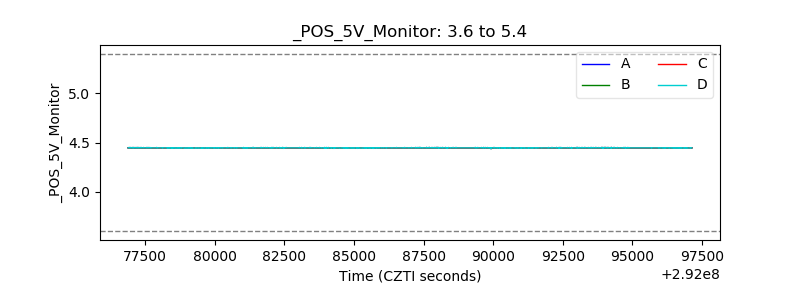 |
| _ROLL_ROT | 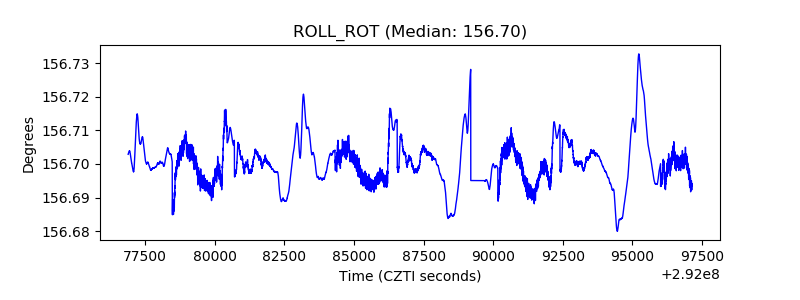 |
| _Roll_DEC | 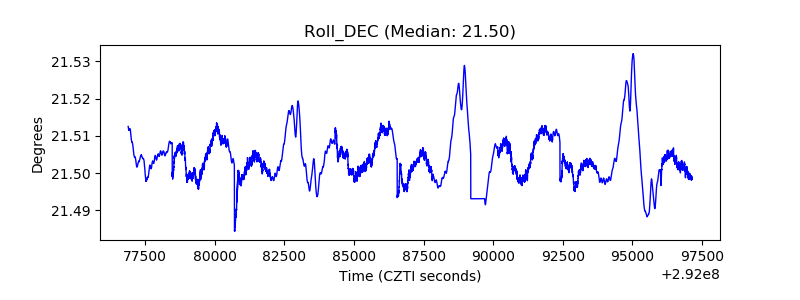 |
| _Roll_RA |  |
| Veto Counter | 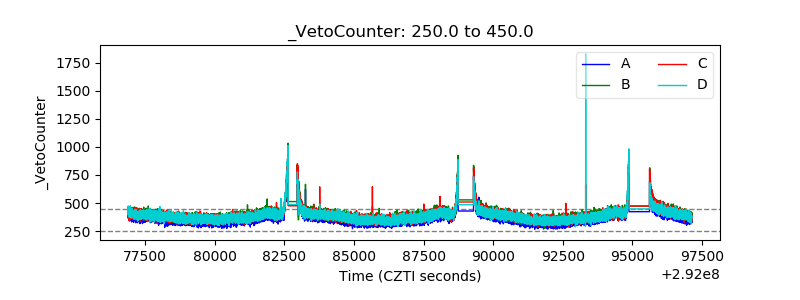 |