| Param | Original file | Final file |
|---|---|---|
| Filename | modeM0/AS1A06_003T05_9000002830_19016cztM0_level2.evt | modeM0/AS1A06_003T05_9000002830_19016cztM0_level2_quad_clean.evt |
| Size (bytes) | 656,539,200 | 90,809,280 |
| Size | 626.1 MB | 86.6 MB |
| Events in quadrant A | 7,445,100 | 536,469 |
| Events in quadrant B | 3,338,806 | 614,173 |
| Events in quadrant C | 3,248,649 | 584,148 |
| Events in quadrant D | 5,399,035 | 549,576 |
| Mode M9 | |||
|---|---|---|---|
| Quadrant | BADHDUFLAG | Total packets | Discarded packets |
| A | 0 | 20 | 0 |
| B | 0 | 20 | 0 |
| C | 0 | 20 | 0 |
| D | 0 | 20 | 0 |
| Mode SS | |||
|---|---|---|---|
| Quadrant | BADHDUFLAG | Total packets | Discarded packets |
| A | 0 | 136 | 0 |
| B | 0 | 136 | 0 |
| C | 0 | 136 | 0 |
| D | 0 | 136 | 0 |
| Mode M0 | |||
|---|---|---|---|
| Quadrant | BADHDUFLAG | Total packets | Discarded packets |
| A | 0 | 26626 | 3 |
| B | 0 | 14310 | 2 |
| C | 0 | 14030 | 2 |
| D | 0 | 20548 | 2 |
| Quadrant | Total seconds | Saturated seconds | Saturation percentage |
|---|---|---|---|
| A | 6675 | 1880 | 28.164794% |
| B | 6675 | 78 | 1.168539% |
| C | 6675 | 87 | 1.303371% |
| D | 6675 | 403 | 6.037453% |
Noise dominated data is calculated using 1-second bins in cleaned event files. If a bin has >2000 counts, and if more than 50% of those come from <1% of pixels, then it is considered to be noise-dominated and hence unusable.
| Quadrant | # 1 sec bins | Bins with >0 counts | Bins with >2000 counts | High rate bins dominated by noise | Noise dominated (total time) | Noise dominated (detector-on time) | Marked lightcurve |
|---|---|---|---|---|---|---|---|
| A | 8660 | 6677 | 1411 | 1411 | 16.29% | 21.13% | 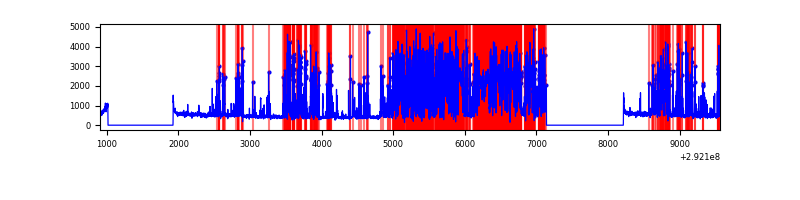 |
| B | 8660 | 6677 | 5 | 5 | 0.06% | 0.07% | 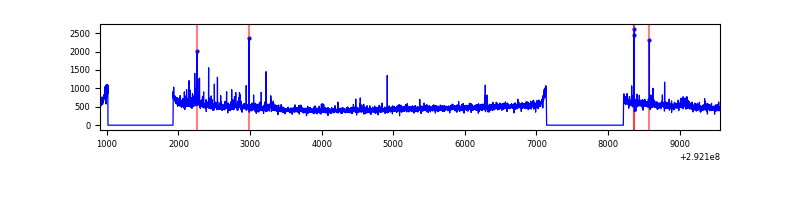 |
| C | 8660 | 6677 | 0 | 0 | 0.00% | 0.00% | 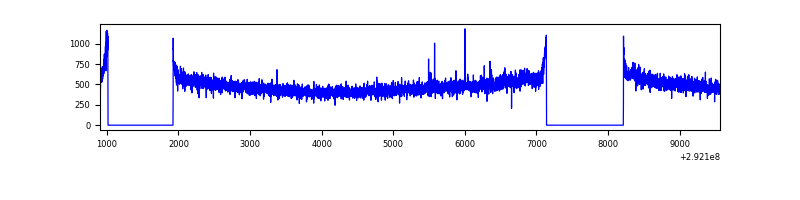 |
| D | 8660 | 6677 | 288 | 288 | 3.33% | 4.31% | 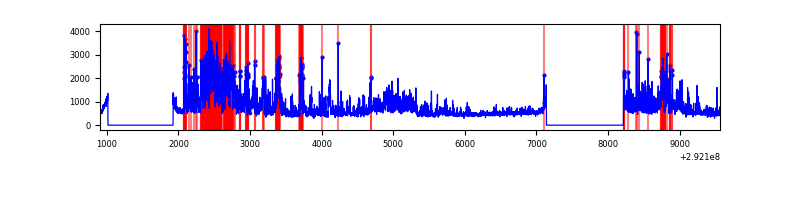 |
Top three noisy pixels from each quadrant. If the there are fewer than three noisy pixels in the level2.evt file, extra rows are filled as -1
| Pixel properties | Quadrant properties | ||||||
|---|---|---|---|---|---|---|---|
| Quadrant | DetID | PixID | Counts | Sigma | Mean | Median | Sigma |
| A | 14 | 235 | 4814460 | 35028.11 | 677 | 663 | 137.4 |
| A | 8 | 192 | 12114 | 83.32 | 677 | 663 | 137.4 |
| A | 15 | 191 | 6623 | 43.37 | 677 | 663 | 137.4 |
| B | 0 | 189 | 40936 | 259.14 | 816 | 795 | 154.9 |
| B | 7 | 220 | 37141 | 234.64 | 816 | 795 | 154.9 |
| B | 3 | 112 | 20768 | 128.94 | 816 | 795 | 154.9 |
| C | 14 | 238 | 121617 | 652.9 | 785 | 791 | 185.1 |
| C | 3 | 233 | 58288 | 310.69 | 785 | 791 | 185.1 |
| C | 13 | 61 | 5494 | 25.41 | 785 | 791 | 185.1 |
| D | 7 | 238 | 1654021 | 8632.2 | 780 | 753 | 191.5 |
| D | 1 | 52 | 771490 | 4024.25 | 780 | 753 | 191.5 |
| D | 2 | 234 | 28933 | 147.14 | 780 | 753 | 191.5 |
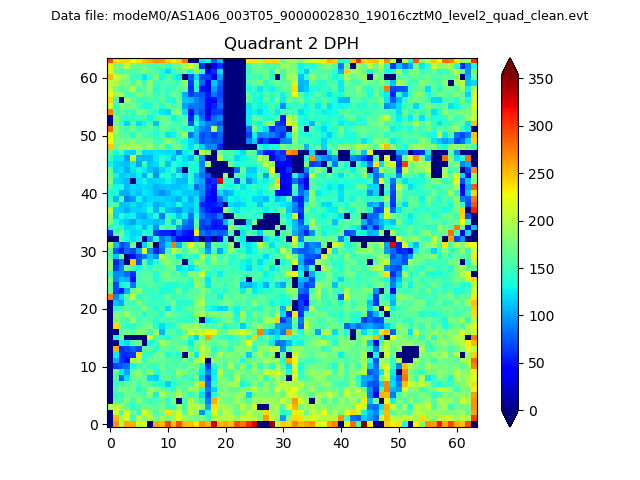
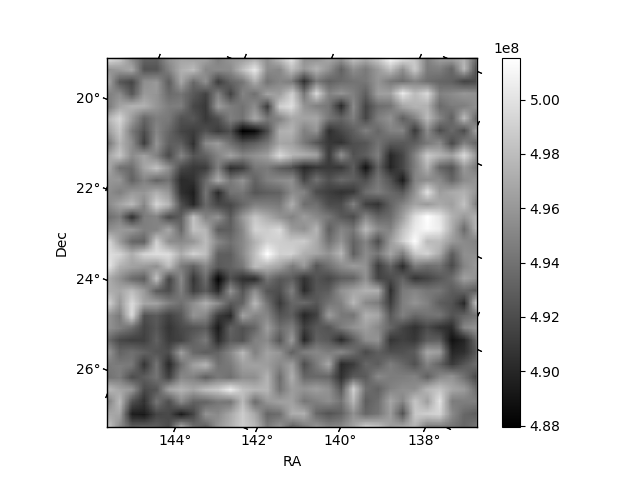
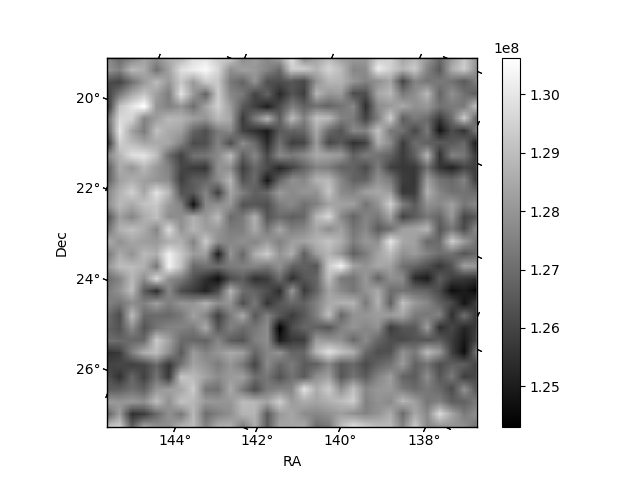
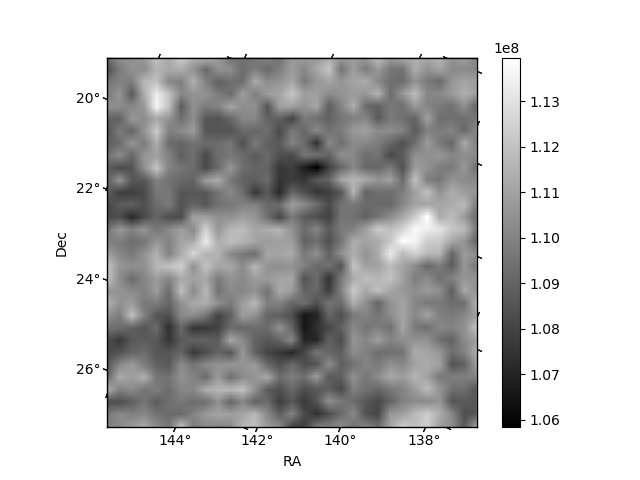
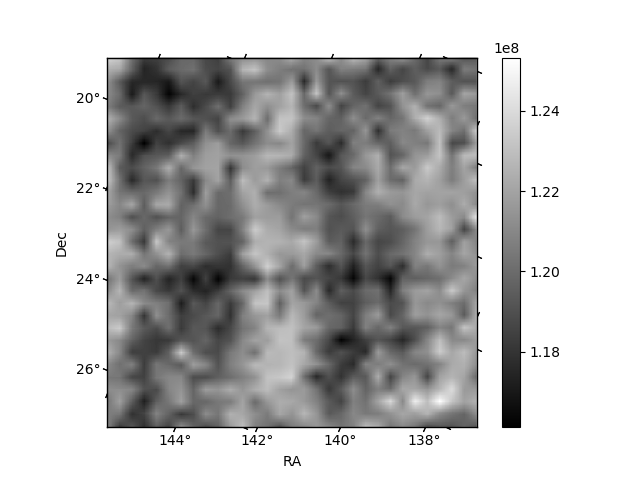
Histogram calculated using DETX and DETY for each event in the final _common_clean file
| Quadrant A | 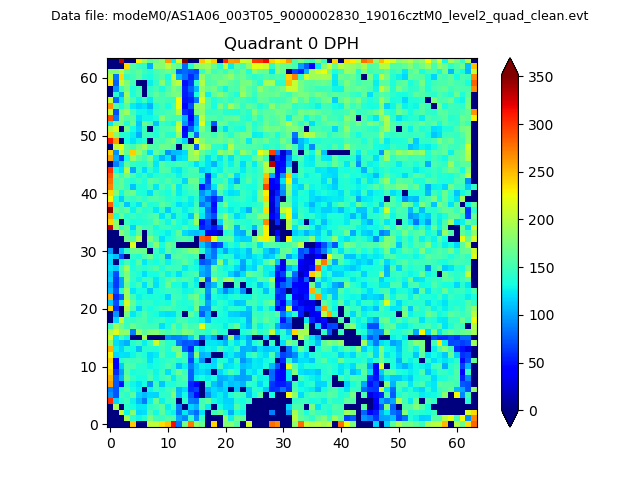 |
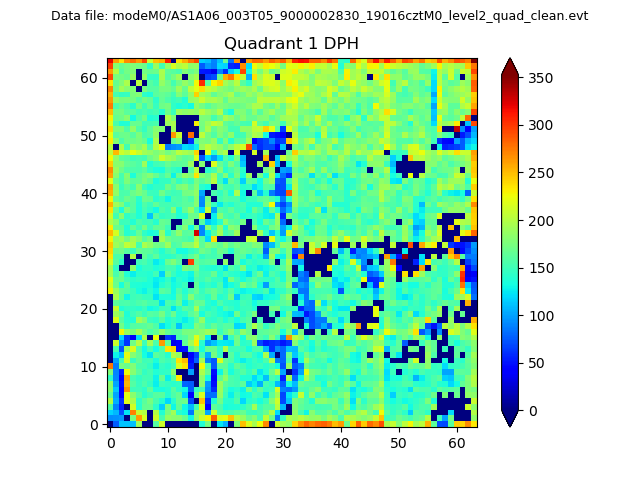 |
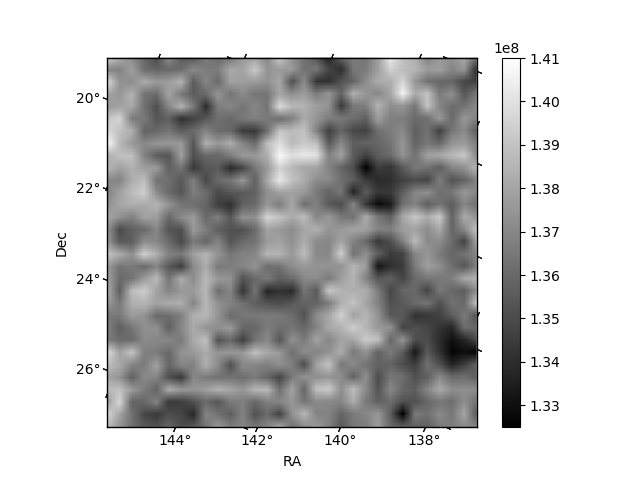
Quadrant B |
|---|---|---|---|
| Quadrant D | 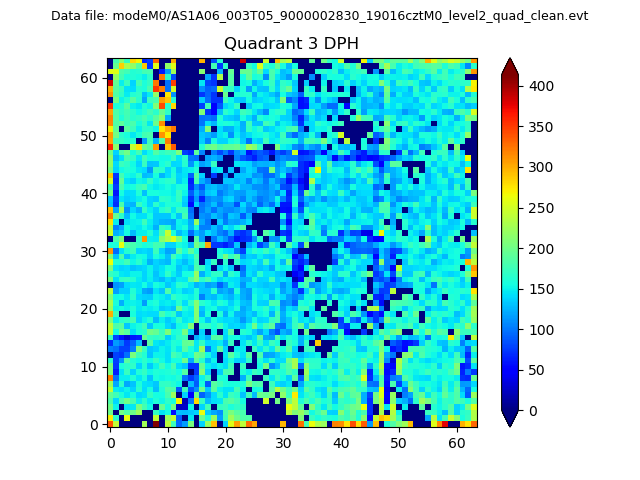 |
 |
Quadrant C |
| Plot type | Count rate plots | Images |
|---|---|---|
| Comparison with Poisson distribution Blue bars denote a histogram of data divided into 1 sec bins. Red curve is a Poisson curve with rate = median count rate of data. |
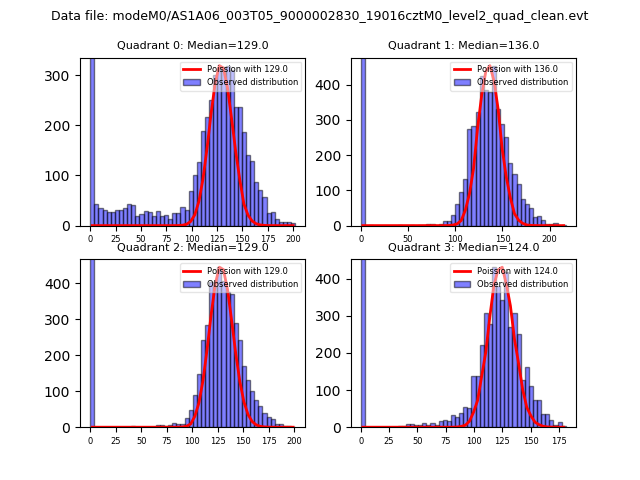 |
 |
| Quadrant-wise count rates Data is divided into 100 sec bins |
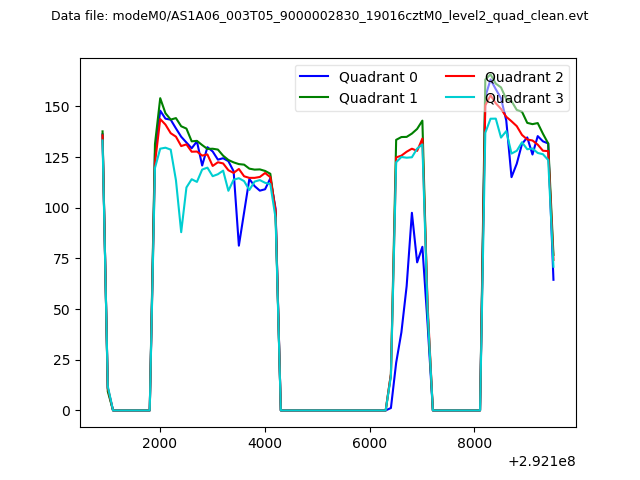 |
|
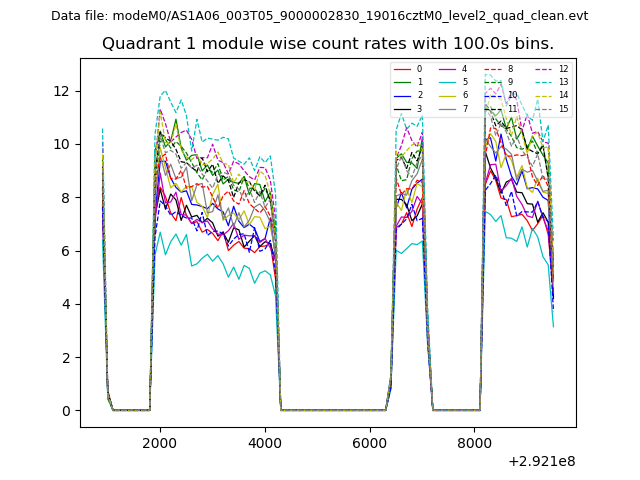
| Module-wise count rates for Quadrant A Data is divided into 100 sec bins |
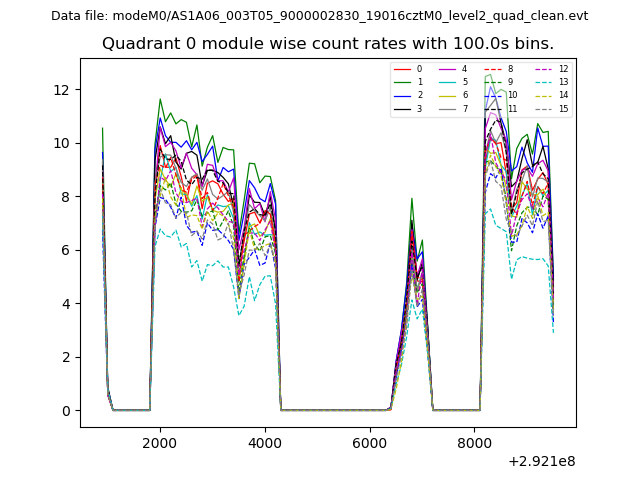 |
 |
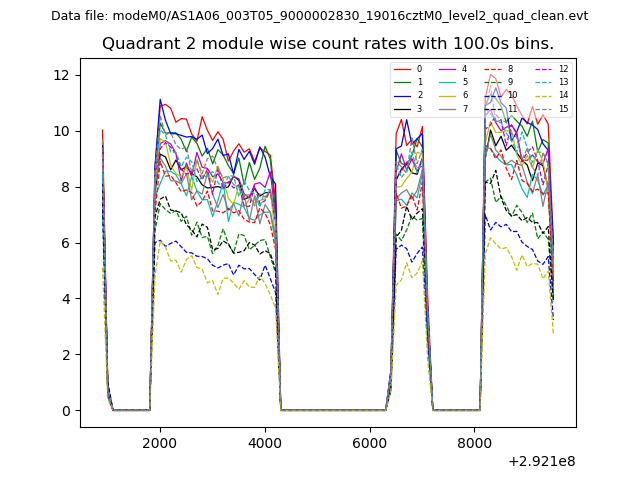
| Module-wise count rates for Quadrant B Data is divided into 100 sec bins |
 |
 |
| Module-wise count rates for Quadrant C Data is divided into 100 sec bins |
 |
 |
| Module-wise count rates for Quadrant D Data is divided into 100 sec bins |
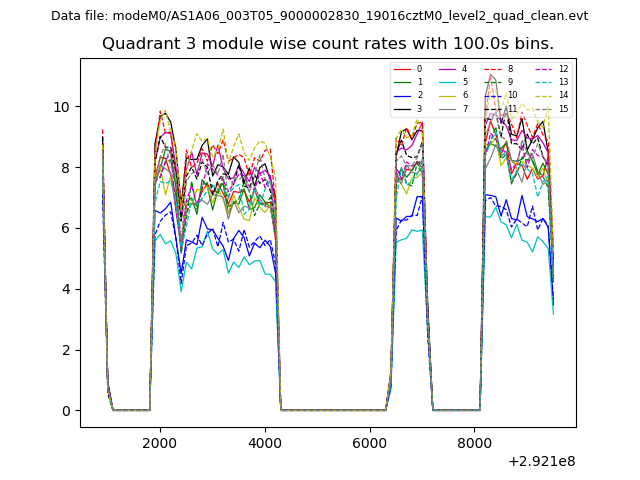 |
 |
| Parameter | Plot |
|---|---|
| CZT HV Monitor | 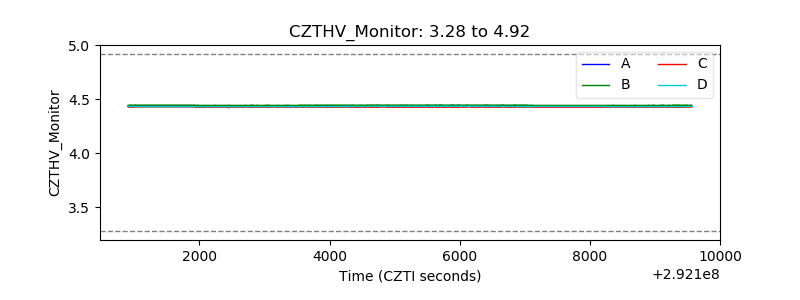 |
| D_VDD | 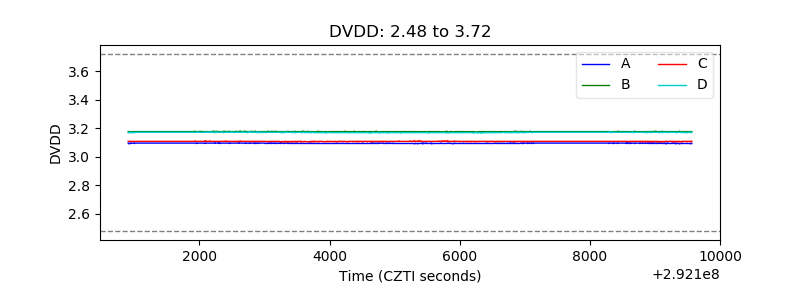 |
| Temperature 1 | 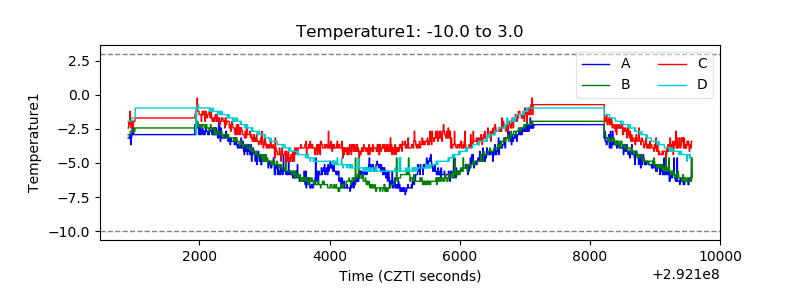 |
| Veto HV Monitor | 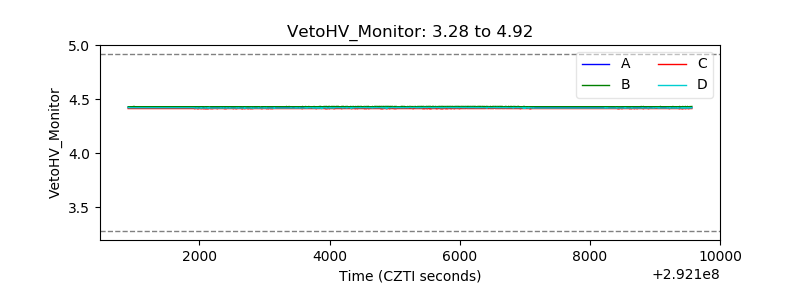 |
| Veto LLD | 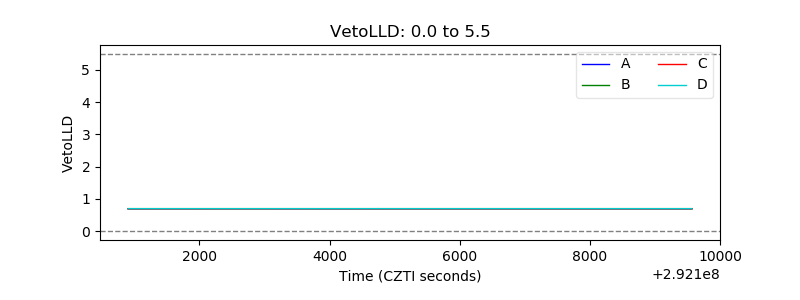 |
| Alpha Counter | 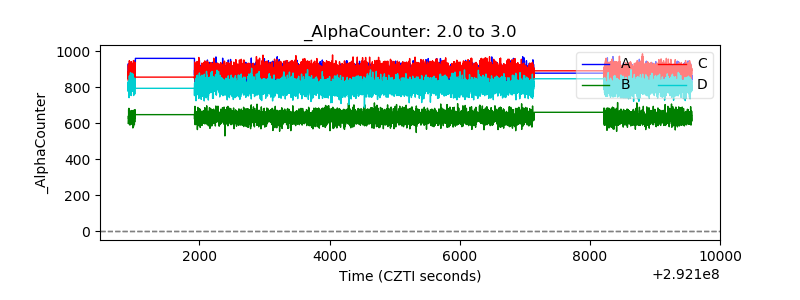 |
| _CPM_Rate | 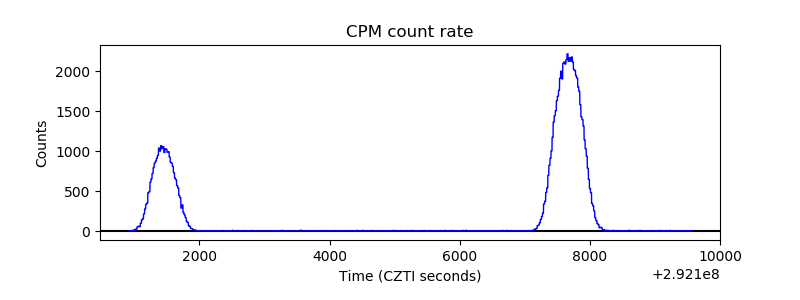 |
| CZT Counter | 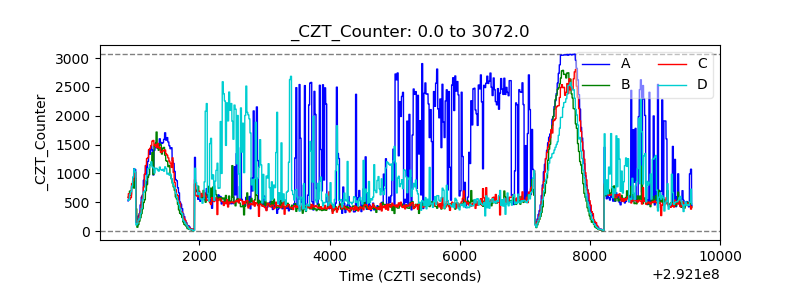 |
| +2.5 Volts monitor | 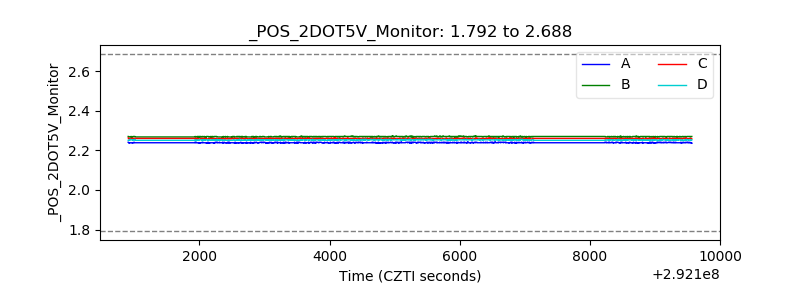 |
| +5 Volts monitor | 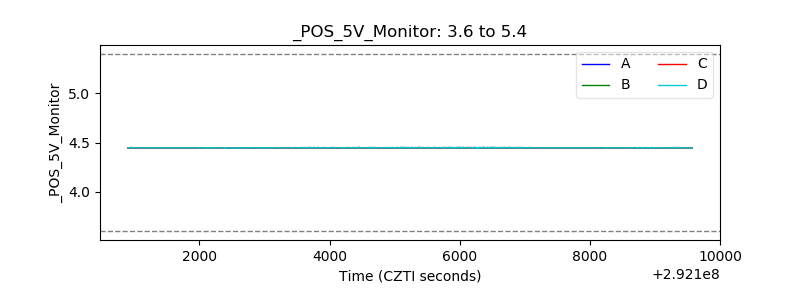 |
| _ROLL_ROT | 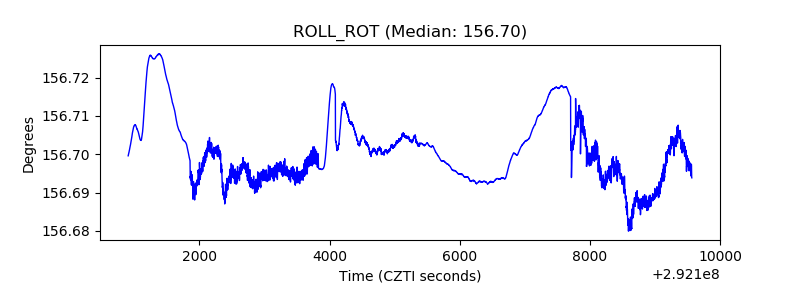 |
| _Roll_DEC | 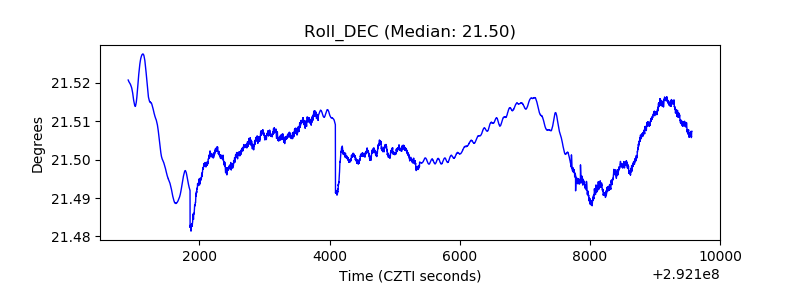 |
| _Roll_RA | 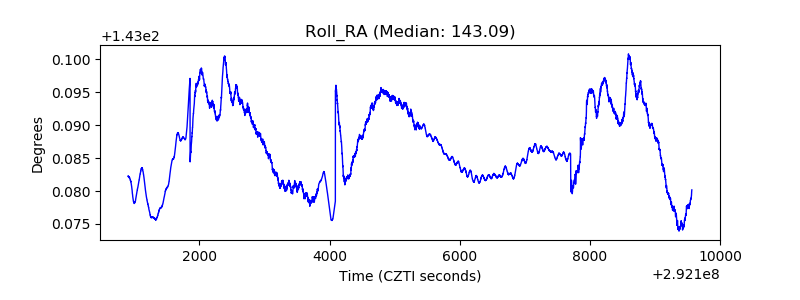 |
| Veto Counter | 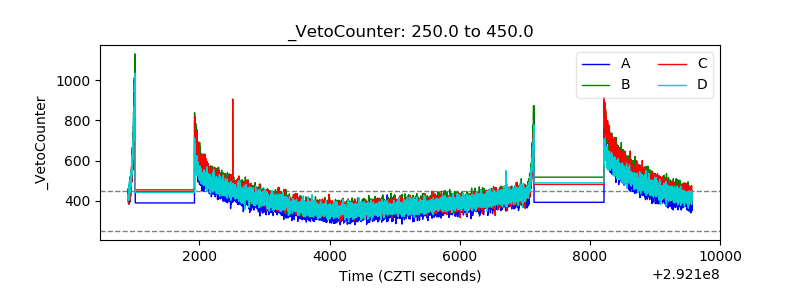 |