| Param | Original file | Final file |
|---|---|---|
| Filename | modeM0/AS1A06_003T05_9000002830_19017cztM0_level2.evt | modeM0/AS1A06_003T05_9000002830_19017cztM0_level2_quad_clean.evt |
| Size (bytes) | 577,938,240 | 89,605,440 |
| Size | 551.2 MB | 85.5 MB |
| Events in quadrant A | 6,597,062 | 552,041 |
| Events in quadrant B | 3,414,201 | 603,296 |
| Events in quadrant C | 3,128,083 | 571,831 |
| Events in quadrant D | 3,936,379 | 546,269 |
| Mode M9 | |||
|---|---|---|---|
| Quadrant | BADHDUFLAG | Total packets | Discarded packets |
| A | 0 | 14 | 0 |
| B | 0 | 15 | 0 |
| C | 0 | 15 | 0 |
| D | 0 | 15 | 0 |
| Mode SS | |||
|---|---|---|---|
| Quadrant | BADHDUFLAG | Total packets | Discarded packets |
| A | 0 | 126 | 0 |
| B | 0 | 126 | 0 |
| C | 0 | 126 | 0 |
| D | 0 | 126 | 0 |
| Mode M0 | |||
|---|---|---|---|
| Quadrant | BADHDUFLAG | Total packets | Discarded packets |
| A | 0 | 23659 | 1 |
| B | 0 | 14227 | 1 |
| C | 0 | 13192 | 1 |
| D | 0 | 16073 | 2 |
| Quadrant | Total seconds | Saturated seconds | Saturation percentage |
|---|---|---|---|
| A | 6311 | 1367 | 21.660593% |
| B | 6311 | 65 | 1.029948% |
| C | 6311 | 59 | 0.934876% |
| D | 6310 | 104 | 1.648177% |
Noise dominated data is calculated using 1-second bins in cleaned event files. If a bin has >2000 counts, and if more than 50% of those come from <1% of pixels, then it is considered to be noise-dominated and hence unusable.
| Quadrant | # 1 sec bins | Bins with >0 counts | Bins with >2000 counts | High rate bins dominated by noise | Noise dominated (total time) | Noise dominated (detector-on time) | Marked lightcurve |
|---|---|---|---|---|---|---|---|
| A | 7516 | 6312 | 1058 | 1058 | 14.08% | 16.76% | 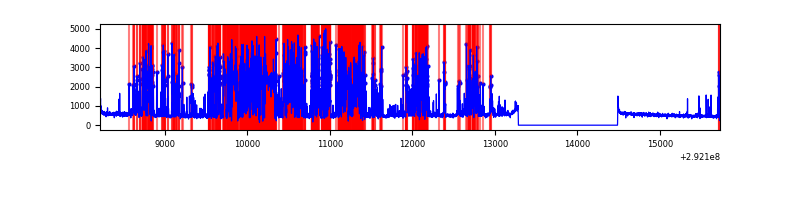 |
| B | 7516 | 6312 | 20 | 20 | 0.27% | 0.32% | 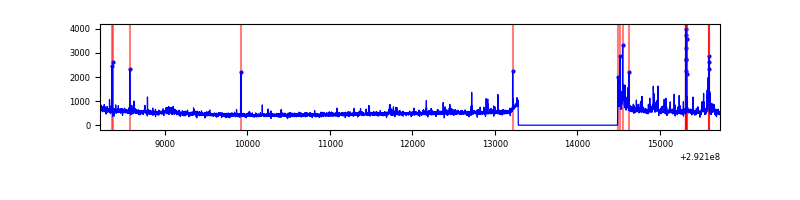 |
| C | 7516 | 6312 | 2 | 2 | 0.03% | 0.03% | 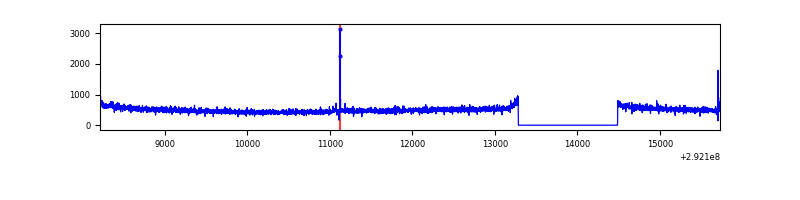 |
| D | 7515 | 6311 | 66 | 66 | 0.88% | 1.05% | 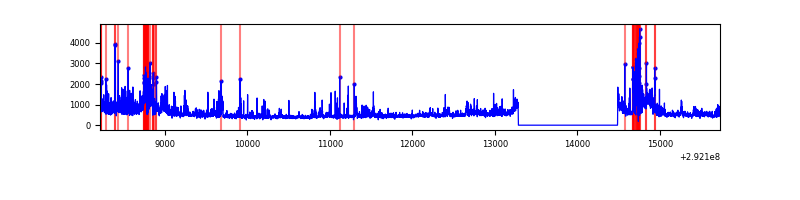 |
Top three noisy pixels from each quadrant. If the there are fewer than three noisy pixels in the level2.evt file, extra rows are filled as -1
| Pixel properties | Quadrant properties | ||||||
|---|---|---|---|---|---|---|---|
| Quadrant | DetID | PixID | Counts | Sigma | Mean | Median | Sigma |
| A | 14 | 235 | 3869462 | 27275.5 | 704 | 689 | 141.8 |
| A | 8 | 192 | 14368 | 96.44 | 704 | 689 | 141.8 |
| A | 0 | 226 | 6173 | 38.66 | 704 | 689 | 141.8 |
| B | 3 | 112 | 134269 | 899.25 | 786 | 766 | 148.5 |
| B | 0 | 189 | 78187 | 521.49 | 786 | 766 | 148.5 |
| B | 7 | 220 | 32112 | 211.14 | 786 | 766 | 148.5 |
| C | 14 | 238 | 119028 | 674.93 | 753 | 759 | 175.2 |
| C | 3 | 233 | 66974 | 377.87 | 753 | 759 | 175.2 |
| C | 13 | 61 | 5211 | 25.41 | 753 | 759 | 175.2 |
| D | 7 | 238 | 724184 | 3952.65 | 752 | 730 | 183.0 |
| D | 1 | 52 | 335525 | 1829.18 | 752 | 730 | 183.0 |
| D | 2 | 234 | 27593 | 146.77 | 752 | 730 | 183.0 |
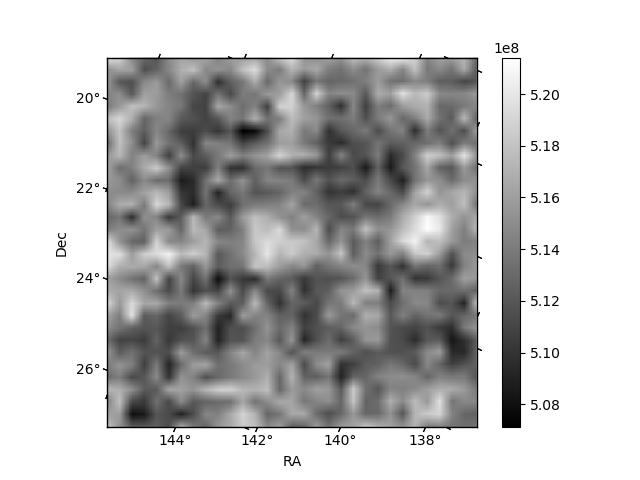
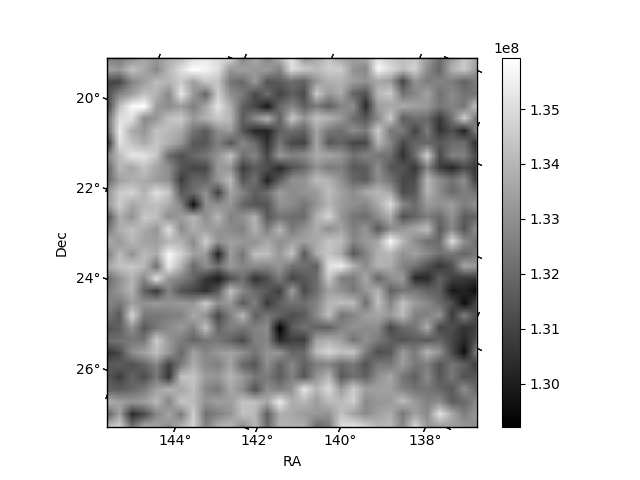
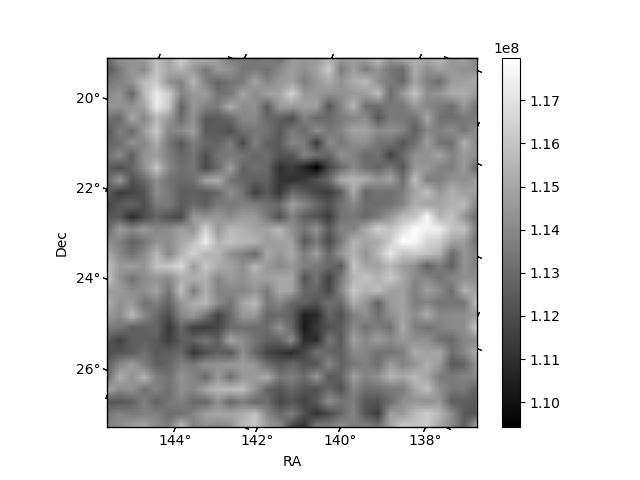
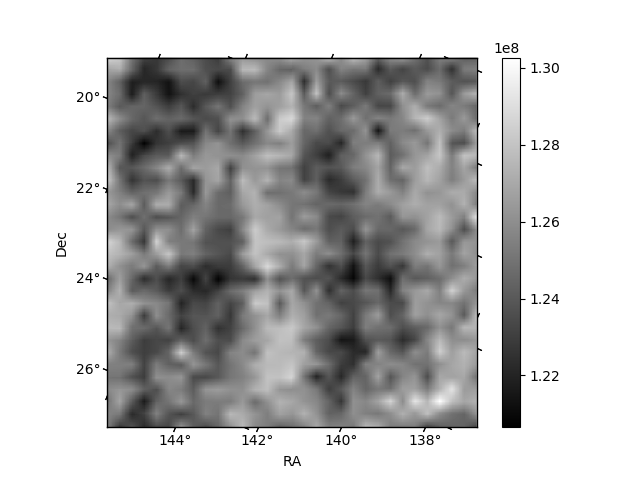
Histogram calculated using DETX and DETY for each event in the final _common_clean file
| Quadrant A | 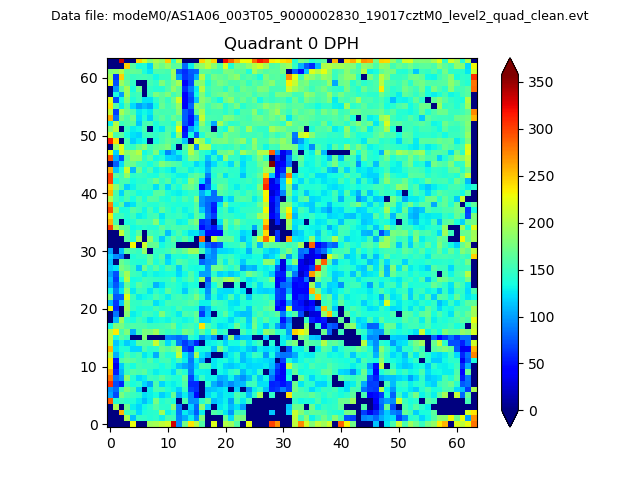 |
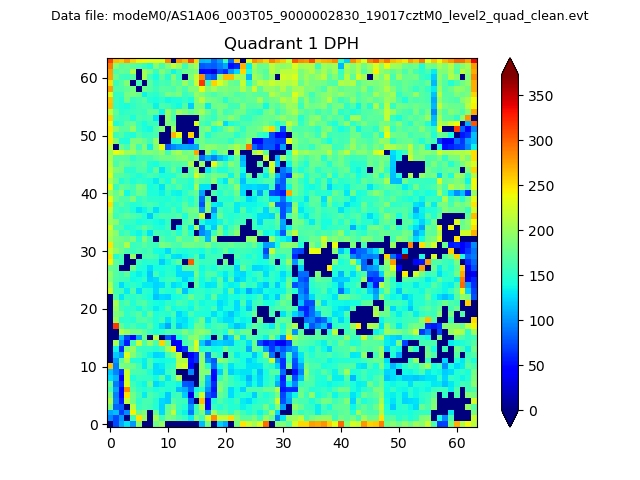 |
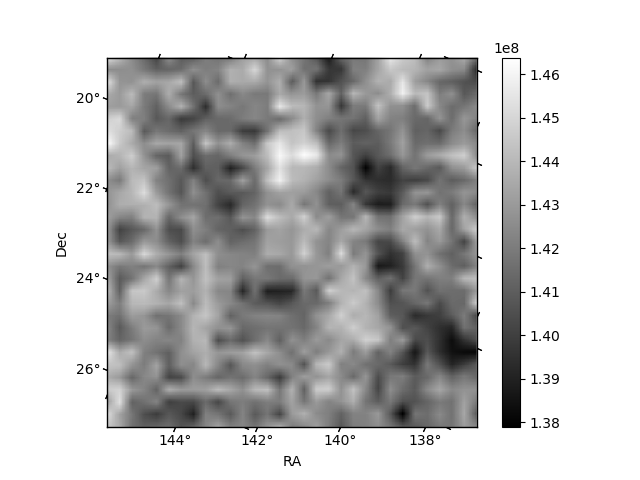
Quadrant B |
|---|---|---|---|
| Quadrant D | 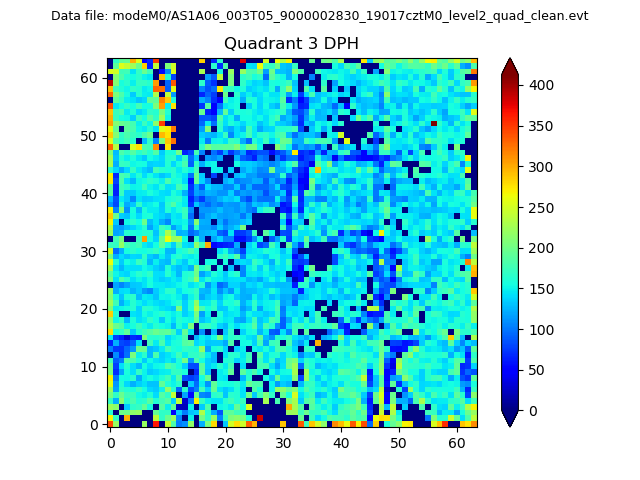 |
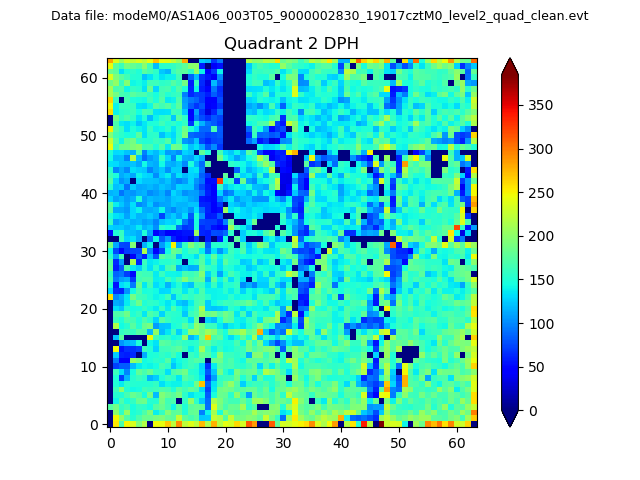 |
Quadrant C |
| Plot type | Count rate plots | Images |
|---|---|---|
| Comparison with Poisson distribution Blue bars denote a histogram of data divided into 1 sec bins. Red curve is a Poisson curve with rate = median count rate of data. |
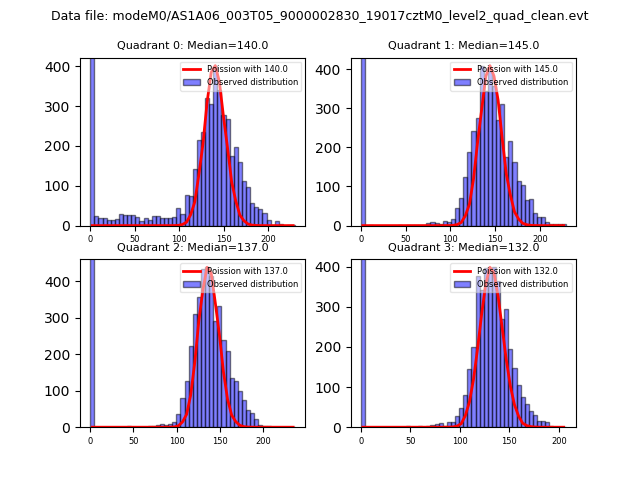 |
 |
| Quadrant-wise count rates Data is divided into 100 sec bins |
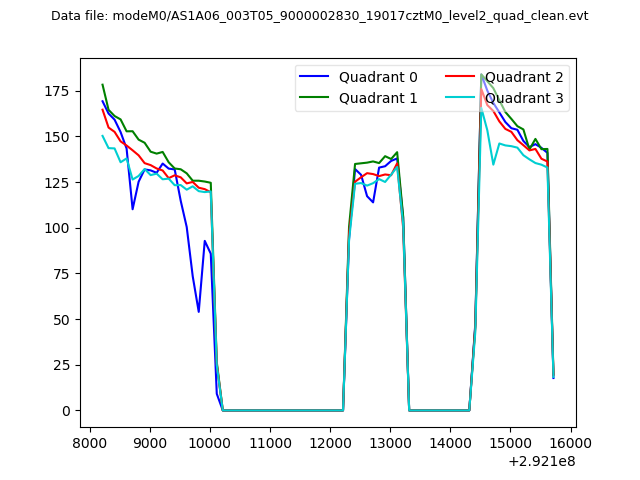 |
|
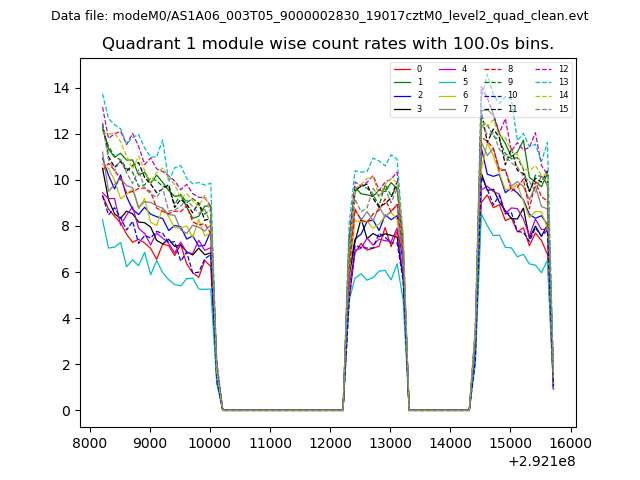
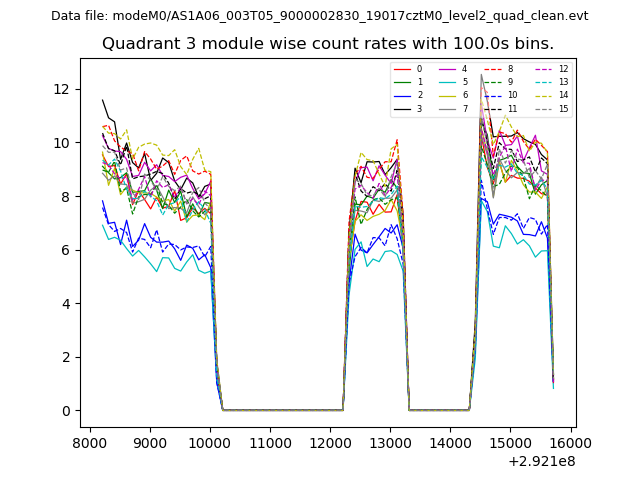
| Module-wise count rates for Quadrant A Data is divided into 100 sec bins |
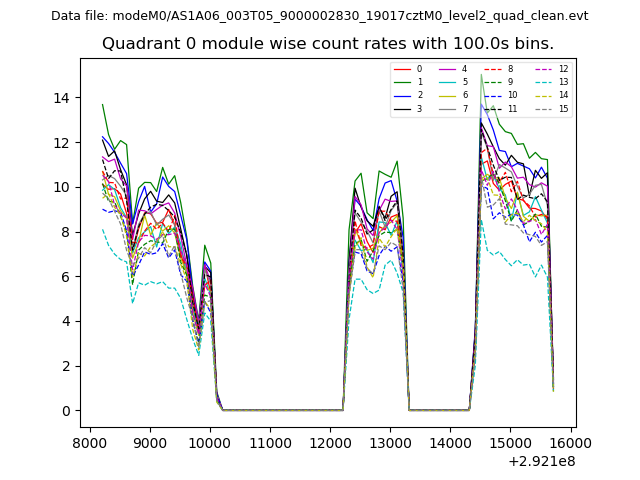 |
 |
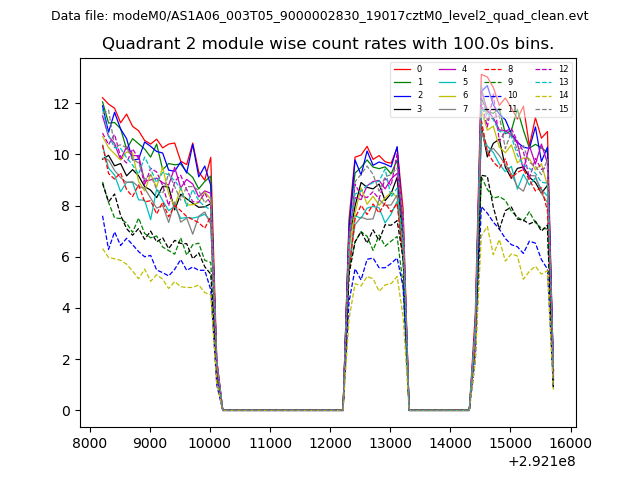
| Module-wise count rates for Quadrant B Data is divided into 100 sec bins |
 |
 |
| Module-wise count rates for Quadrant C Data is divided into 100 sec bins |
 |
 |
| Module-wise count rates for Quadrant D Data is divided into 100 sec bins |
 |
 |
| Parameter | Plot |
|---|---|
| CZT HV Monitor | 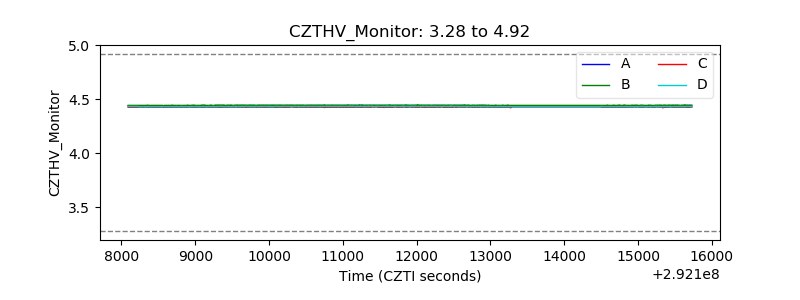 |
| D_VDD | 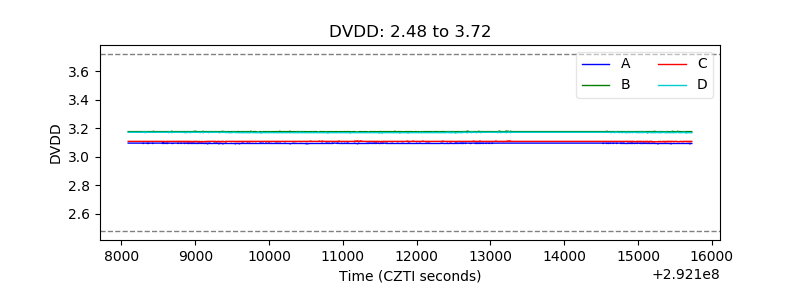 |
| Temperature 1 | 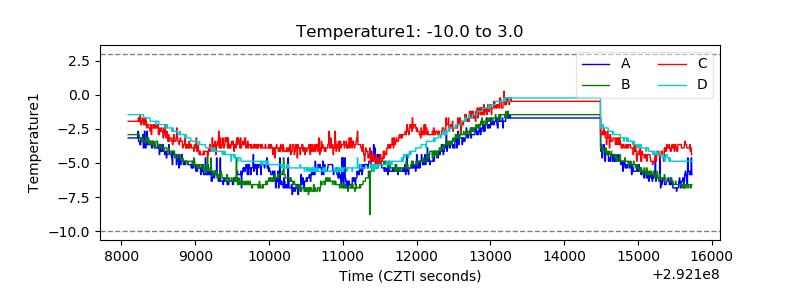 |
| Veto HV Monitor | 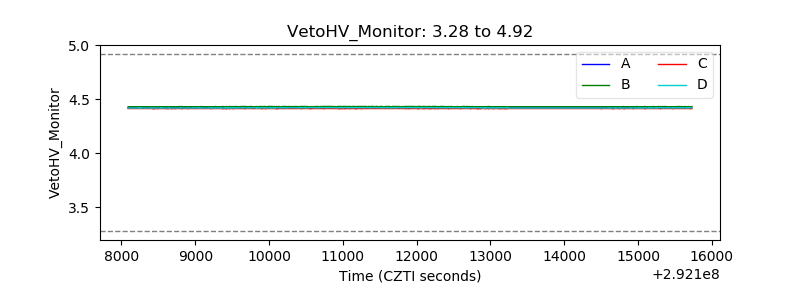 |
| Veto LLD |  |
| Alpha Counter | 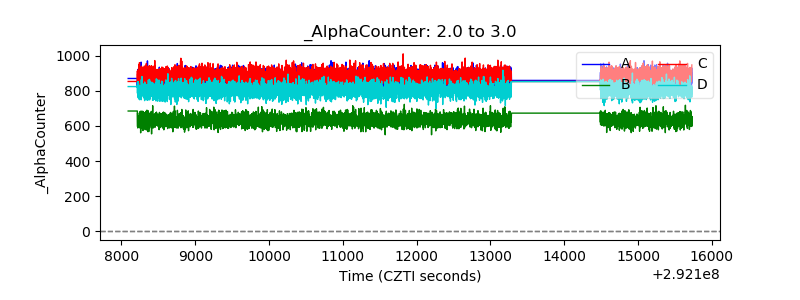 |
| _CPM_Rate | 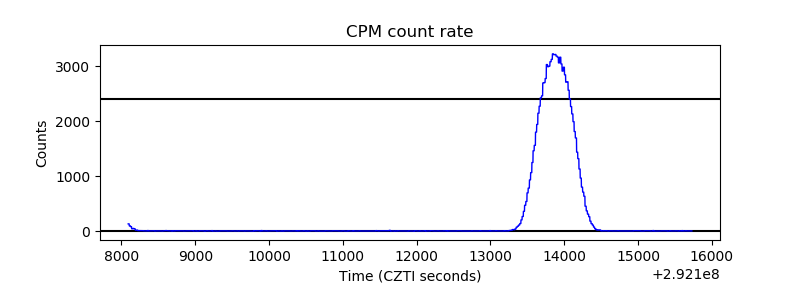 |
| CZT Counter | 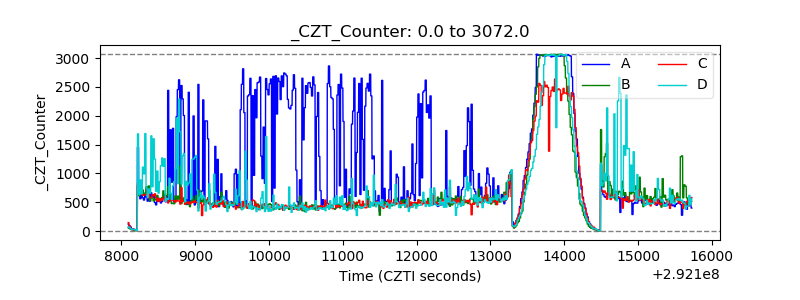 |
| +2.5 Volts monitor |  |
| +5 Volts monitor |  |
| _ROLL_ROT | 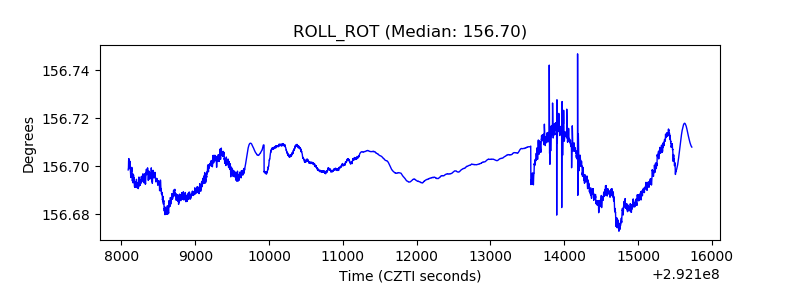 |
| _Roll_DEC | 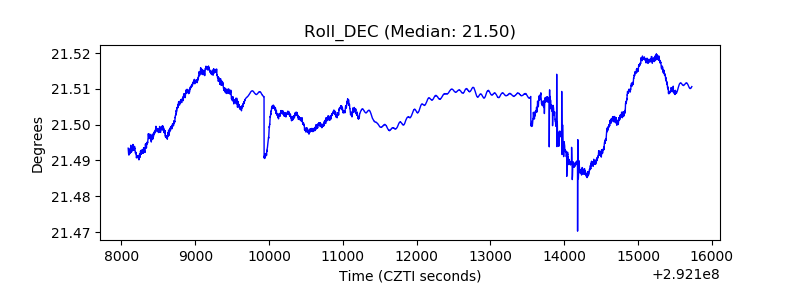 |
| _Roll_RA | 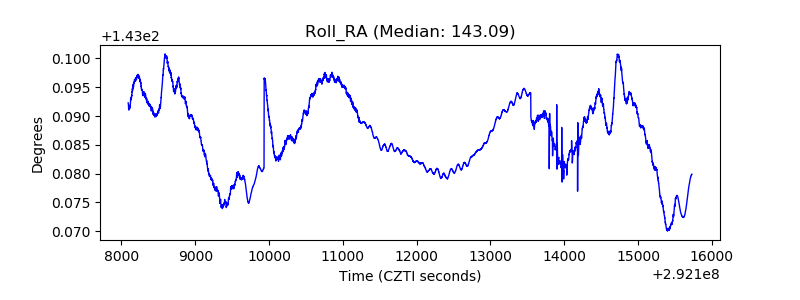 |
| Veto Counter | 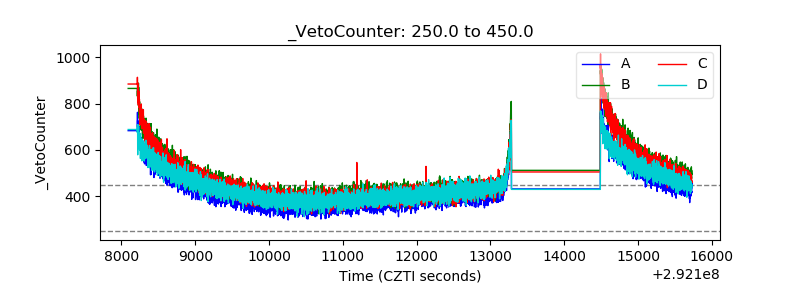 |