| Param | Original file | Final file |
|---|---|---|
| Filename | modeM0/AS1A06_003T05_9000002830_19018cztM0_level2.evt | modeM0/AS1A06_003T05_9000002830_19018cztM0_level2_quad_clean.evt |
| Size (bytes) | 522,521,280 | 89,616,960 |
| Size | 498.3 MB | 85.5 MB |
| Events in quadrant A | 4,172,445 | 583,940 |
| Events in quadrant B | 3,633,283 | 600,676 |
| Events in quadrant C | 3,673,662 | 558,874 |
| Events in quadrant D | 3,920,306 | 533,265 |
| Mode M9 | |||
|---|---|---|---|
| Quadrant | BADHDUFLAG | Total packets | Discarded packets |
| A | 0 | 17 | 0 |
| B | 0 | 18 | 0 |
| C | 0 | 18 | 0 |
| D | 0 | 18 | 0 |
| Mode SS | |||
|---|---|---|---|
| Quadrant | BADHDUFLAG | Total packets | Discarded packets |
| A | 0 | 126 | 0 |
| B | 0 | 126 | 0 |
| C | 0 | 126 | 0 |
| D | 0 | 126 | 0 |
| Mode M0 | |||
|---|---|---|---|
| Quadrant | BADHDUFLAG | Total packets | Discarded packets |
| A | 0 | 16258 | 1 |
| B | 0 | 14693 | 3 |
| C | 0 | 14933 | 1 |
| D | 0 | 15843 | 1 |
| Quadrant | Total seconds | Saturated seconds | Saturation percentage |
|---|---|---|---|
| A | 6270 | 386 | 6.156300% |
| B | 6269 | 83 | 1.323975% |
| C | 6269 | 117 | 1.866326% |
| D | 6269 | 127 | 2.025841% |
Noise dominated data is calculated using 1-second bins in cleaned event files. If a bin has >2000 counts, and if more than 50% of those come from <1% of pixels, then it is considered to be noise-dominated and hence unusable.
| Quadrant | # 1 sec bins | Bins with >0 counts | Bins with >2000 counts | High rate bins dominated by noise | Noise dominated (total time) | Noise dominated (detector-on time) | Marked lightcurve |
|---|---|---|---|---|---|---|---|
| A | 7575 | 6271 | 277 | 277 | 3.66% | 4.42% | 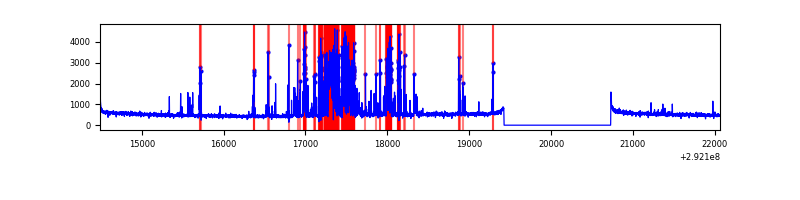 |
| B | 7574 | 6270 | 25 | 25 | 0.33% | 0.40% | 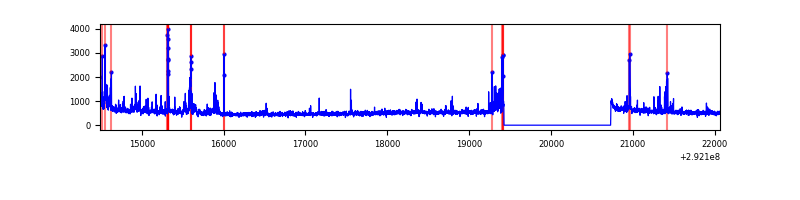 |
| C | 7574 | 6270 | 67 | 67 | 0.88% | 1.07% | 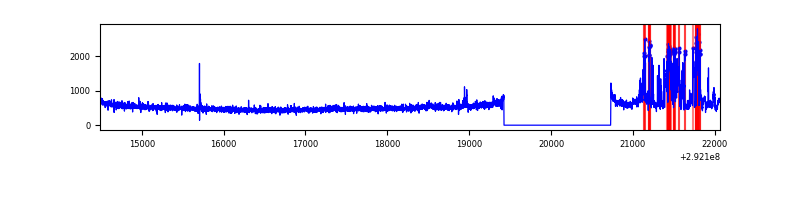 |
| D | 7574 | 6270 | 78 | 78 | 1.03% | 1.24% | 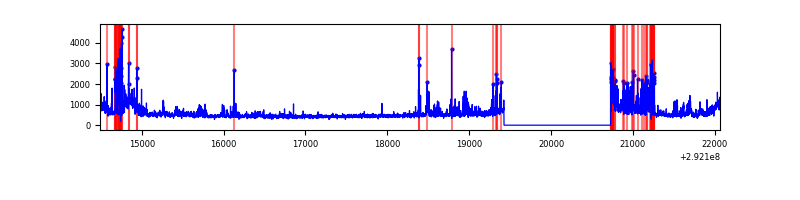 |
Top three noisy pixels from each quadrant. If the there are fewer than three noisy pixels in the level2.evt file, extra rows are filled as -1
| Pixel properties | Quadrant properties | ||||||
|---|---|---|---|---|---|---|---|
| Quadrant | DetID | PixID | Counts | Sigma | Mean | Median | Sigma |
| A | 14 | 235 | 1138454 | 7236.54 | 785 | 771 | 157.2 |
| A | 8 | 192 | 11544 | 68.52 | 785 | 771 | 157.2 |
| A | 0 | 226 | 6834 | 38.57 | 785 | 771 | 157.2 |
| B | 3 | 112 | 192374 | 1262.94 | 809 | 790 | 151.7 |
| B | 0 | 189 | 103133 | 674.66 | 809 | 790 | 151.7 |
| B | 7 | 220 | 58198 | 378.44 | 809 | 790 | 151.7 |
| C | 3 | 233 | 553125 | 3085.51 | 770 | 777 | 179.0 |
| C | 14 | 238 | 120186 | 667.04 | 770 | 777 | 179.0 |
| C | 13 | 61 | 5437 | 26.03 | 770 | 777 | 179.0 |
| D | 7 | 238 | 769985 | 4112.15 | 766 | 744 | 187.1 |
| D | 1 | 52 | 223526 | 1190.93 | 766 | 744 | 187.1 |
| D | 2 | 234 | 25433 | 131.98 | 766 | 744 | 187.1 |
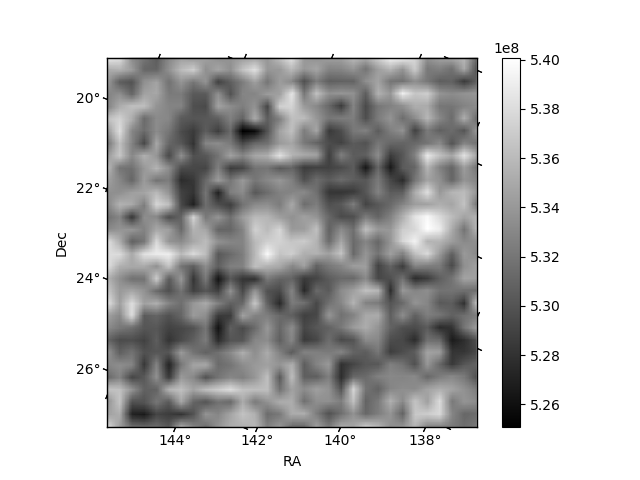
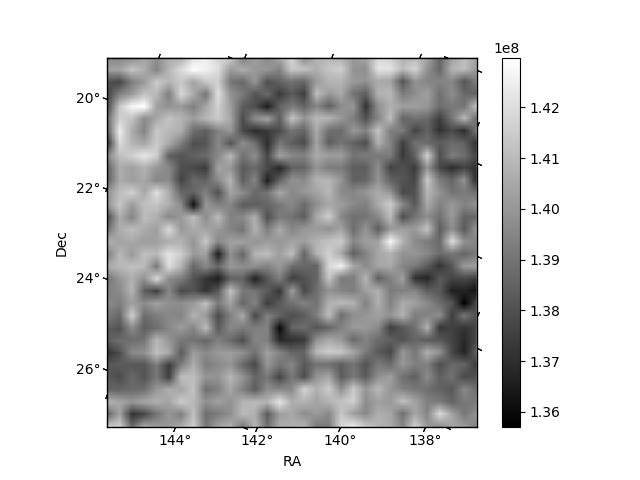
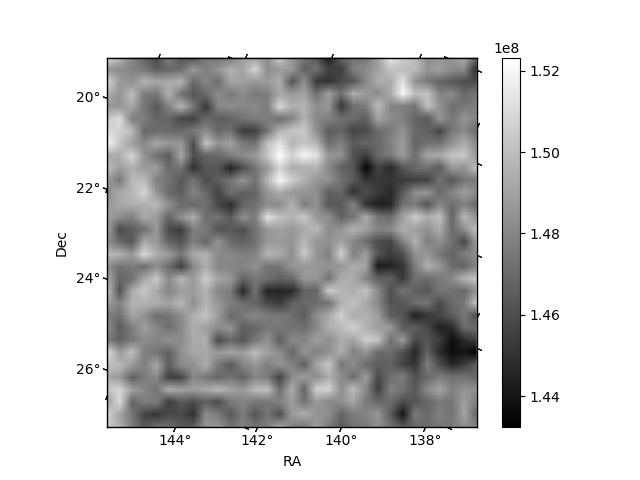
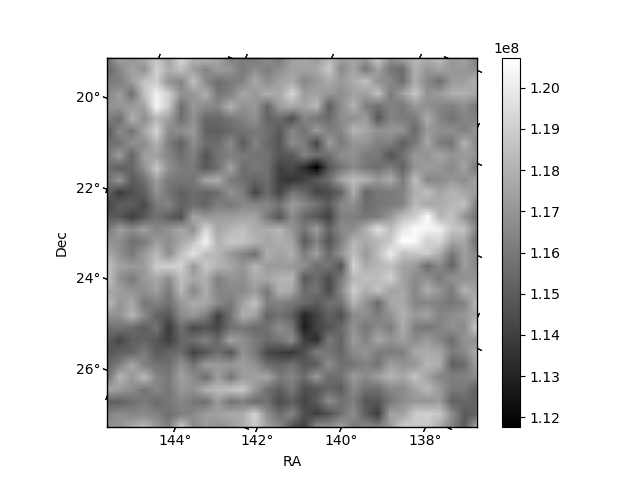
Histogram calculated using DETX and DETY for each event in the final _common_clean file
| Quadrant A | 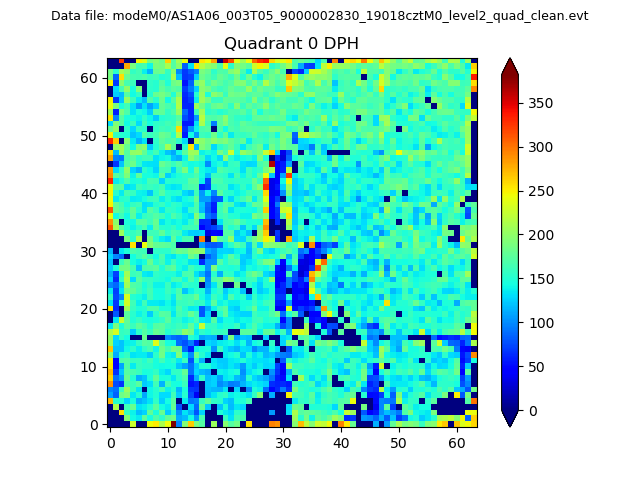 |
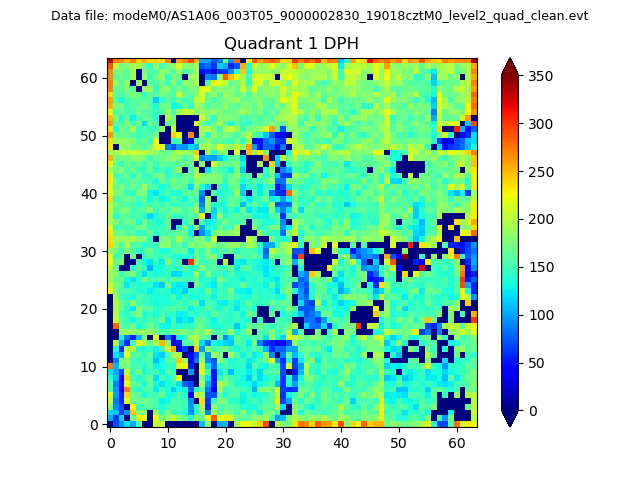 |
Quadrant B |
|---|---|---|---|
| Quadrant D |  |
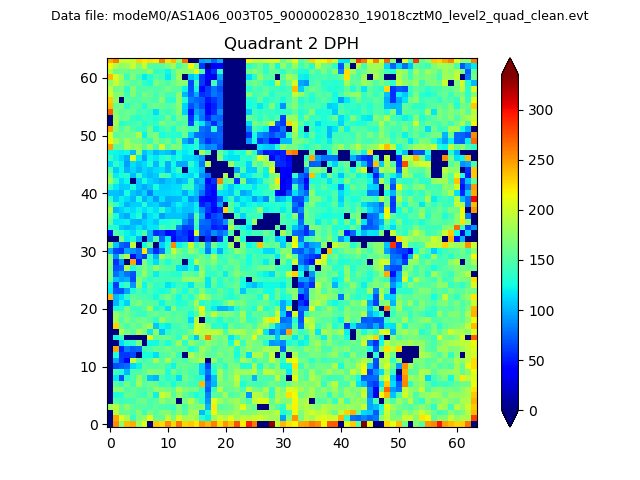 |
Quadrant C |
| Plot type | Count rate plots | Images |
|---|---|---|
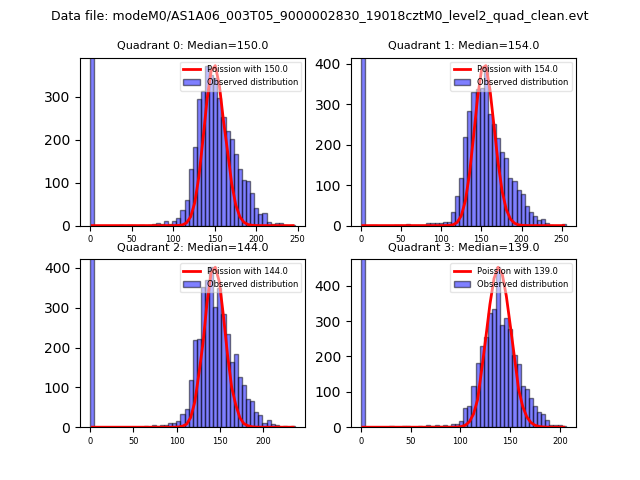
| Comparison with Poisson distribution Blue bars denote a histogram of data divided into 1 sec bins. Red curve is a Poisson curve with rate = median count rate of data. |
 |
 |
| Quadrant-wise count rates Data is divided into 100 sec bins |
 |
|
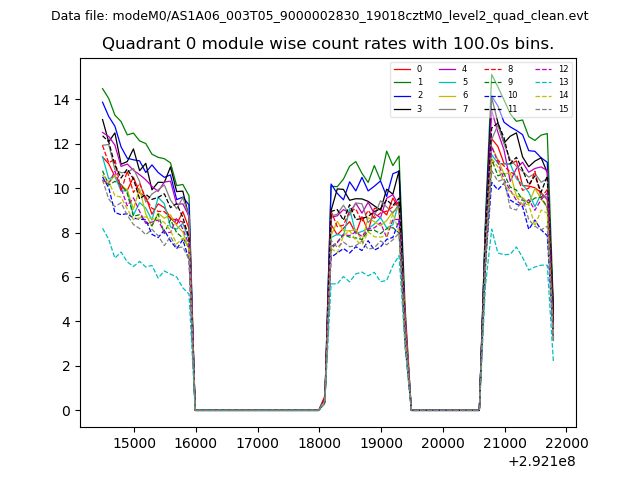
| Module-wise count rates for Quadrant A Data is divided into 100 sec bins |
 |
 |
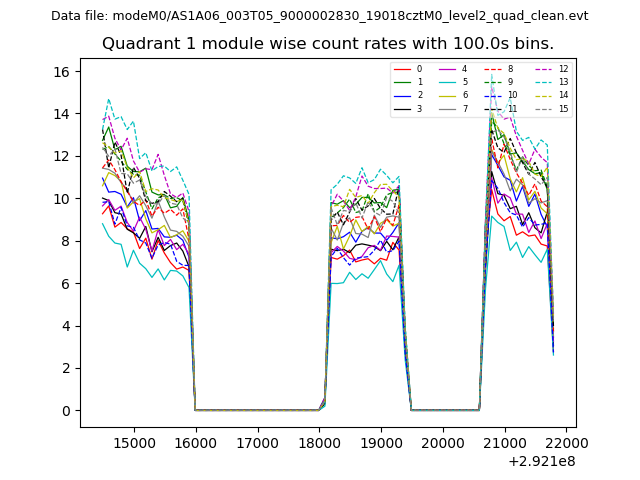
| Module-wise count rates for Quadrant B Data is divided into 100 sec bins |
 |
 |
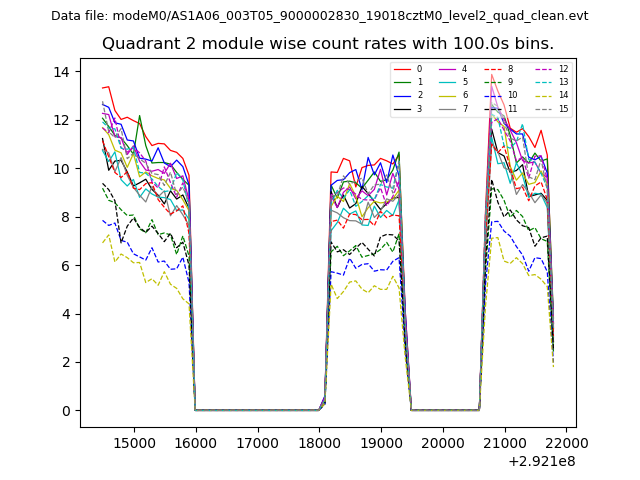
| Module-wise count rates for Quadrant C Data is divided into 100 sec bins |
 |
 |
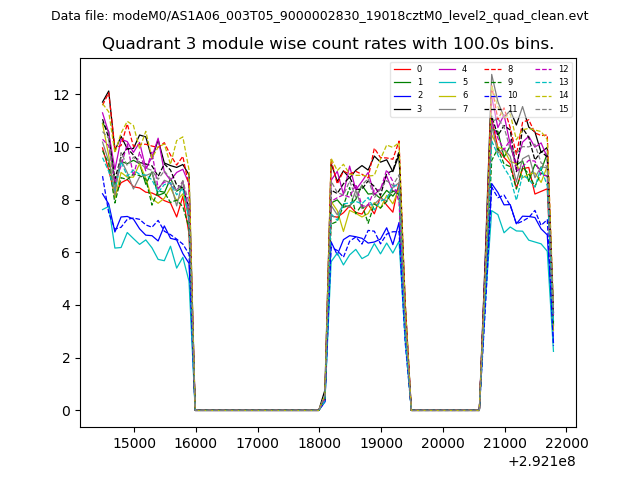
| Module-wise count rates for Quadrant D Data is divided into 100 sec bins |
 |
 |
| Parameter | Plot |
|---|---|
| CZT HV Monitor | 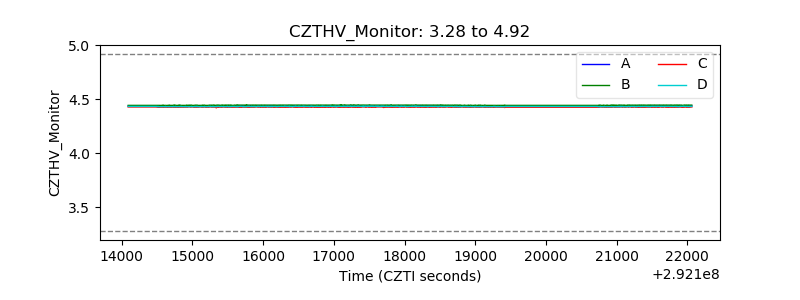 |
| D_VDD | 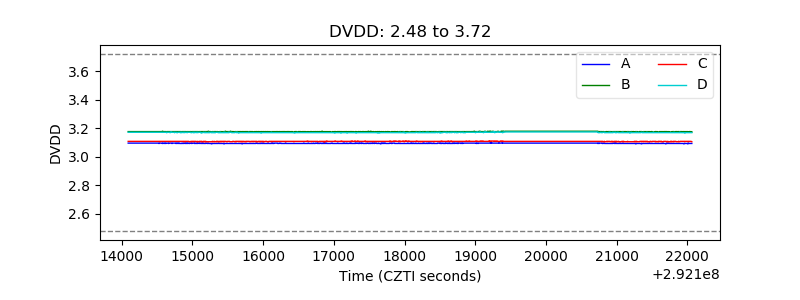 |
| Temperature 1 | 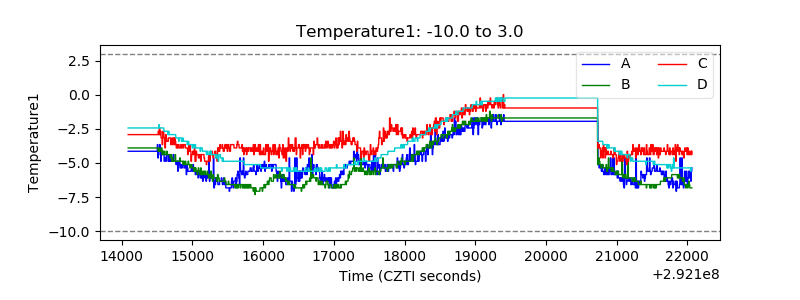 |
| Veto HV Monitor | 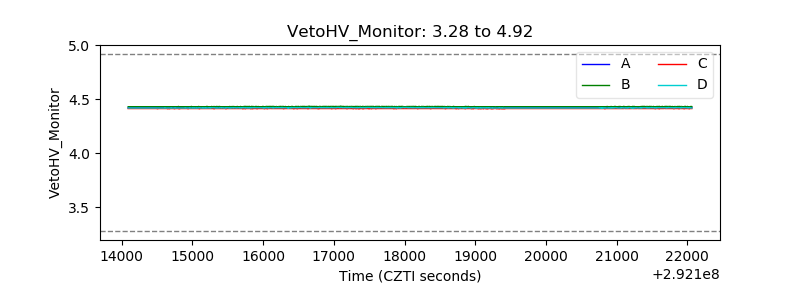 |
| Veto LLD | 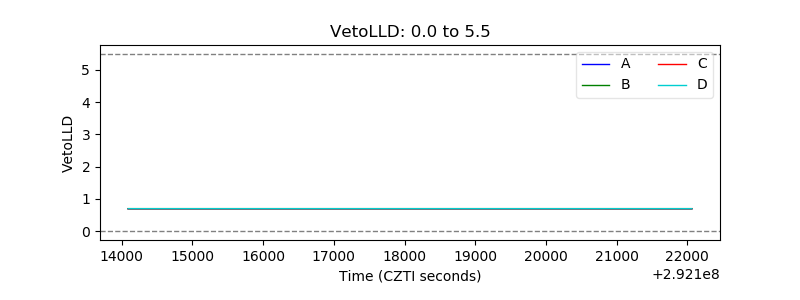 |
| Alpha Counter |  |
| _CPM_Rate |  |
| CZT Counter | 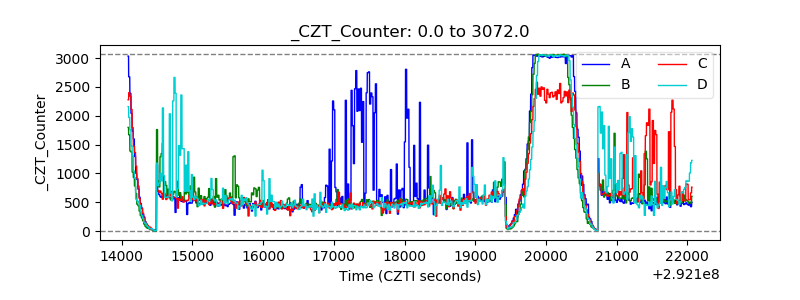 |
| +2.5 Volts monitor |  |
| +5 Volts monitor |  |
| _ROLL_ROT | 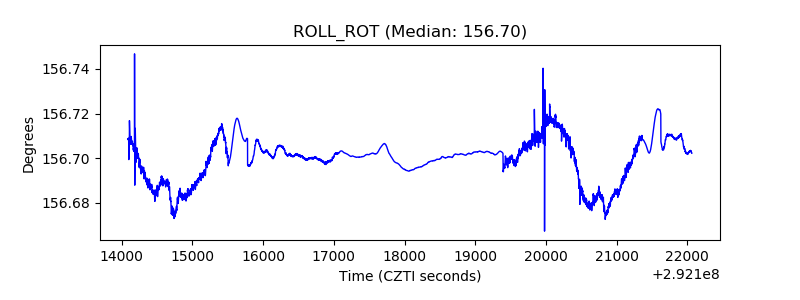 |
| _Roll_DEC | 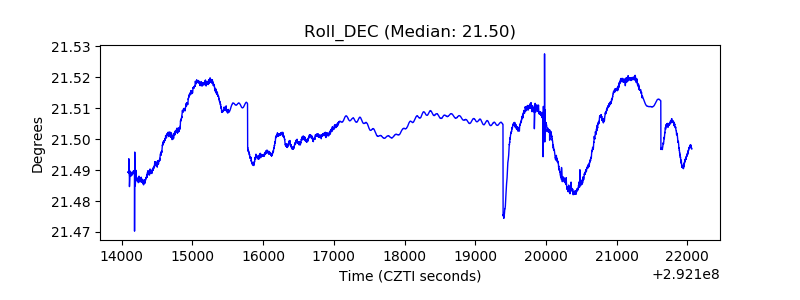 |
| _Roll_RA | 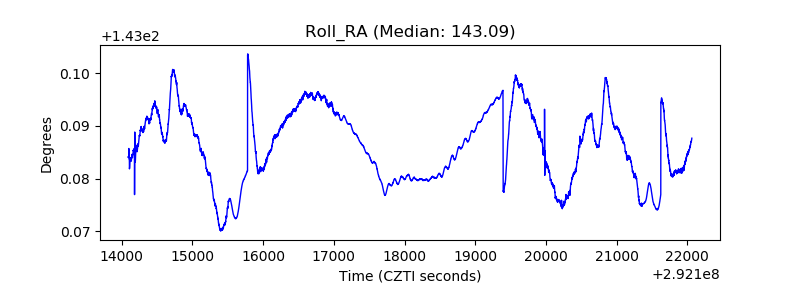 |
| Veto Counter | 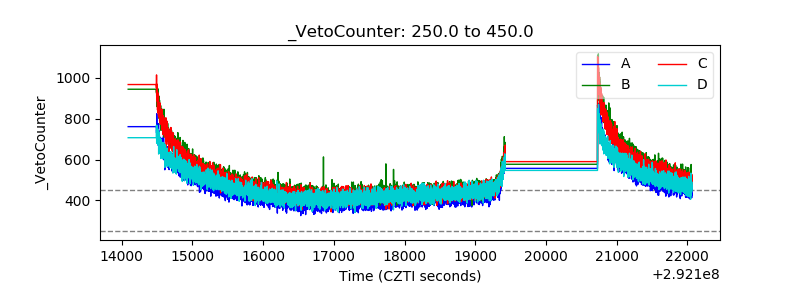 |