| Param | Original file | Final file |
|---|---|---|
| Filename | modeM0/AS1A06_003T05_9000002830_19022cztM0_level2.evt | modeM0/AS1A06_003T05_9000002830_19022cztM0_level2_quad_clean.evt |
| Size (bytes) | 550,416,960 | 71,222,400 |
| Size | 524.9 MB | 67.9 MB |
| Events in quadrant A | 3,612,960 | 432,977 |
| Events in quadrant B | 3,602,763 | 439,511 |
| Events in quadrant C | 3,824,446 | 413,601 |
| Events in quadrant D | 5,164,561 | 392,653 |
| Mode M9 | |||
|---|---|---|---|
| Quadrant | BADHDUFLAG | Total packets | Discarded packets |
| A | 0 | 8 | 0 |
| B | 0 | 8 | 0 |
| C | 0 | 8 | 0 |
| D | 0 | 8 | 0 |
| Mode SS | |||
|---|---|---|---|
| Quadrant | BADHDUFLAG | Total packets | Discarded packets |
| A | 0 | 140 | 0 |
| B | 0 | 140 | 0 |
| C | 0 | 140 | 0 |
| D | 0 | 140 | 0 |
| Mode M0 | |||
|---|---|---|---|
| Quadrant | BADHDUFLAG | Total packets | Discarded packets |
| A | 0 | 15004 | 2 |
| B | 0 | 14756 | 2 |
| C | 0 | 15547 | 2 |
| D | 0 | 19929 | 2 |
| Quadrant | Total seconds | Saturated seconds | Saturation percentage |
|---|---|---|---|
| A | 6849 | 141 | 2.058695% |
| B | 6849 | 135 | 1.971091% |
| C | 6849 | 145 | 2.117097% |
| D | 6849 | 427 | 6.234487% |
Noise dominated data is calculated using 1-second bins in cleaned event files. If a bin has >2000 counts, and if more than 50% of those come from <1% of pixels, then it is considered to be noise-dominated and hence unusable.
| Quadrant | # 1 sec bins | Bins with >0 counts | Bins with >2000 counts | High rate bins dominated by noise | Noise dominated (total time) | Noise dominated (detector-on time) | Marked lightcurve |
|---|---|---|---|---|---|---|---|
| A | 7684 | 6850 | 42 | 42 | 0.55% | 0.61% | 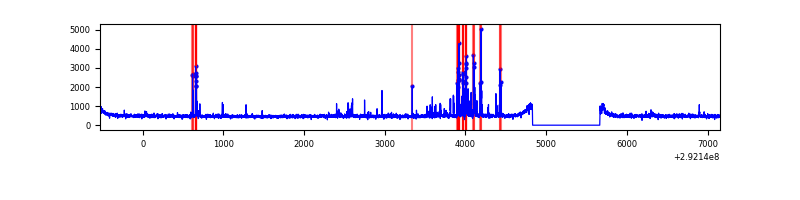 |
| B | 7684 | 6850 | 17 | 17 | 0.22% | 0.25% | 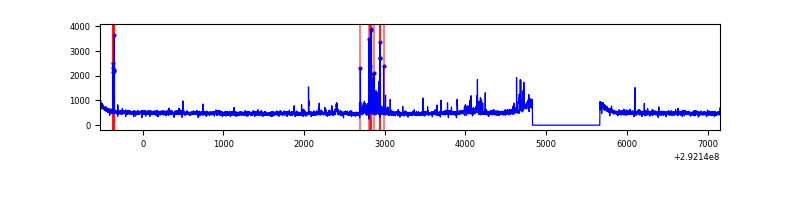 |
| C | 7684 | 6850 | 12 | 12 | 0.16% | 0.18% | 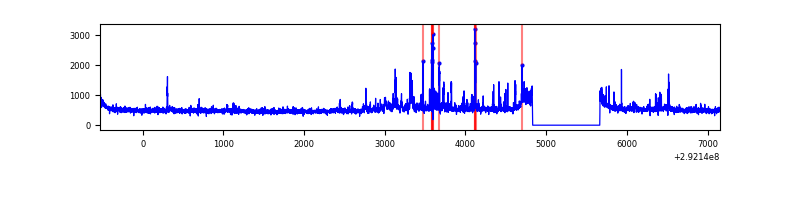 |
| D | 7684 | 6850 | 332 | 332 | 4.32% | 4.85% | 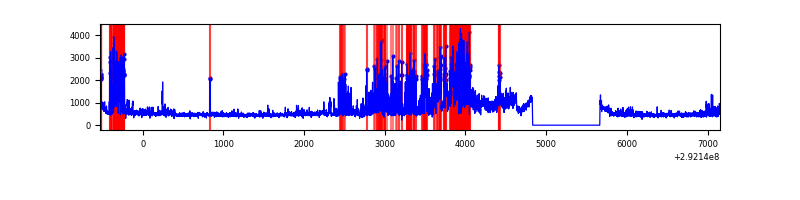 |
Top three noisy pixels from each quadrant. If the there are fewer than three noisy pixels in the level2.evt file, extra rows are filled as -1
| Pixel properties | Quadrant properties | ||||||
|---|---|---|---|---|---|---|---|
| Quadrant | DetID | PixID | Counts | Sigma | Mean | Median | Sigma |
| A | 14 | 235 | 274929 | 1582.1 | 860 | 840 | 173.2 |
| A | 9 | 143 | 30325 | 170.19 | 860 | 840 | 173.2 |
| A | 0 | 226 | 7612 | 39.09 | 860 | 840 | 173.2 |
| B | 7 | 220 | 88423 | 534.2 | 860 | 839 | 164.0 |
| B | 3 | 112 | 36107 | 215.11 | 860 | 839 | 164.0 |
| B | 0 | 189 | 31360 | 186.16 | 860 | 839 | 164.0 |
| C | 3 | 233 | 503466 | 2605.71 | 819 | 824 | 192.9 |
| C | 14 | 238 | 126400 | 650.99 | 819 | 824 | 192.9 |
| C | 13 | 61 | 5749 | 25.53 | 819 | 824 | 192.9 |
| D | 1 | 52 | 1268539 | 6319.93 | 817 | 795 | 200.6 |
| D | 7 | 238 | 766041 | 3814.89 | 817 | 795 | 200.6 |
| D | 11 | 176 | 33647 | 163.77 | 817 | 795 | 200.6 |
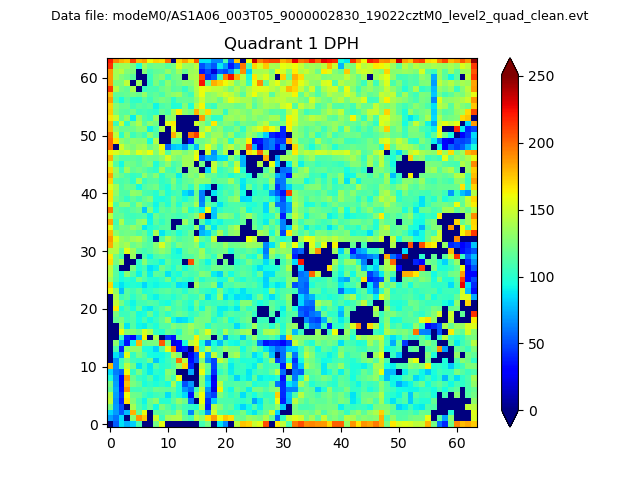
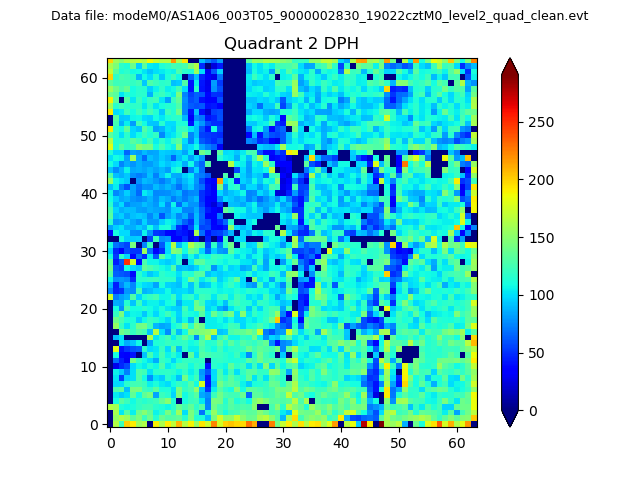
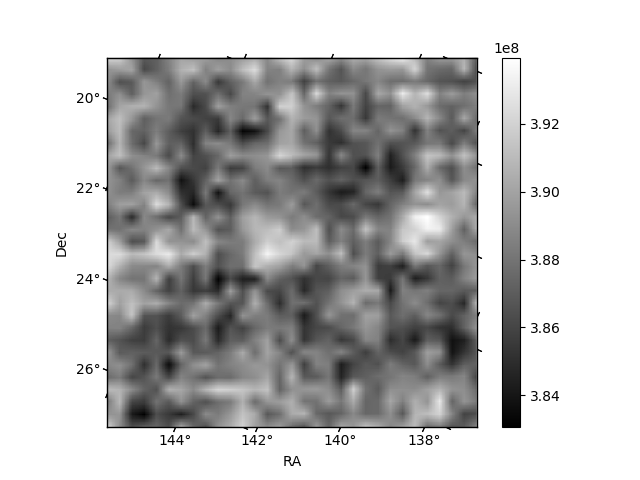
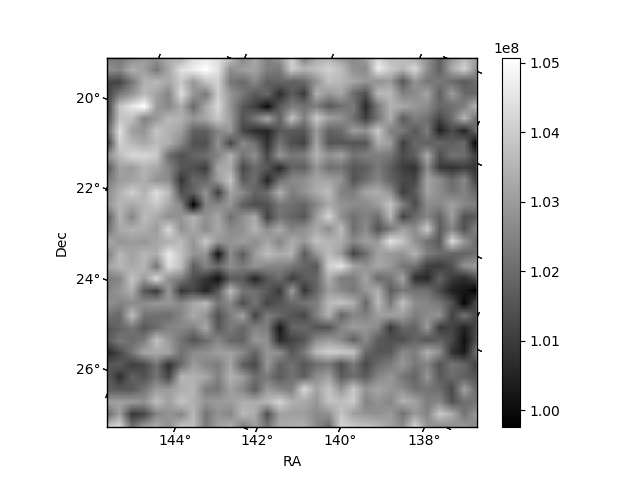
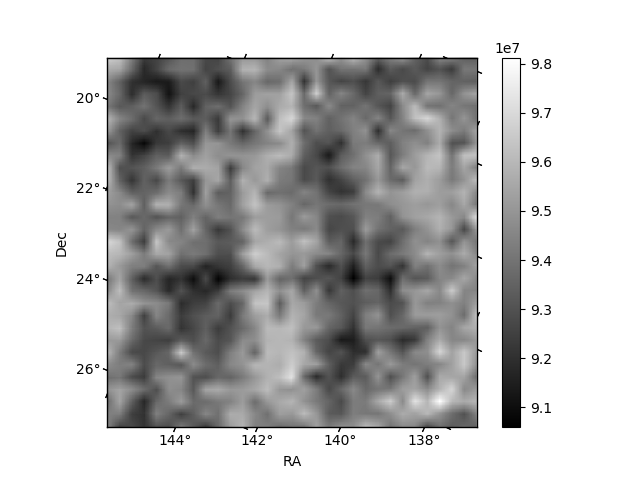
Histogram calculated using DETX and DETY for each event in the final _common_clean file
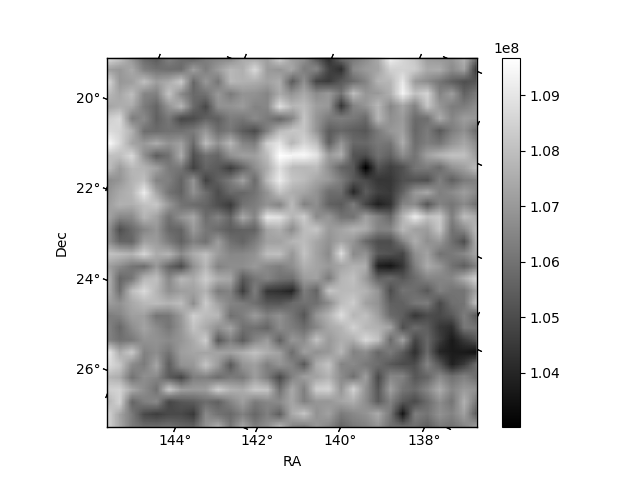
| Quadrant A |  |
 |
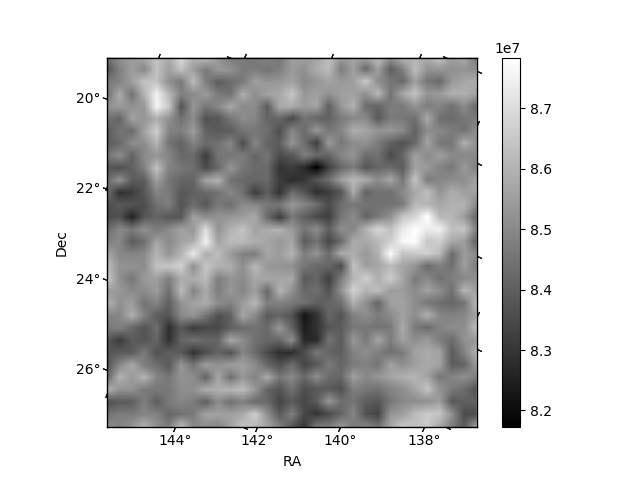
Quadrant B |
|---|---|---|---|
| Quadrant D | 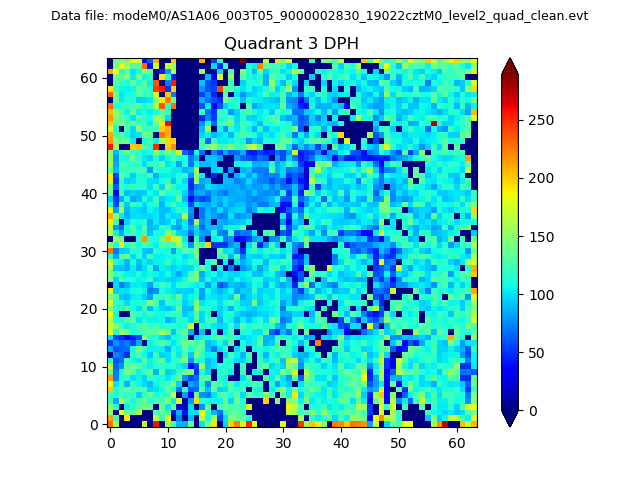 |
 |
Quadrant C |
| Plot type | Count rate plots | Images |
|---|---|---|
| Comparison with Poisson distribution Blue bars denote a histogram of data divided into 1 sec bins. Red curve is a Poisson curve with rate = median count rate of data. |
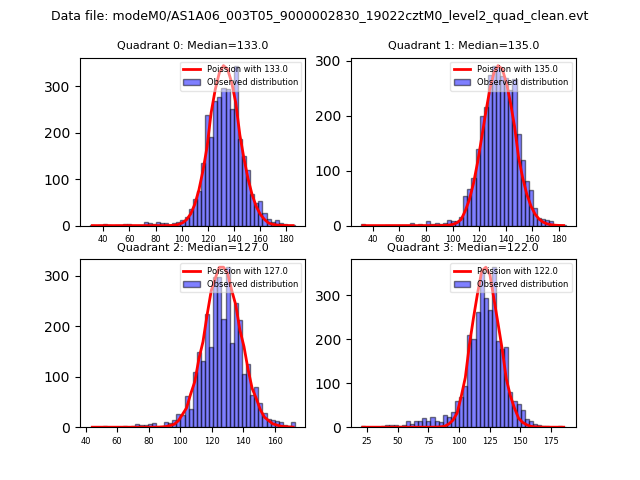 |
 |
| Quadrant-wise count rates Data is divided into 100 sec bins |
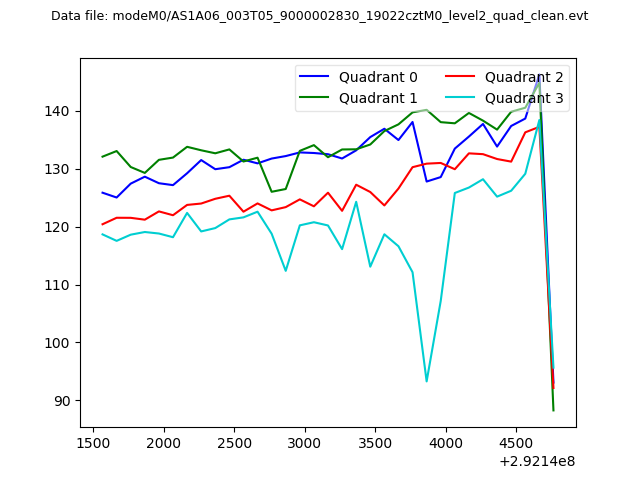 |
|
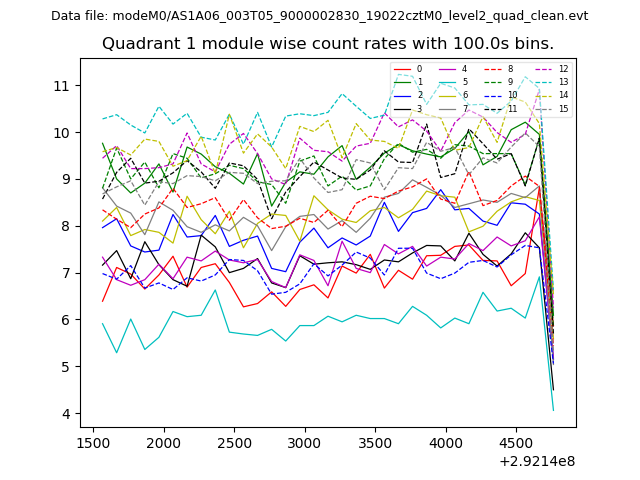
| Module-wise count rates for Quadrant A Data is divided into 100 sec bins |
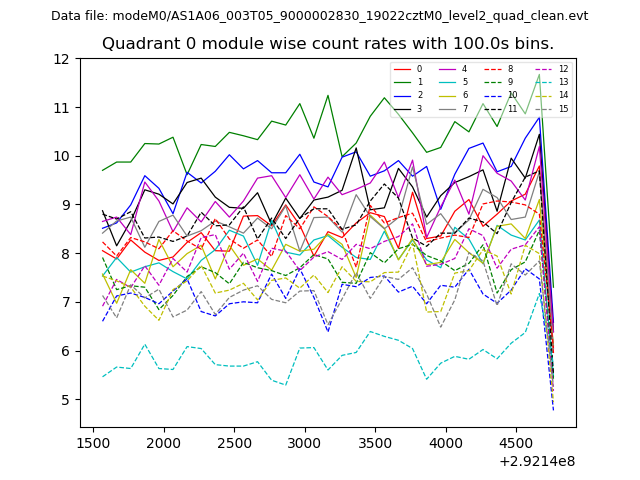 |
 |
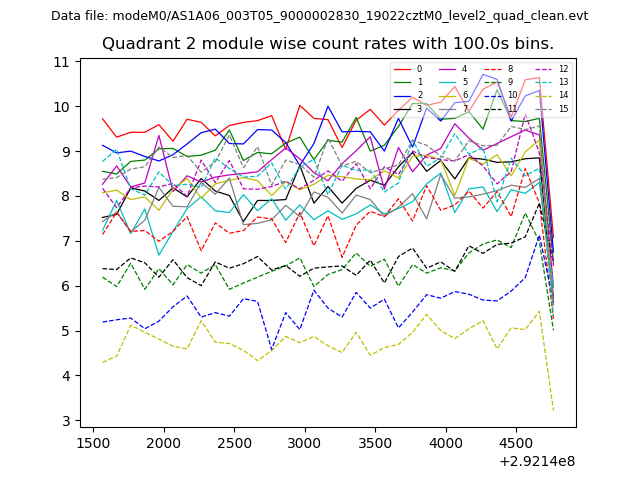
| Module-wise count rates for Quadrant B Data is divided into 100 sec bins |
 |
 |
| Module-wise count rates for Quadrant C Data is divided into 100 sec bins |
 |
 |
| Module-wise count rates for Quadrant D Data is divided into 100 sec bins |
 |
 |
| Parameter | Plot |
|---|---|
| CZT HV Monitor | 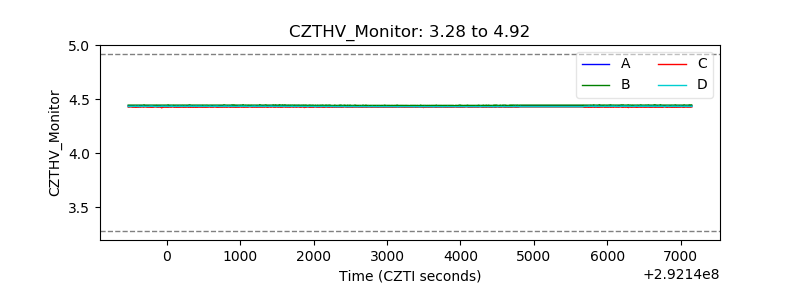 |
| D_VDD | 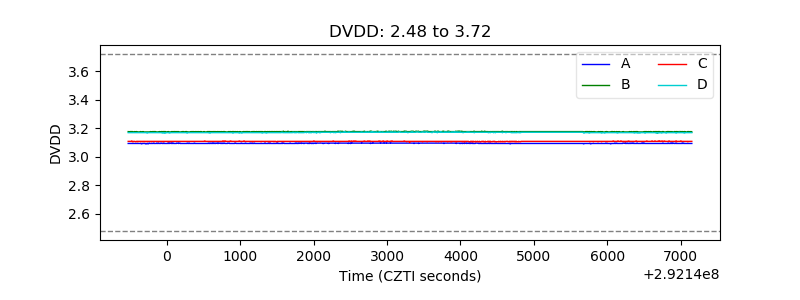 |
| Temperature 1 | 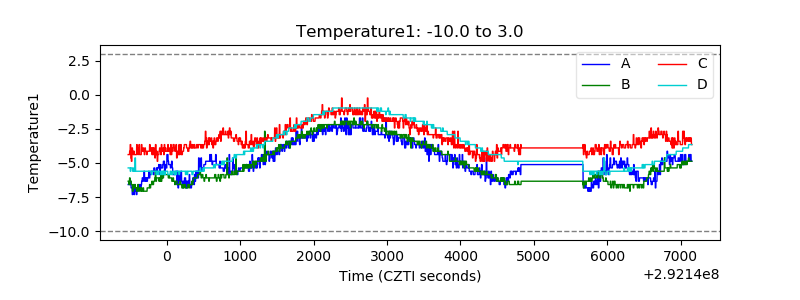 |
| Veto HV Monitor | 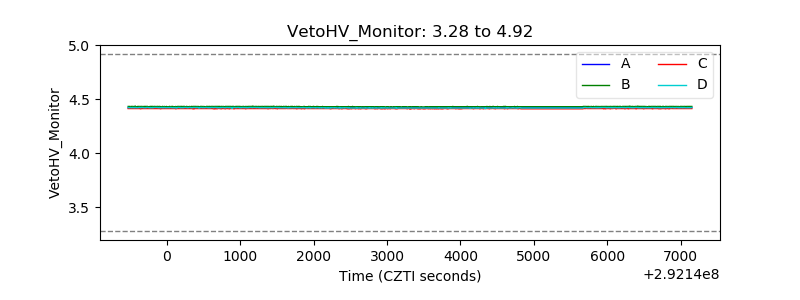 |
| Veto LLD | 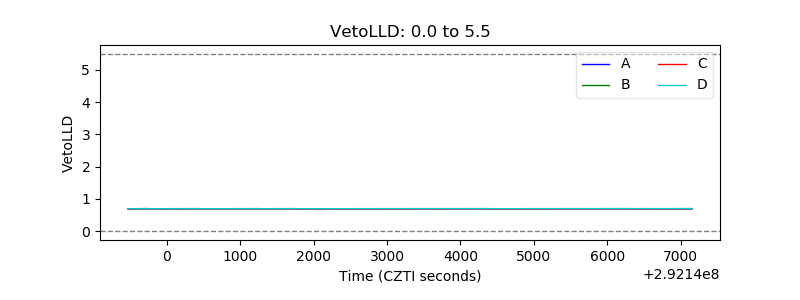 |
| Alpha Counter | 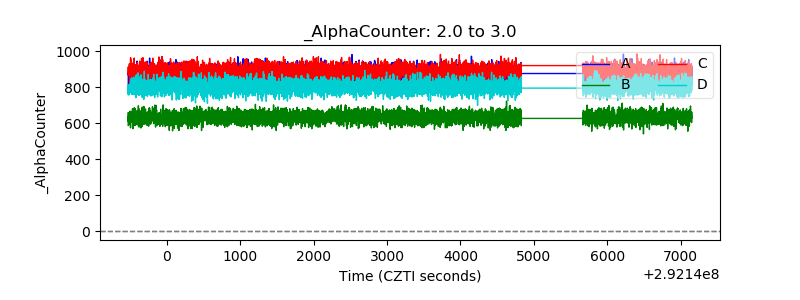 |
| _CPM_Rate | 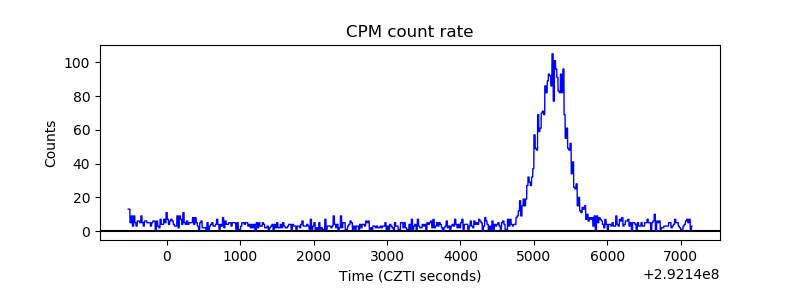 |
| CZT Counter | 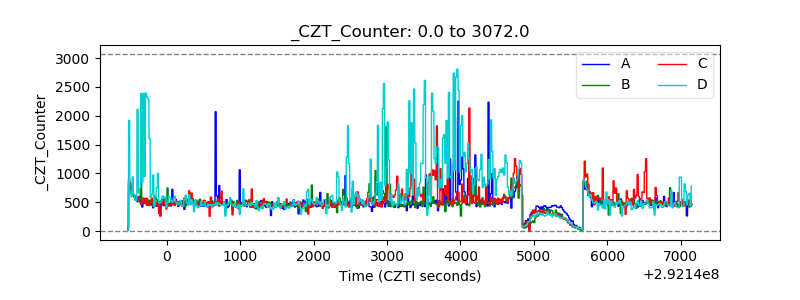 |
| +2.5 Volts monitor |  |
| +5 Volts monitor |  |
| _ROLL_ROT | 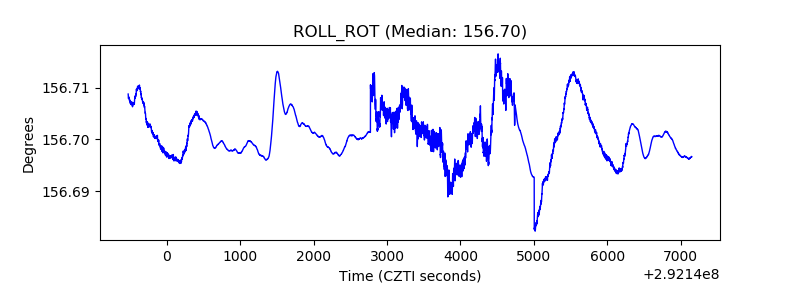 |
| _Roll_DEC | 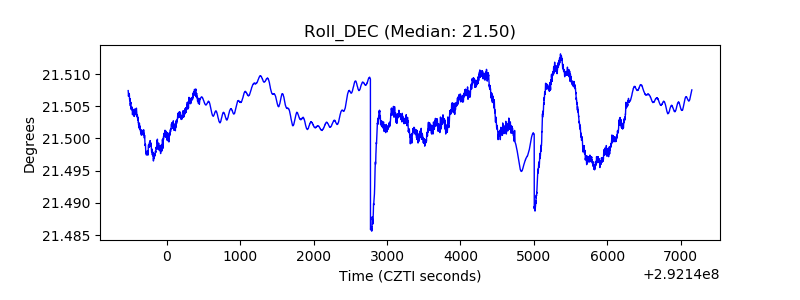 |
| _Roll_RA |  |
| Veto Counter | 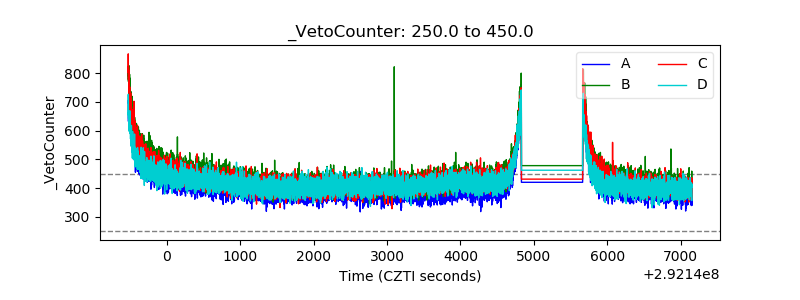 |