| Param | Original file | Final file |
|---|---|---|
| Filename | modeM0/AS1A06_003T05_9000002830_19024cztM0_level2.evt | modeM0/AS1A06_003T05_9000002830_19024cztM0_level2_quad_clean.evt |
| Size (bytes) | 625,988,160 | 89,801,280 |
| Size | 597.0 MB | 85.6 MB |
| Events in quadrant A | 4,338,722 | 545,024 |
| Events in quadrant B | 4,417,494 | 549,484 |
| Events in quadrant C | 4,294,375 | 525,696 |
| Events in quadrant D | 5,329,151 | 507,565 |
| Mode M9 | |||
|---|---|---|---|
| Quadrant | BADHDUFLAG | Total packets | Discarded packets |
| A | 0 | 3 | 0 |
| B | 0 | 3 | 0 |
| C | 0 | 3 | 0 |
| D | 0 | 3 | 0 |
| Mode SS | |||
|---|---|---|---|
| Quadrant | BADHDUFLAG | Total packets | Discarded packets |
| A | 0 | 172 | 0 |
| B | 0 | 172 | 0 |
| C | 0 | 172 | 0 |
| D | 0 | 172 | 0 |
| Mode M0 | |||
|---|---|---|---|
| Quadrant | BADHDUFLAG | Total packets | Discarded packets |
| A | 0 | 18493 | 2 |
| B | 0 | 18526 | 4 |
| C | 0 | 18057 | 2 |
| D | 0 | 21383 | 2 |
| Quadrant | Total seconds | Saturated seconds | Saturation percentage |
|---|---|---|---|
| A | 8518 | 563 | 6.609533% |
| B | 8518 | 567 | 6.656492% |
| C | 8518 | 528 | 6.198638% |
| D | 8518 | 578 | 6.785630% |
Noise dominated data is calculated using 1-second bins in cleaned event files. If a bin has >2000 counts, and if more than 50% of those come from <1% of pixels, then it is considered to be noise-dominated and hence unusable.
| Quadrant | # 1 sec bins | Bins with >0 counts | Bins with >2000 counts | High rate bins dominated by noise | Noise dominated (total time) | Noise dominated (detector-on time) | Marked lightcurve |
|---|---|---|---|---|---|---|---|
| A | 8813 | 8521 | 29 | 29 | 0.33% | 0.34% | 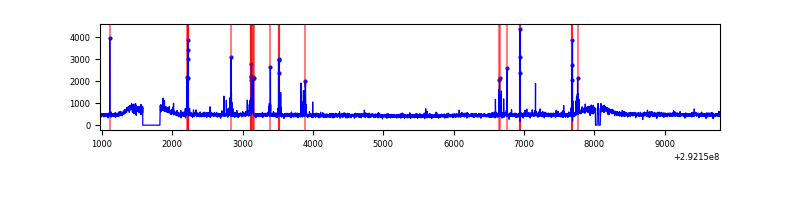 |
| B | 8813 | 8521 | 20 | 20 | 0.23% | 0.23% | 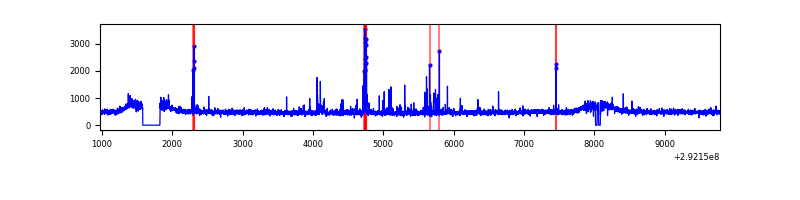 |
| C | 8813 | 8521 | 1 | 1 | 0.01% | 0.01% | 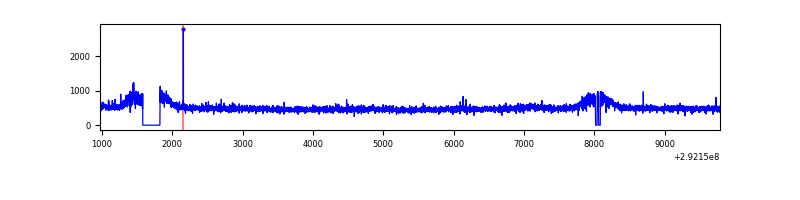 |
| D | 8813 | 8521 | 135 | 135 | 1.53% | 1.58% | 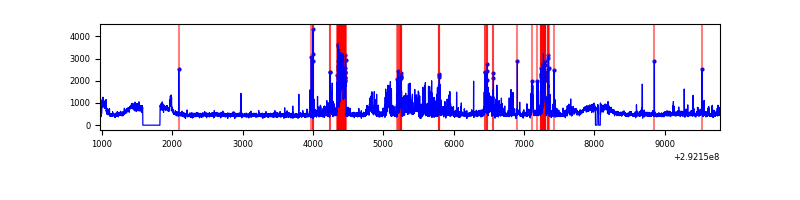 |
Top three noisy pixels from each quadrant. If the there are fewer than three noisy pixels in the level2.evt file, extra rows are filled as -1
| Pixel properties | Quadrant properties | ||||||
|---|---|---|---|---|---|---|---|
| Quadrant | DetID | PixID | Counts | Sigma | Mean | Median | Sigma |
| A | 14 | 235 | 212659 | 974.56 | 1069 | 1043 | 217.1 |
| A | 0 | 226 | 9352 | 38.27 | 1069 | 1043 | 217.1 |
| A | 3 | 137 | 8938 | 36.36 | 1069 | 1043 | 217.1 |
| B | 3 | 112 | 182567 | 876.29 | 1064 | 1034 | 207.2 |
| B | 7 | 220 | 27483 | 127.67 | 1064 | 1034 | 207.2 |
| B | 12 | 111 | 25440 | 117.81 | 1064 | 1034 | 207.2 |
| C | 14 | 238 | 156119 | 648.47 | 1024 | 1026 | 239.2 |
| C | 3 | 233 | 109682 | 454.31 | 1024 | 1026 | 239.2 |
| C | 8 | 128 | 16110 | 63.07 | 1024 | 1026 | 239.2 |
| D | 7 | 238 | 805631 | 3135.81 | 1044 | 1011 | 256.6 |
| D | 1 | 52 | 413589 | 1607.92 | 1044 | 1011 | 256.6 |
| D | 9 | 68 | 111843 | 431.94 | 1044 | 1011 | 256.6 |
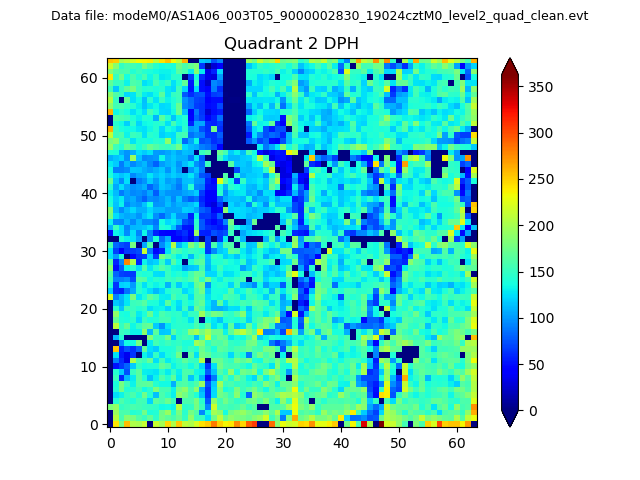
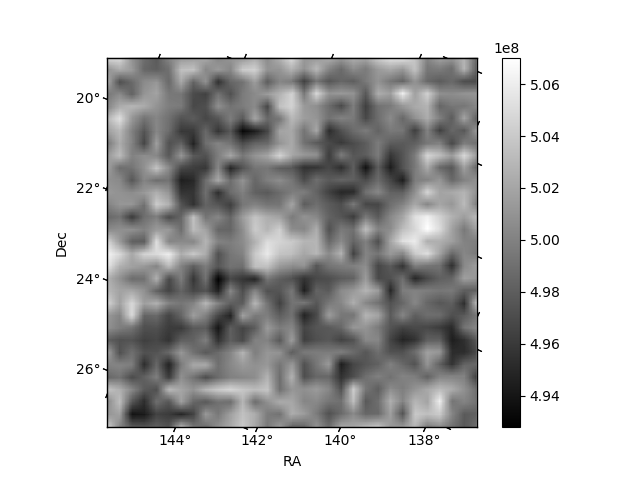
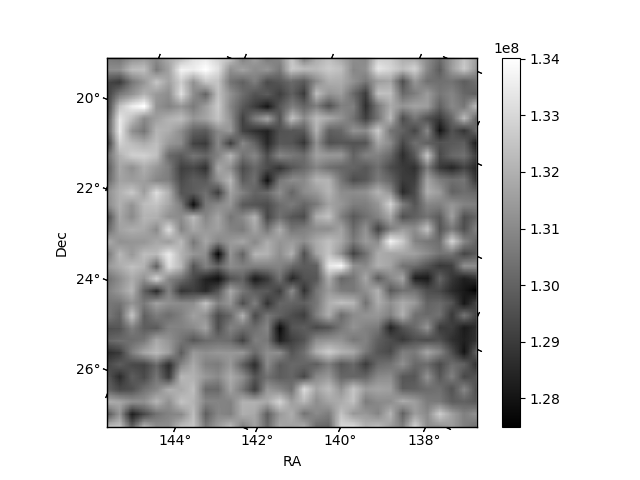
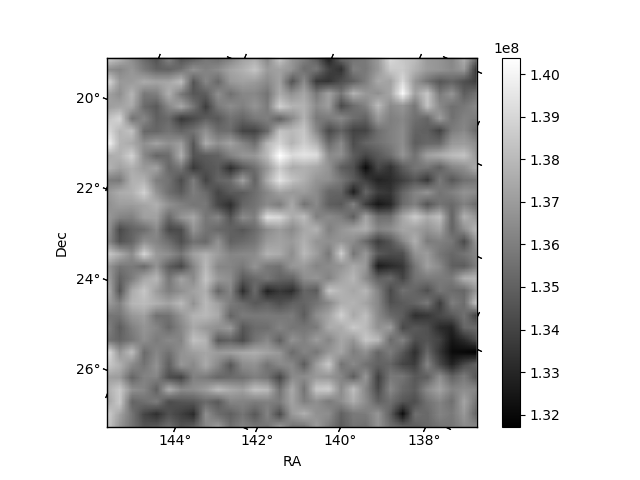
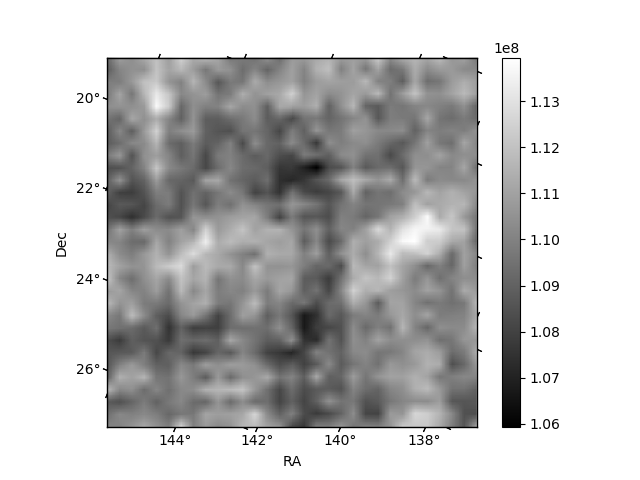
Histogram calculated using DETX and DETY for each event in the final _common_clean file
| Quadrant A | 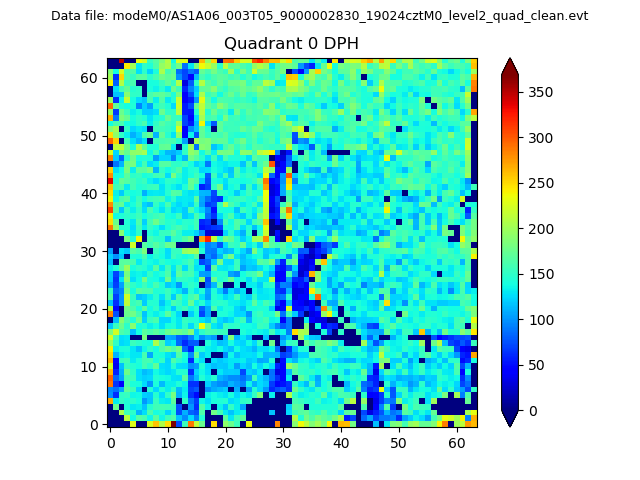 |
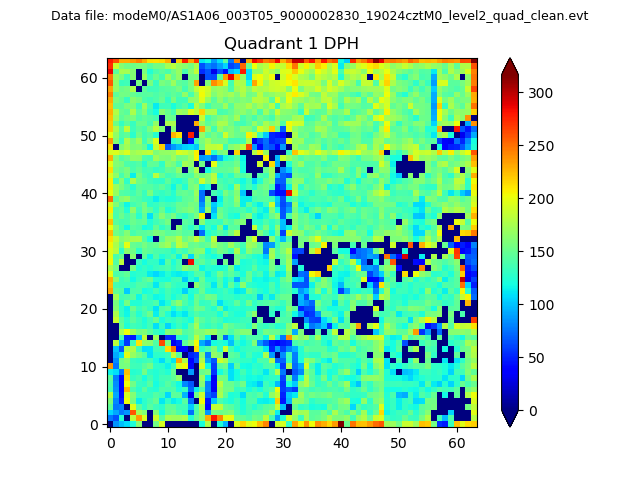 |
Quadrant B |
|---|---|---|---|
| Quadrant D | 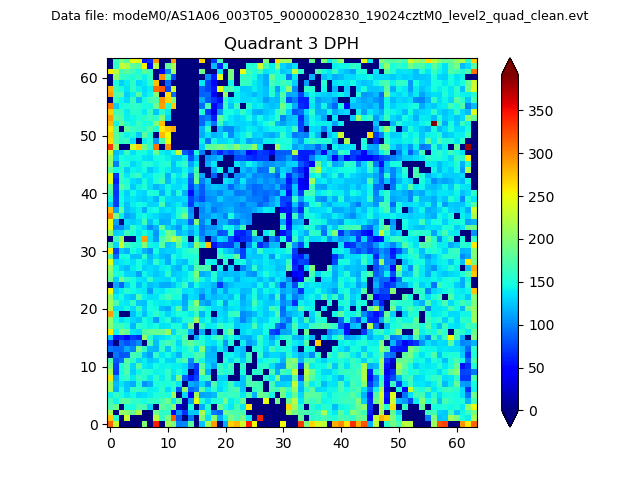 |
 |
Quadrant C |
| Plot type | Count rate plots | Images |
|---|---|---|
| Comparison with Poisson distribution Blue bars denote a histogram of data divided into 1 sec bins. Red curve is a Poisson curve with rate = median count rate of data. |
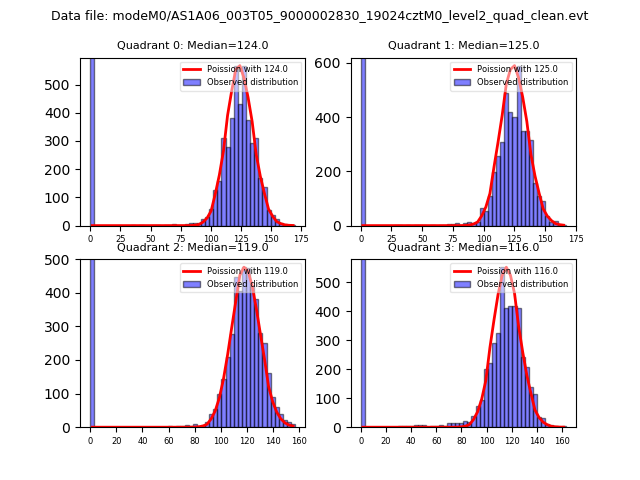 |
 |
| Quadrant-wise count rates Data is divided into 100 sec bins |
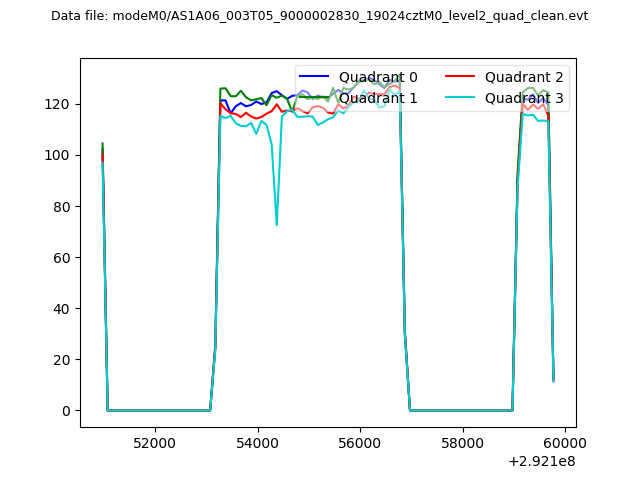 |
|
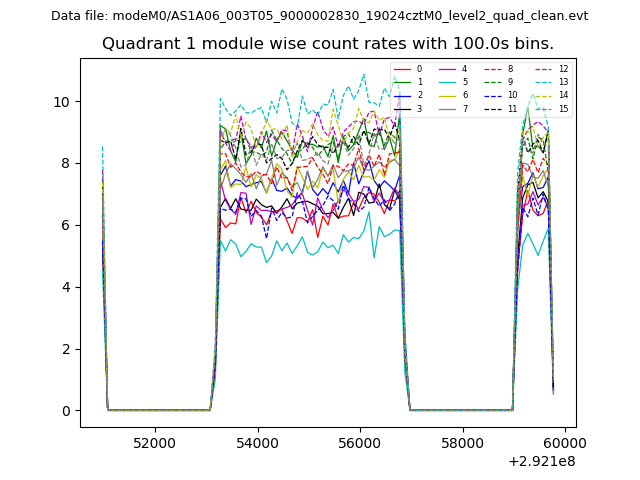
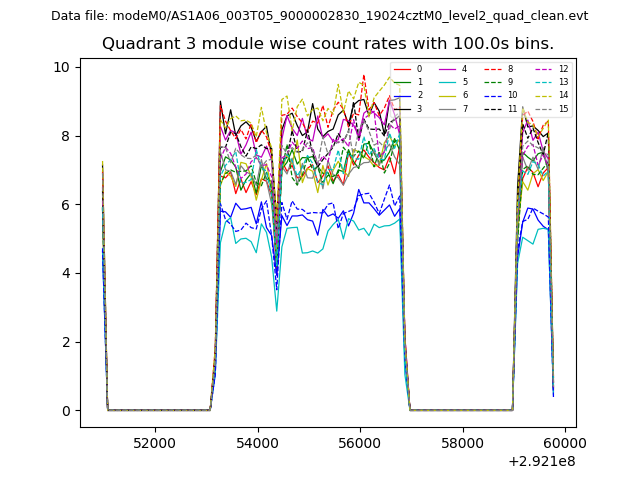
| Module-wise count rates for Quadrant A Data is divided into 100 sec bins |
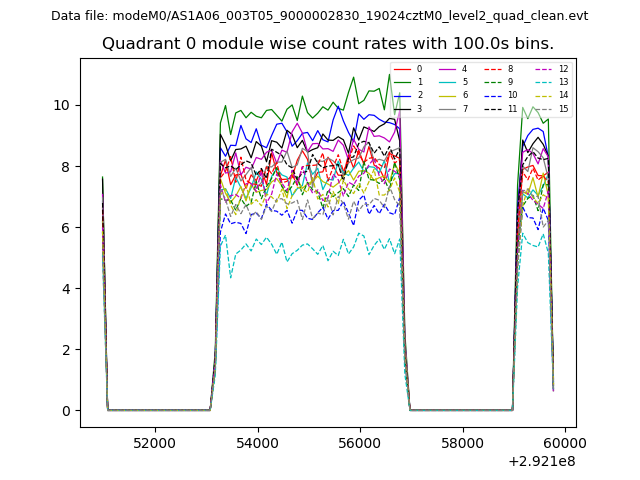 |
 |
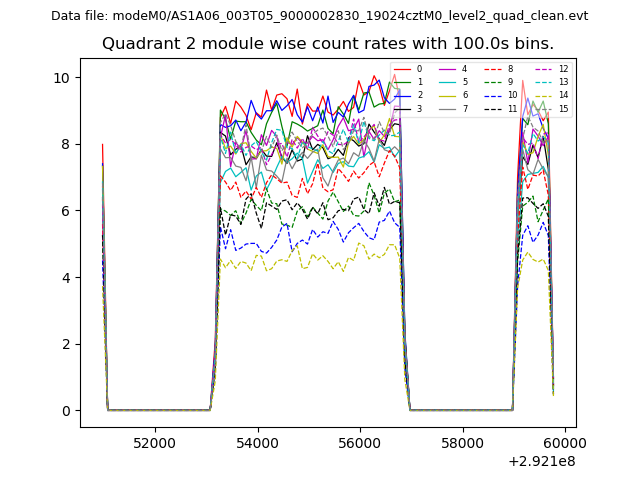
| Module-wise count rates for Quadrant B Data is divided into 100 sec bins |
 |
 |
| Module-wise count rates for Quadrant C Data is divided into 100 sec bins |
 |
 |
| Module-wise count rates for Quadrant D Data is divided into 100 sec bins |
 |
 |
| Parameter | Plot |
|---|---|
| CZT HV Monitor | 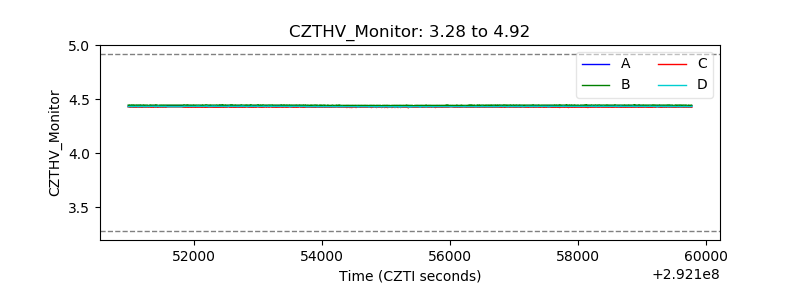 |
| D_VDD | 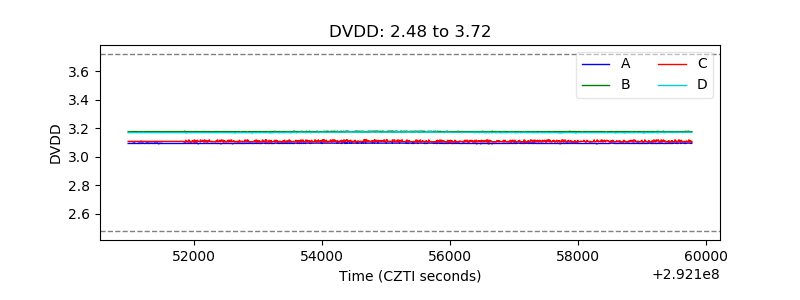 |
| Temperature 1 | 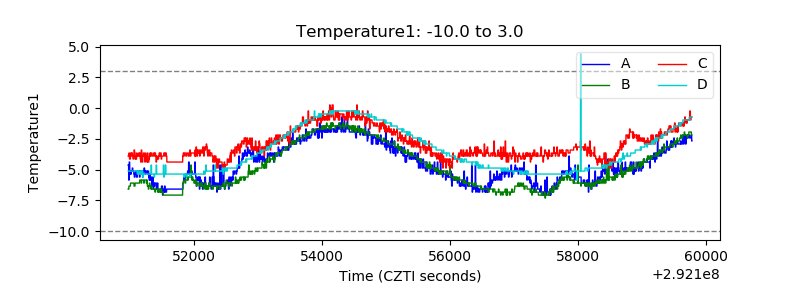 |
| Veto HV Monitor | 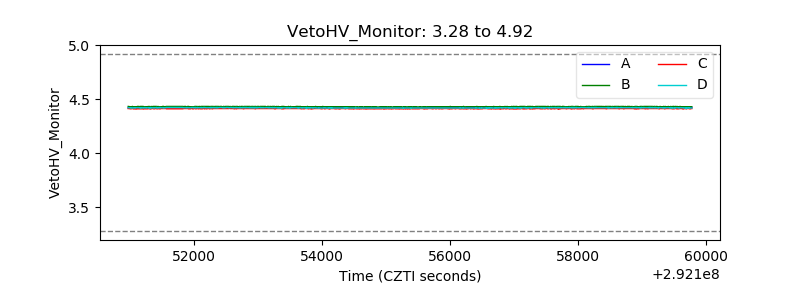 |
| Veto LLD | 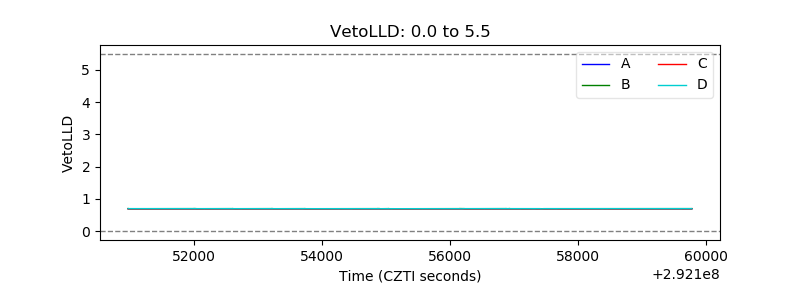 |
| Alpha Counter | 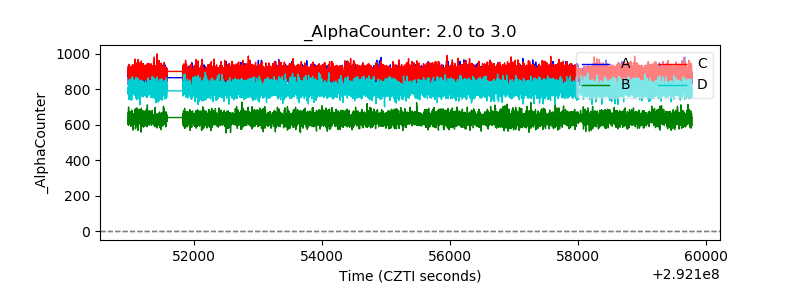 |
| _CPM_Rate | 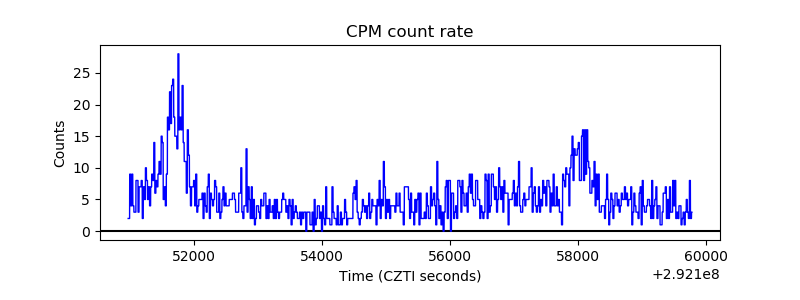 |
| CZT Counter | 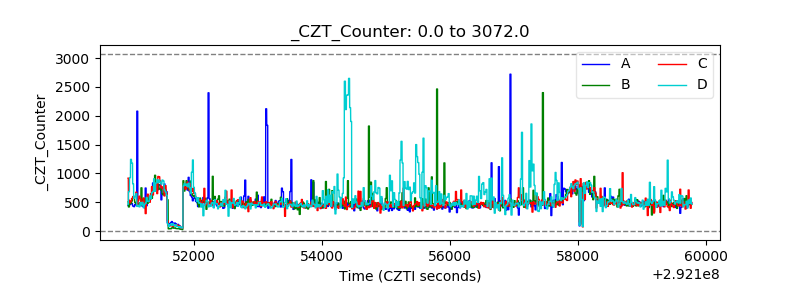 |
| +2.5 Volts monitor |  |
| +5 Volts monitor |  |
| _ROLL_ROT | 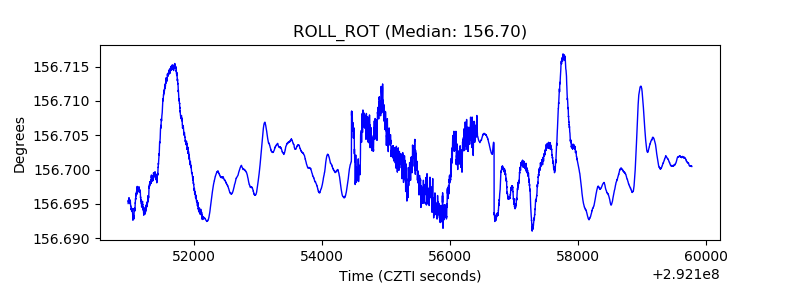 |
| _Roll_DEC | 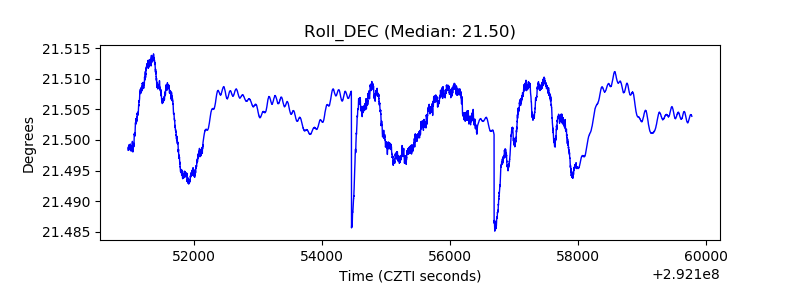 |
| _Roll_RA | 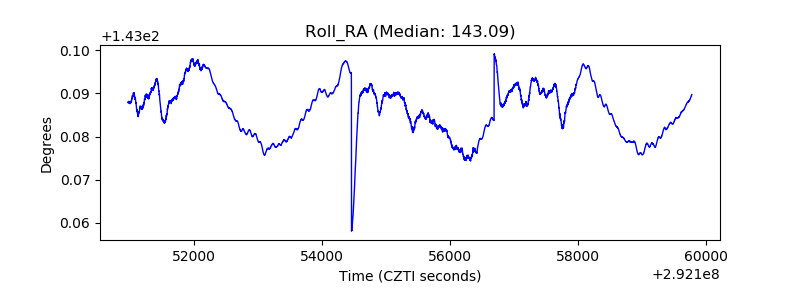 |
| Veto Counter | 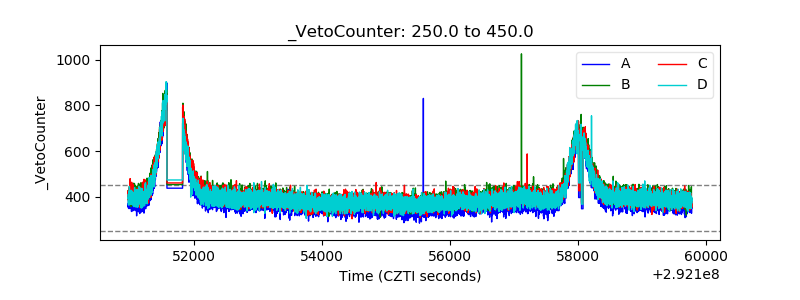 |