| Param | Original file | Final file |
|---|---|---|
| Filename | modeM0/AS1A06_003T05_9000002830_19025cztM0_level2.evt | modeM0/AS1A06_003T05_9000002830_19025cztM0_level2_quad_clean.evt |
| Size (bytes) | 666,155,520 | 94,357,440 |
| Size | 635.3 MB | 90.0 MB |
| Events in quadrant A | 4,151,392 | 597,733 |
| Events in quadrant B | 4,571,994 | 598,531 |
| Events in quadrant C | 4,218,921 | 573,476 |
| Events in quadrant D | 6,656,079 | 497,447 |
| Mode M9 | |||
|---|---|---|---|
| Quadrant | BADHDUFLAG | Total packets | Discarded packets |
| A | 0 | 2 | 0 |
| B | 0 | 2 | 0 |
| C | 0 | 2 | 0 |
| D | 0 | 2 | 0 |
| Mode SS | |||
|---|---|---|---|
| Quadrant | BADHDUFLAG | Total packets | Discarded packets |
| A | 0 | 172 | 0 |
| B | 0 | 172 | 0 |
| C | 0 | 172 | 0 |
| D | 0 | 172 | 0 |
| Mode M0 | |||
|---|---|---|---|
| Quadrant | BADHDUFLAG | Total packets | Discarded packets |
| A | 0 | 17905 | 2 |
| B | 0 | 18950 | 2 |
| C | 0 | 17912 | 2 |
| D | 0 | 25352 | 2 |
| Quadrant | Total seconds | Saturated seconds | Saturation percentage |
|---|---|---|---|
| A | 8490 | 414 | 4.876325% |
| B | 8490 | 501 | 5.901060% |
| C | 8491 | 417 | 4.911082% |
| D | 8491 | 1120 | 13.190437% |
Noise dominated data is calculated using 1-second bins in cleaned event files. If a bin has >2000 counts, and if more than 50% of those come from <1% of pixels, then it is considered to be noise-dominated and hence unusable.
| Quadrant | # 1 sec bins | Bins with >0 counts | Bins with >2000 counts | High rate bins dominated by noise | Noise dominated (total time) | Noise dominated (detector-on time) | Marked lightcurve |
|---|---|---|---|---|---|---|---|
| A | 8770 | 8493 | 6 | 6 | 0.07% | 0.07% | 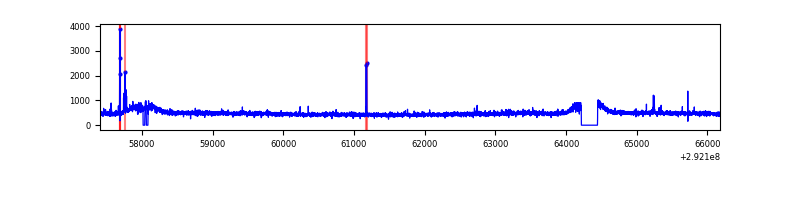 |
| B | 8770 | 8493 | 55 | 55 | 0.63% | 0.65% | 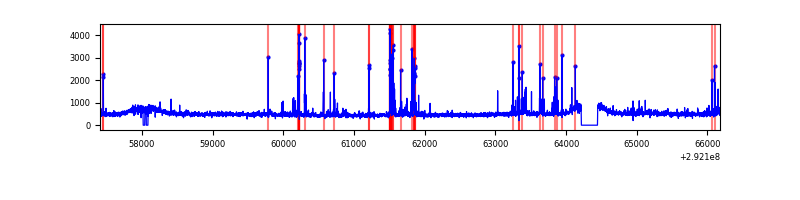 |
| C | 8771 | 8494 | 0 | 0 | 0.00% | 0.00% | 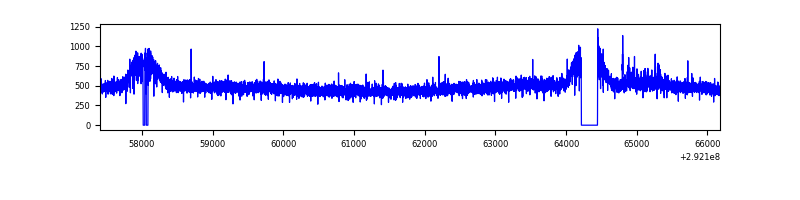 |
| D | 8770 | 8493 | 693 | 693 | 7.90% | 8.16% | 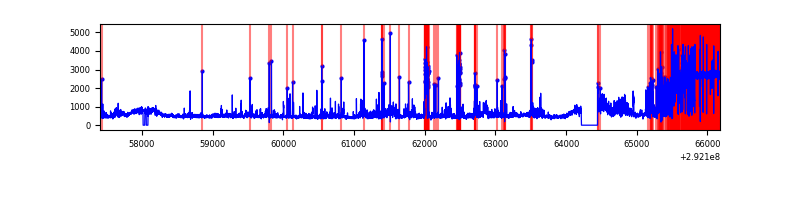 |
Top three noisy pixels from each quadrant. If the there are fewer than three noisy pixels in the level2.evt file, extra rows are filled as -1
| Pixel properties | Quadrant properties | ||||||
|---|---|---|---|---|---|---|---|
| Quadrant | DetID | PixID | Counts | Sigma | Mean | Median | Sigma |
| A | 14 | 235 | 45591 | 206.39 | 1063 | 1038 | 215.9 |
| A | 9 | 143 | 9755 | 40.38 | 1063 | 1038 | 215.9 |
| A | 0 | 226 | 9331 | 38.42 | 1063 | 1038 | 215.9 |
| B | 3 | 112 | 203673 | 990.86 | 1051 | 1021 | 204.5 |
| B | 7 | 220 | 137459 | 667.11 | 1051 | 1021 | 204.5 |
| B | 3 | 64 | 36576 | 173.84 | 1051 | 1021 | 204.5 |
| C | 14 | 238 | 156155 | 651.47 | 1014 | 1017 | 238.1 |
| C | 3 | 233 | 83951 | 348.26 | 1014 | 1017 | 238.1 |
| C | 8 | 128 | 12586 | 48.58 | 1014 | 1017 | 238.1 |
| D | 1 | 52 | 2145977 | 9002.92 | 974 | 941 | 238.3 |
| D | 7 | 238 | 773093 | 3240.79 | 974 | 941 | 238.3 |
| D | 2 | 234 | 36070 | 147.44 | 974 | 941 | 238.3 |
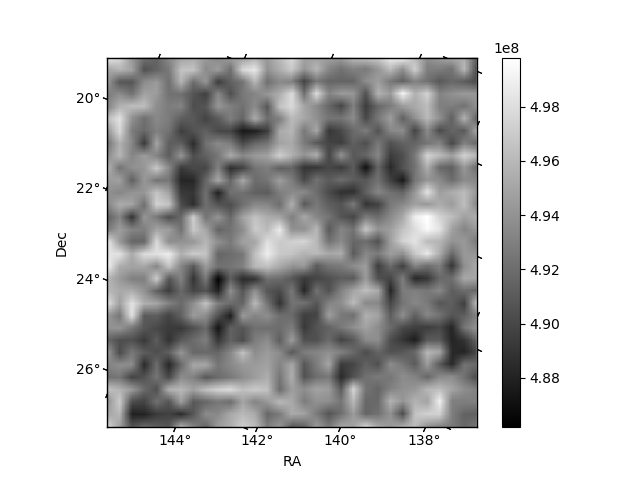
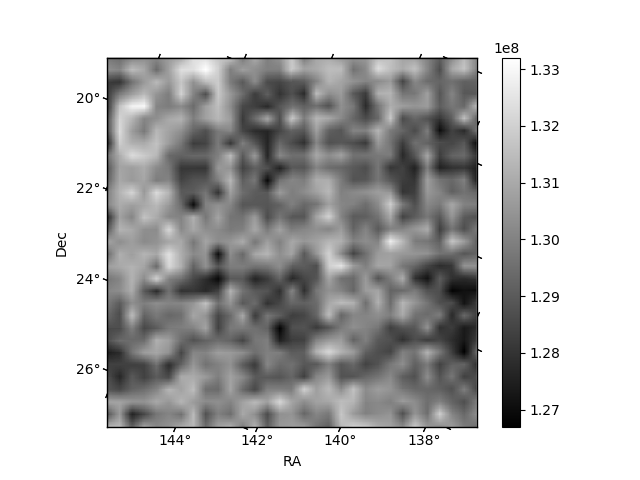
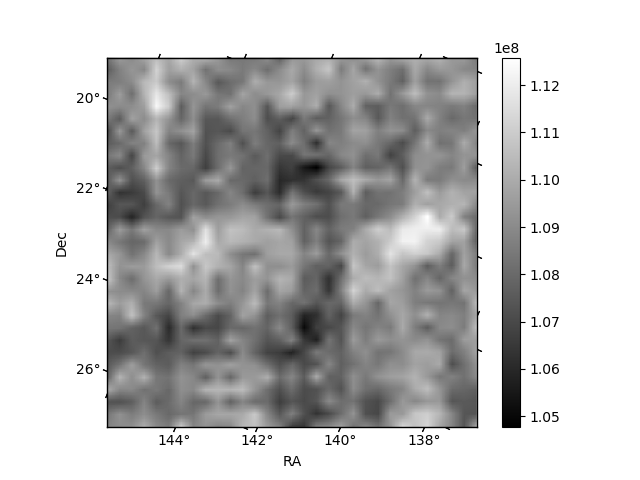
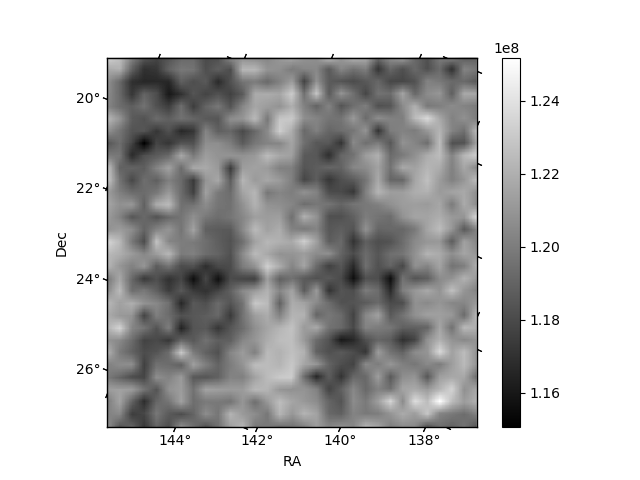
Histogram calculated using DETX and DETY for each event in the final _common_clean file
| Quadrant A | 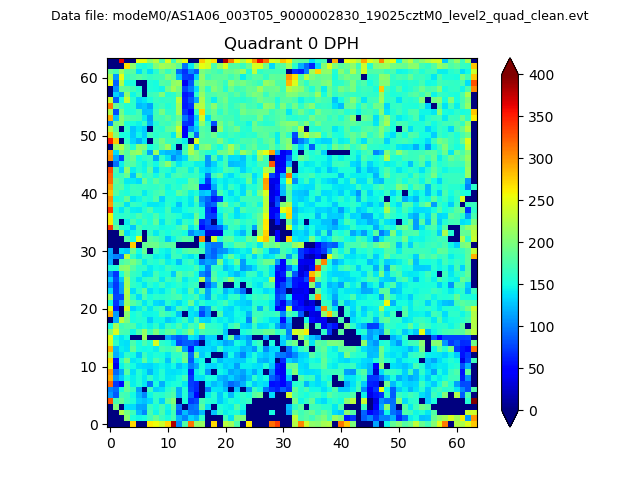 |
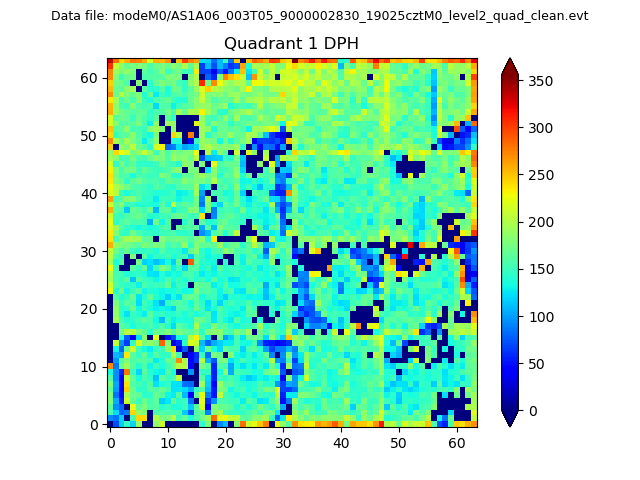 |
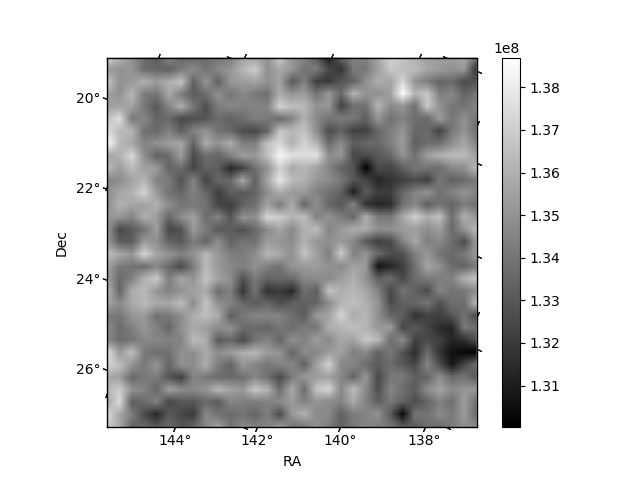
Quadrant B |
|---|---|---|---|
| Quadrant D | 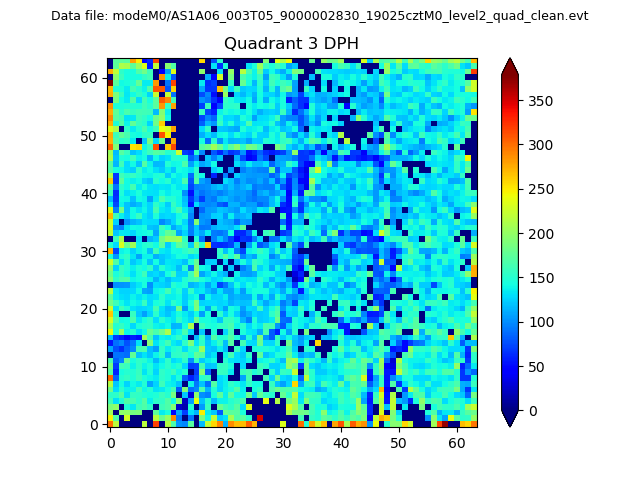 |
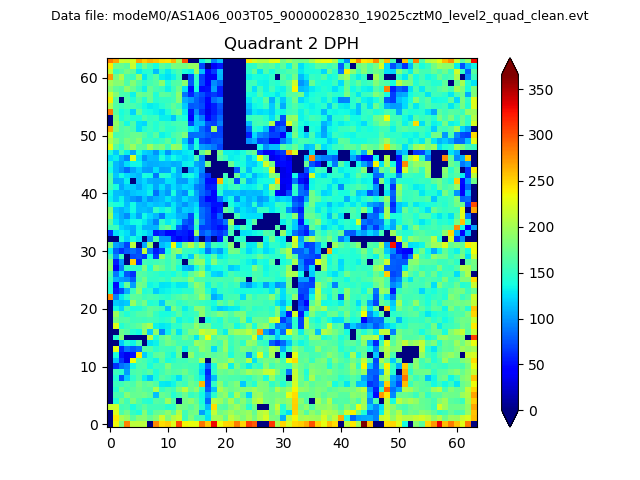 |
Quadrant C |
| Plot type | Count rate plots | Images |
|---|---|---|
| Comparison with Poisson distribution Blue bars denote a histogram of data divided into 1 sec bins. Red curve is a Poisson curve with rate = median count rate of data. |
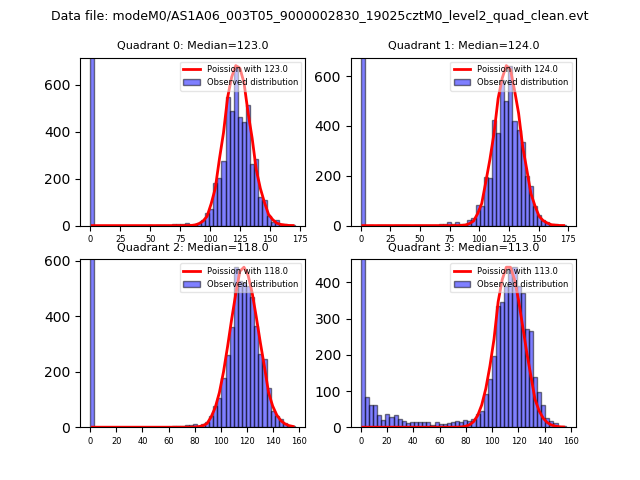 |
 |
| Quadrant-wise count rates Data is divided into 100 sec bins |
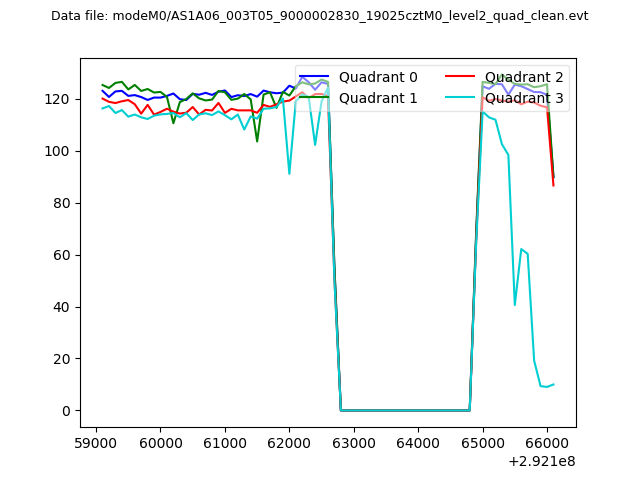 |
|
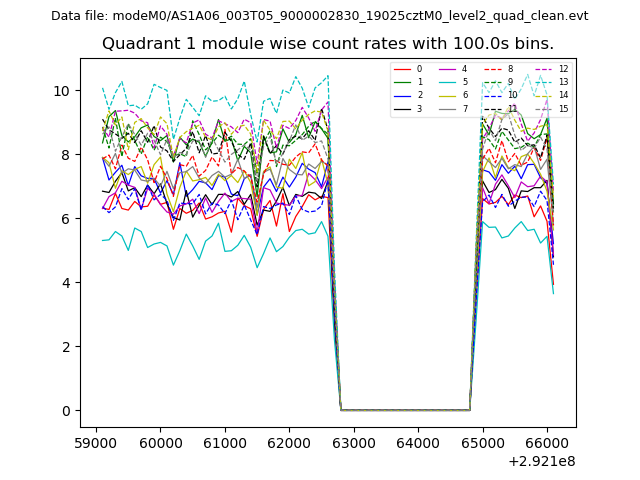
| Module-wise count rates for Quadrant A Data is divided into 100 sec bins |
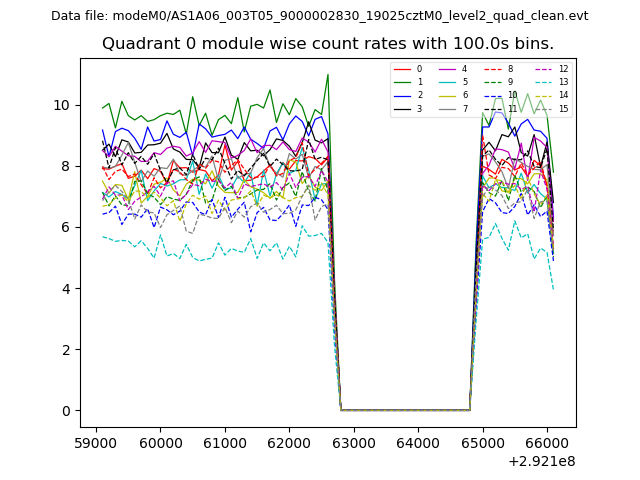 |
 |
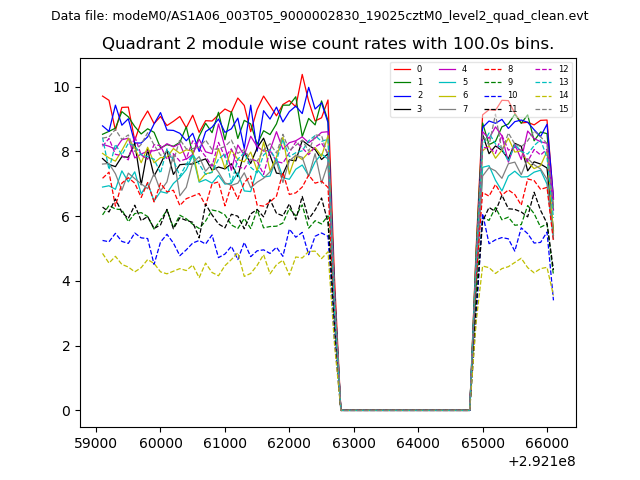
| Module-wise count rates for Quadrant B Data is divided into 100 sec bins |
 |
 |
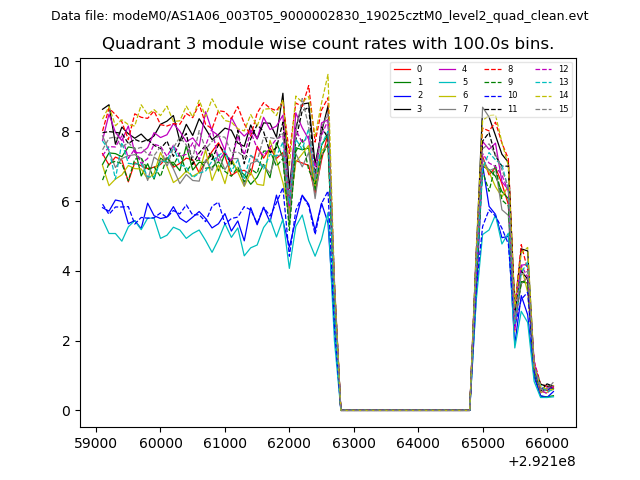
| Module-wise count rates for Quadrant C Data is divided into 100 sec bins |
 |
 |
| Module-wise count rates for Quadrant D Data is divided into 100 sec bins |
 |
 |
| Parameter | Plot |
|---|---|
| CZT HV Monitor | 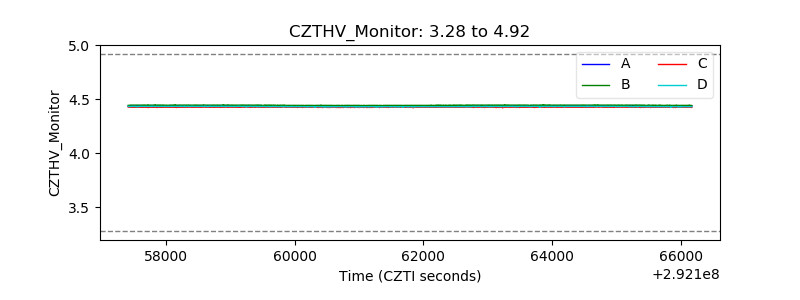 |
| D_VDD | 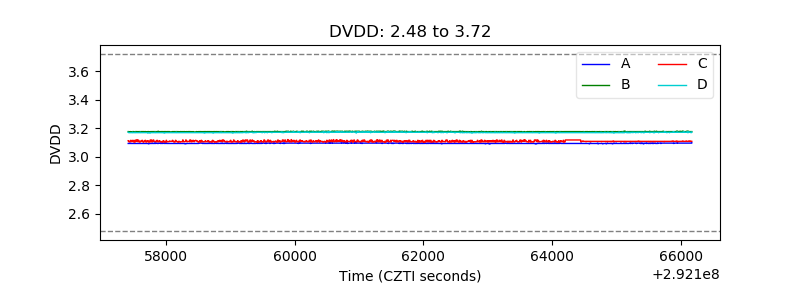 |
| Temperature 1 | 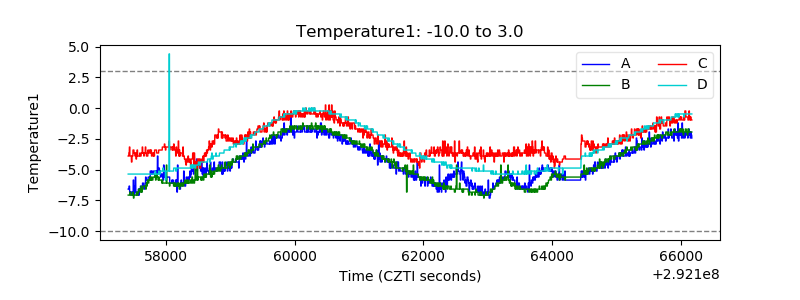 |
| Veto HV Monitor | 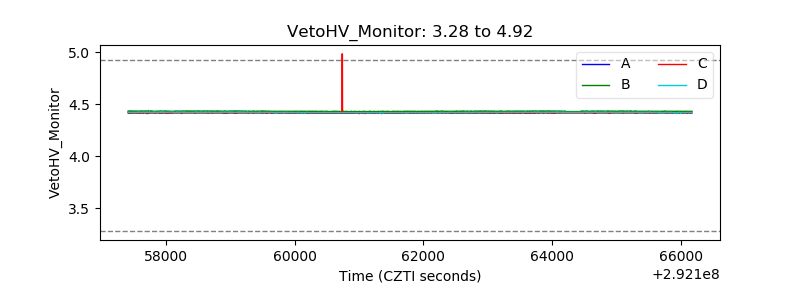 |
| Veto LLD | 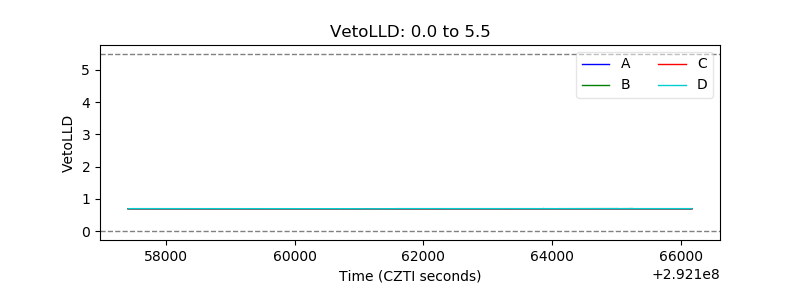 |
| Alpha Counter | 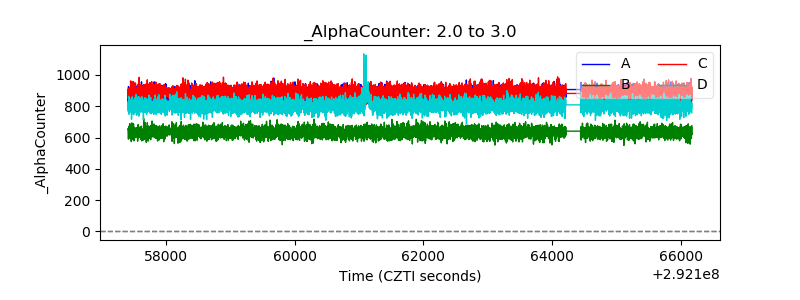 |
| _CPM_Rate | 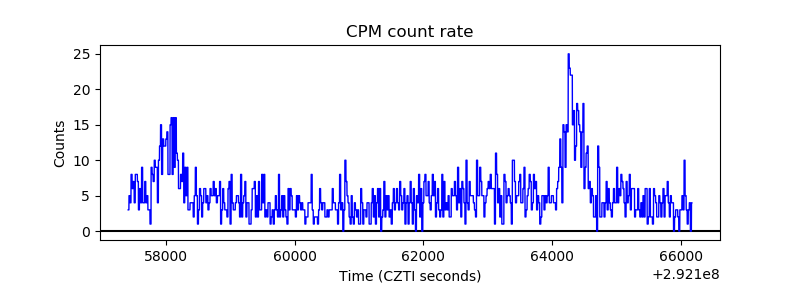 |
| CZT Counter | 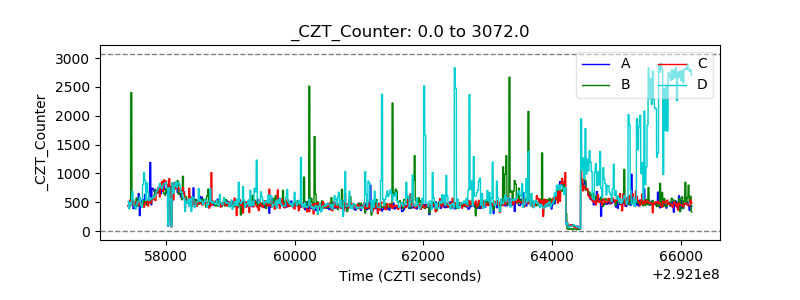 |
| +2.5 Volts monitor |  |
| +5 Volts monitor |  |
| _ROLL_ROT | 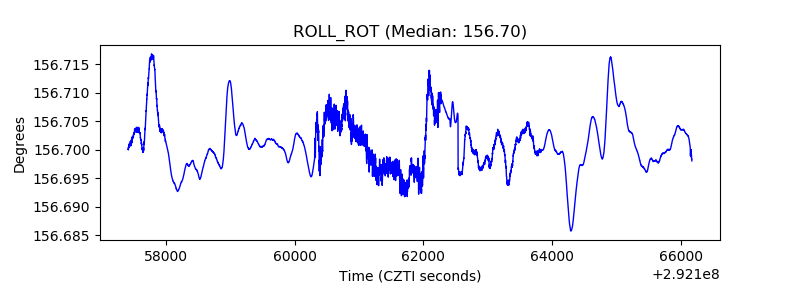 |
| _Roll_DEC |  |
| _Roll_RA | 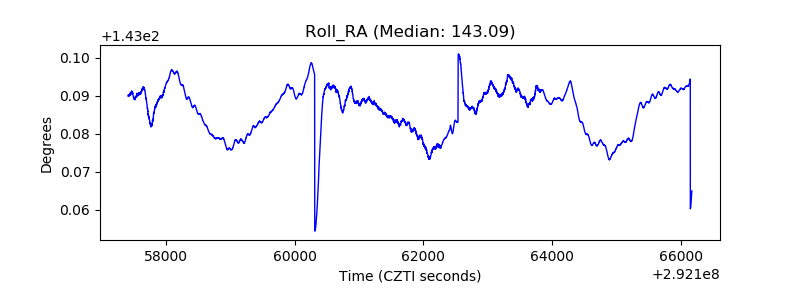 |
| Veto Counter | 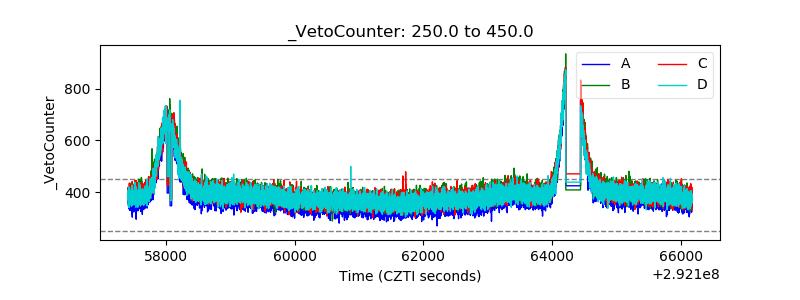 |