| Param | Original file | Final file |
|---|---|---|
| Filename | modeM0/AS1A05_022T03_9000002832cztM0_level2.fits | modeM0/AS1A05_022T03_9000002832cztM0_level2_quad_clean.evt |
| Size (bytes) | 125,415,360 | 119,836,800 |
| Size | 119.6 MB | 114.3 MB |
| Events in quadrant A | 796,318 | 744,159 |
| Events in quadrant B | 763,870 | 735,706 |
| Events in quadrant C | 778,412 | 701,491 |
| Events in quadrant D | 493,000 | 482,584 |
| Mode M0 | |||
|---|---|---|---|
| Quadrant | BADHDUFLAG | Total packets | Discarded packets |
| A | 0 | 28704 | 0 |
| B | 0 | 31583 | 0 |
| C | 0 | 28995 | 0 |
| D | 0 | 59973 | 0 |
| Mode M9 | |||
|---|---|---|---|
| Quadrant | BADHDUFLAG | Total packets | Discarded packets |
| A | 0 | 20 | 0 |
| B | 0 | 20 | 0 |
| C | 0 | 20 | 0 |
| D | 0 | 20 | 0 |
| Mode SS | |||
|---|---|---|---|
| Quadrant | BADHDUFLAG | Total packets | Discarded packets |
| A | 0 | 284 | 0 |
| B | 0 | 284 | 0 |
| C | 0 | 284 | 0 |
| D | 0 | 284 | 0 |
| Quadrant | Total seconds | Saturated seconds | Saturation percentage |
|---|---|---|---|
| A | 13973 | 185 | 1.323982% |
| B | 13973 | 391 | 2.798254% |
| C | 13973 | 251 | 1.796321% |
| D | 13973 | 4416 | 31.603807% |
Noise dominated data is calculated using 1-second bins in cleaned event files. If a bin has >2000 counts, and if more than 50% of those come from <1% of pixels, then it is considered to be noise-dominated and hence unusable.
| Quadrant | # 1 sec bins | Bins with >0 counts | Bins with >2000 counts | High rate bins dominated by noise | Noise dominated (total time) | Noise dominated (detector-on time) | Marked lightcurve |
|---|---|---|---|---|---|---|---|
| A | 15913 | 13973 | 0 | 0 | 0.00% | 0.00% | 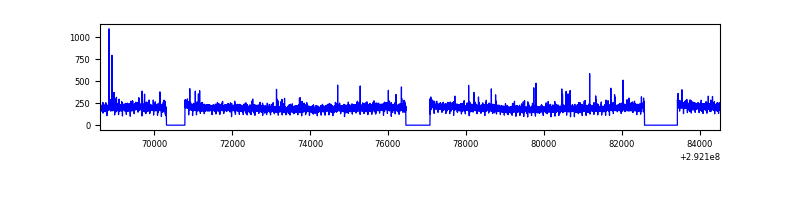 |
| B | 15913 | 13966 | 0 | 0 | 0.00% | 0.00% | 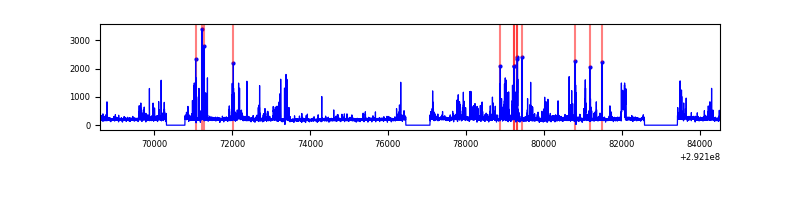 |
| C | 15913 | 13973 | 0 | 0 | 0.00% | 0.00% | 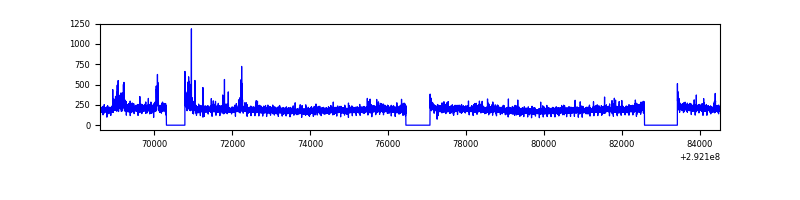 |
| D | 15913 | 11702 | 0 | 0 | 0.00% | 0.00% | 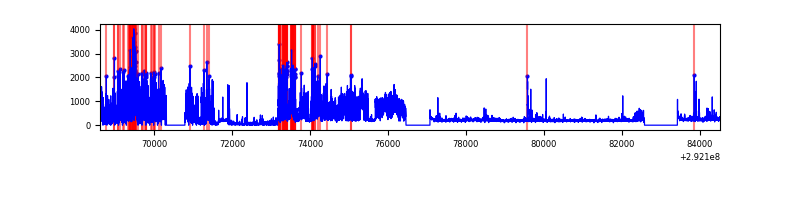 |
Top three noisy pixels from each quadrant. If the there are fewer than three noisy pixels in the level2.evt file, extra rows are filled as -1
| Pixel properties | Quadrant properties | ||||||
|---|---|---|---|---|---|---|---|
| Quadrant | DetID | PixID | Counts | Sigma | Mean | Median | Sigma |
| A | 0 | 29 | 784 | 10.66 | 207 | 194 | 55.3 |
| A | 9 | 19 | 634 | 7.95 | 207 | 194 | 55.3 |
| A | 0 | 30 | 617 | 7.64 | 207 | 194 | 55.3 |
| B | 2 | 9 | 641 | 10.41 | 201 | 191 | 43.2 |
| B | 2 | 8 | 540 | 8.08 | 201 | 191 | 43.2 |
| B | 14 | 254 | 514 | 7.47 | 201 | 191 | 43.2 |
| C | 1 | 80 | 568 | 7.02 | 204 | 190 | 53.8 |
| C | 1 | 81 | 565 | 6.97 | 204 | 190 | 53.8 |
| C | 7 | 111 | 543 | 6.56 | 204 | 190 | 53.8 |
| D | 6 | 38 | 380 | 6.55 | 140 | 128 | 38.5 |
| D | 10 | 190 | 375 | 6.42 | 140 | 128 | 38.5 |
| D | 6 | 231 | 353 | 5.85 | 140 | 128 | 38.5 |
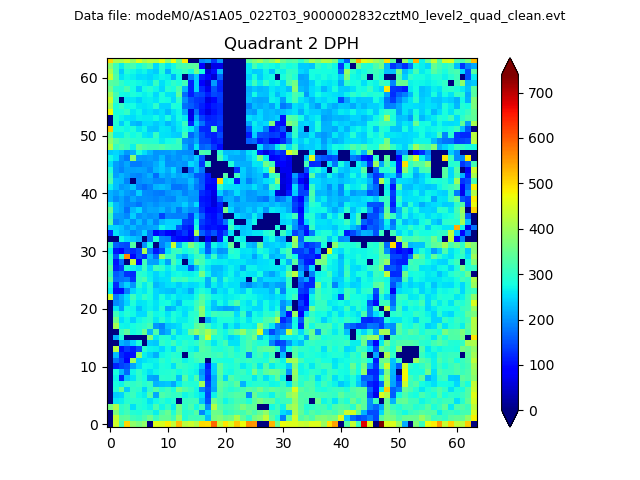
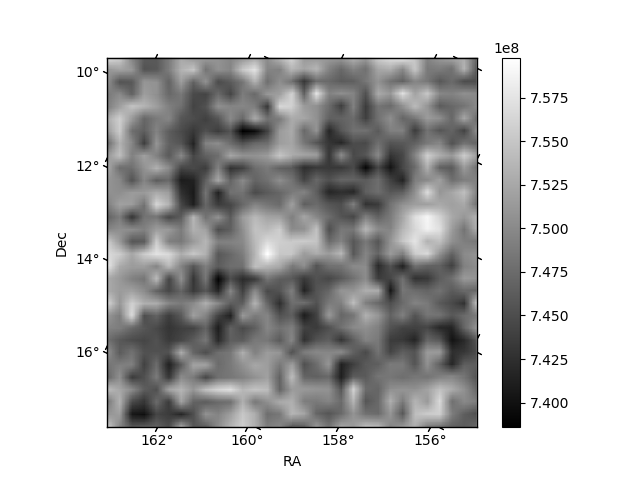
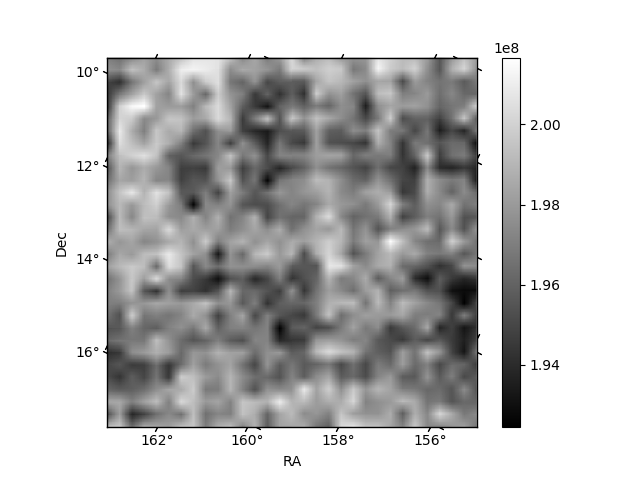
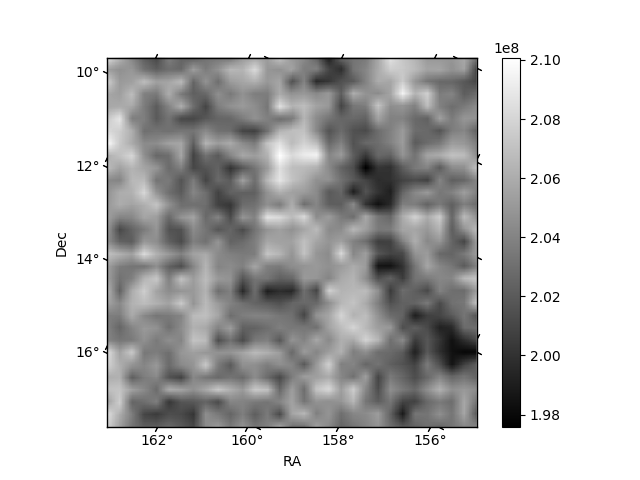
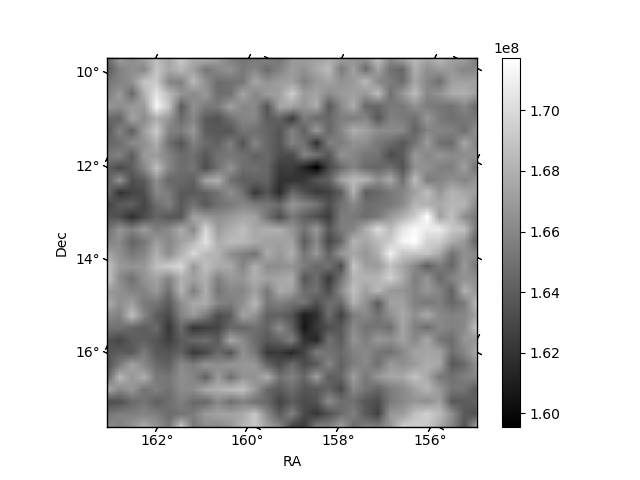
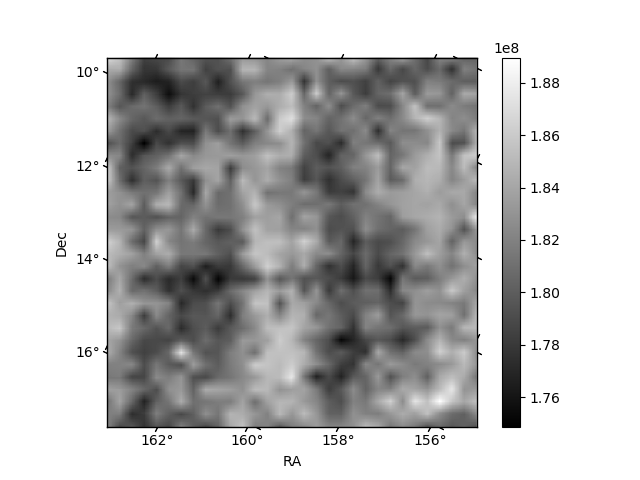
Histogram calculated using DETX and DETY for each event in the final _common_clean file
| Quadrant A | 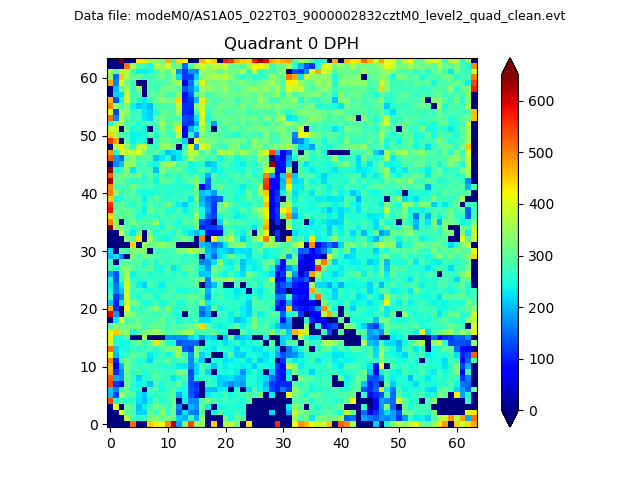 |
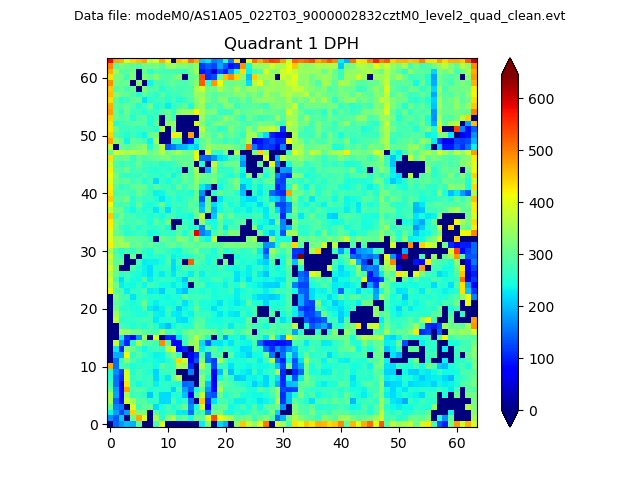 |
Quadrant B |
|---|---|---|---|
| Quadrant D | 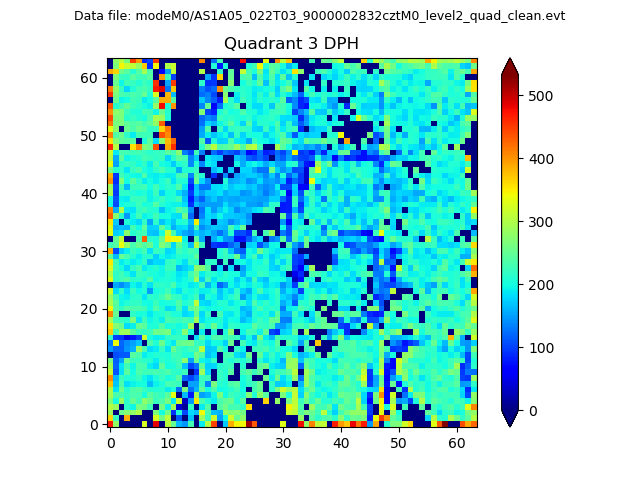 |
 |
Quadrant C |
| Plot type | Count rate plots | Images |
|---|---|---|
| Comparison with Poisson distribution Blue bars denote a histogram of data divided into 1 sec bins. Red curve is a Poisson curve with rate = median count rate of data. |
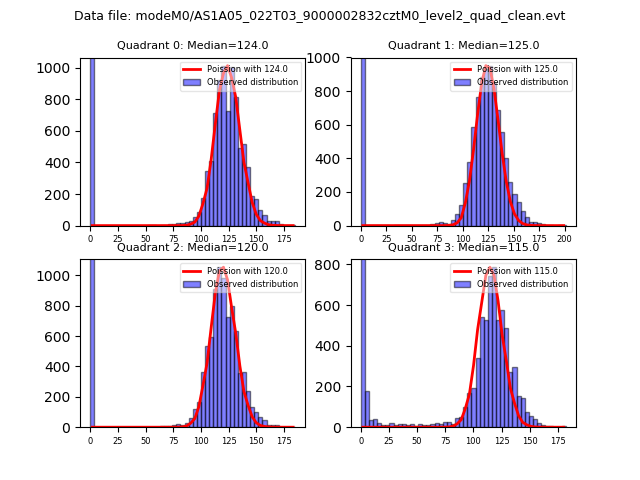 |
 |
| Quadrant-wise count rates Data is divided into 100 sec bins |
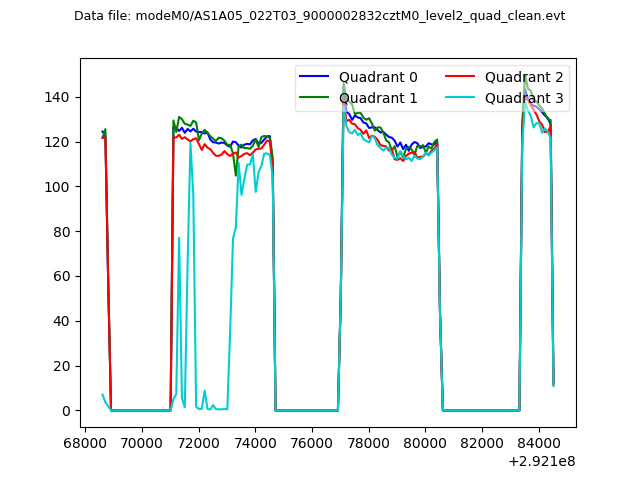 |
|
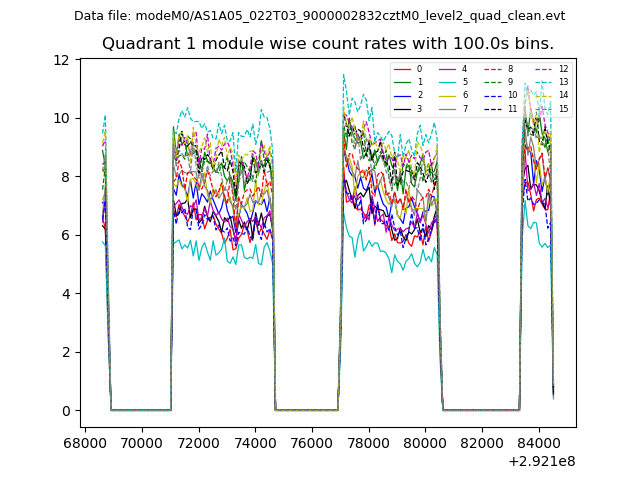
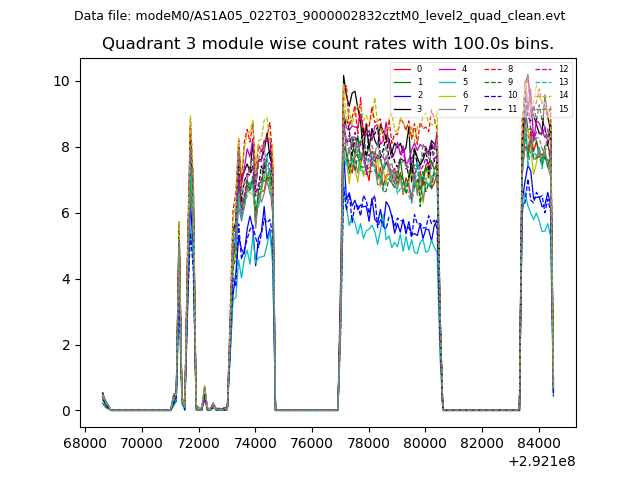
| Module-wise count rates for Quadrant A Data is divided into 100 sec bins |
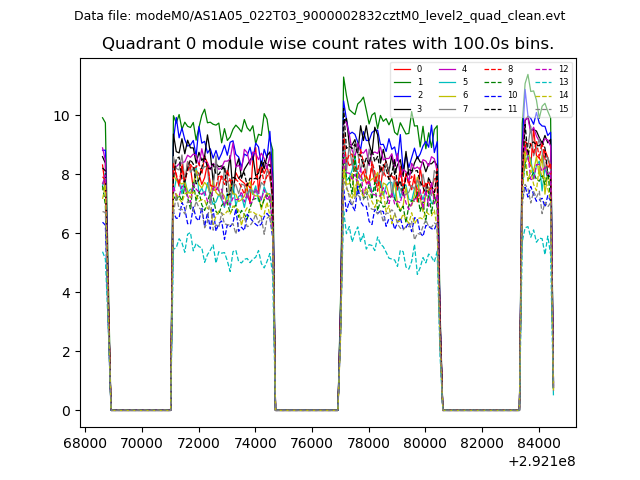 |
 |
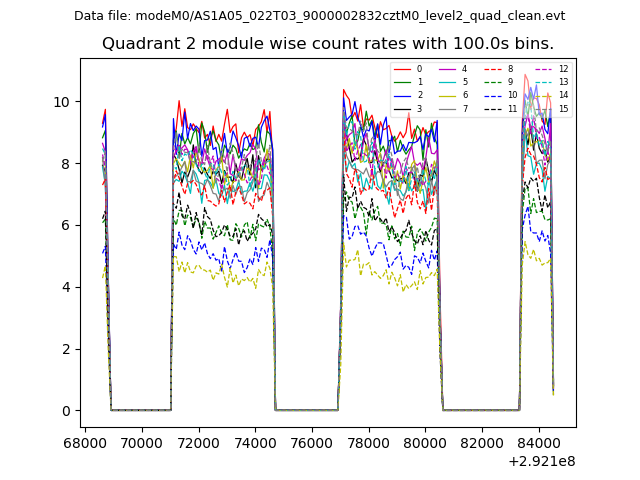
| Module-wise count rates for Quadrant B Data is divided into 100 sec bins |
 |
 |
| Module-wise count rates for Quadrant C Data is divided into 100 sec bins |
 |
 |
| Module-wise count rates for Quadrant D Data is divided into 100 sec bins |
 |
 |
| Parameter | Plot |
|---|---|
| CZT HV Monitor | 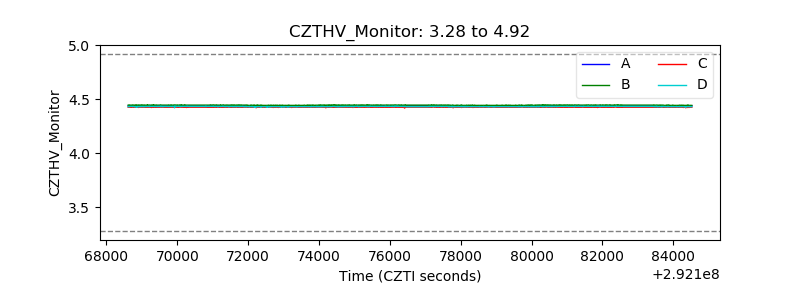 |
| D_VDD | 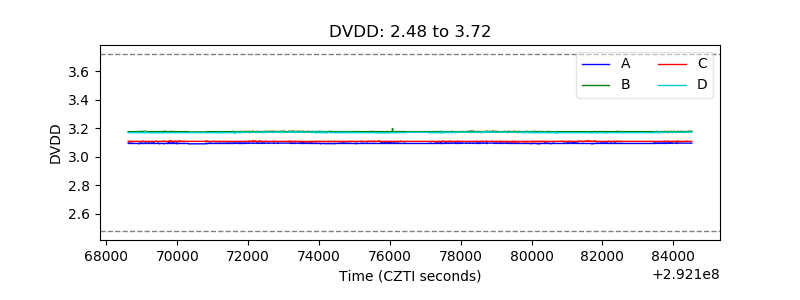 |
| Temperature 1 | 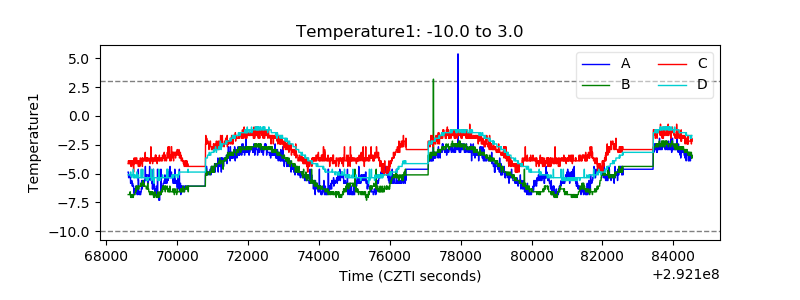 |
| Veto HV Monitor | 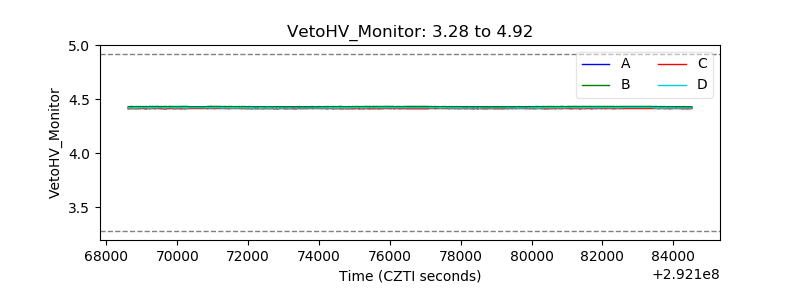 |
| Veto LLD | 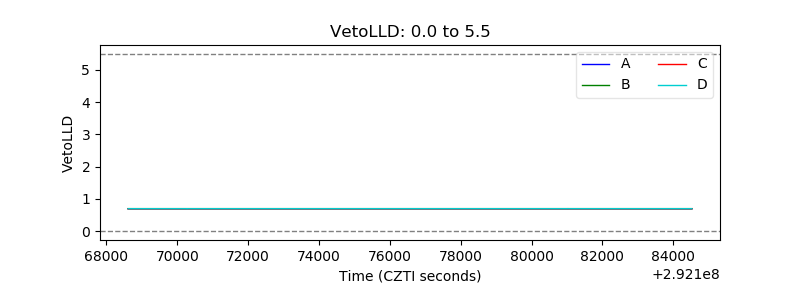 |
| Alpha Counter | 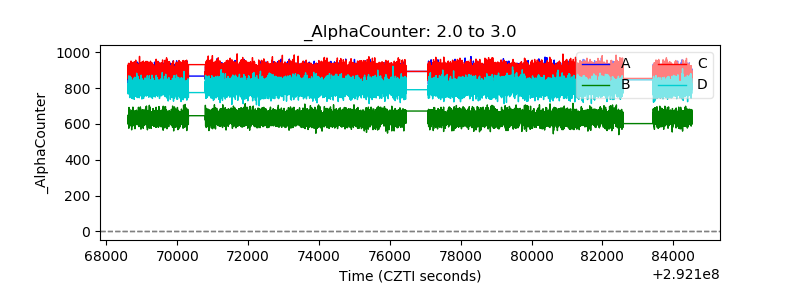 |
| _CPM_Rate | 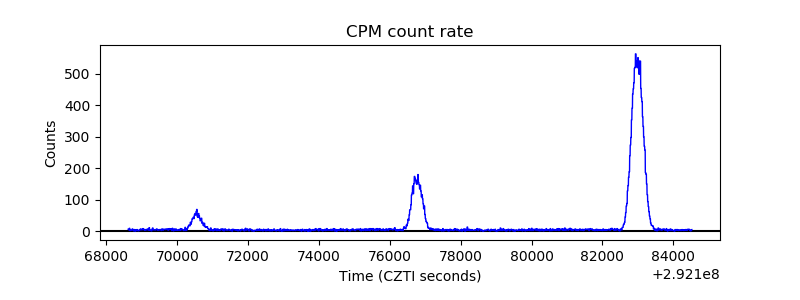 |
| CZT Counter | 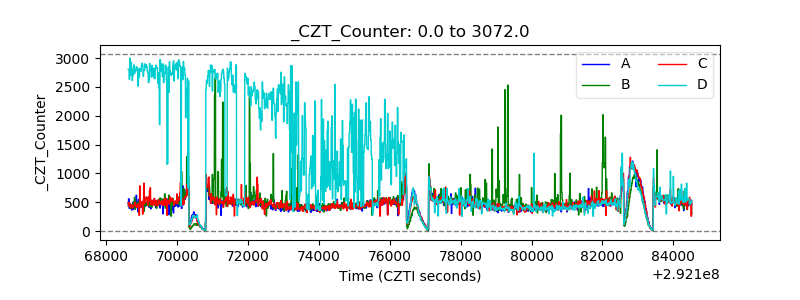 |
| +2.5 Volts monitor | 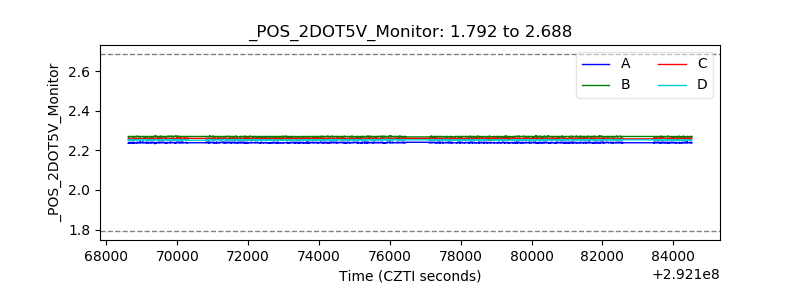 |
| +5 Volts monitor | 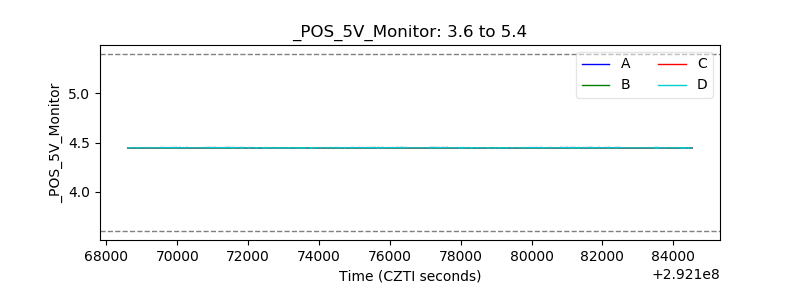 |
| _ROLL_ROT | 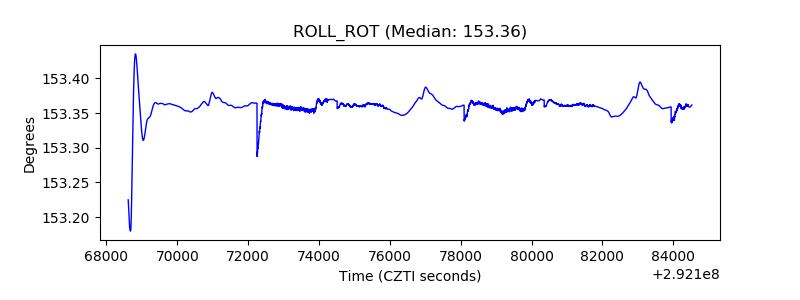 |
| _Roll_DEC | 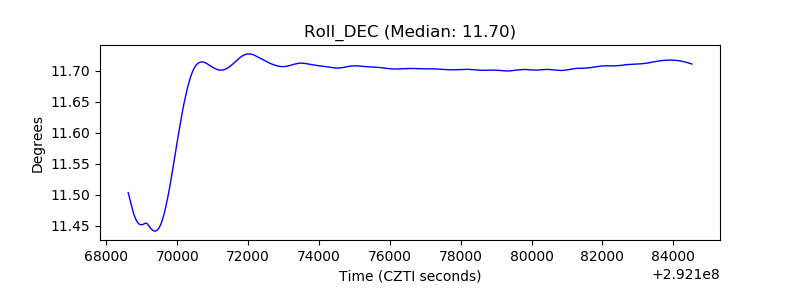 |
| _Roll_RA | 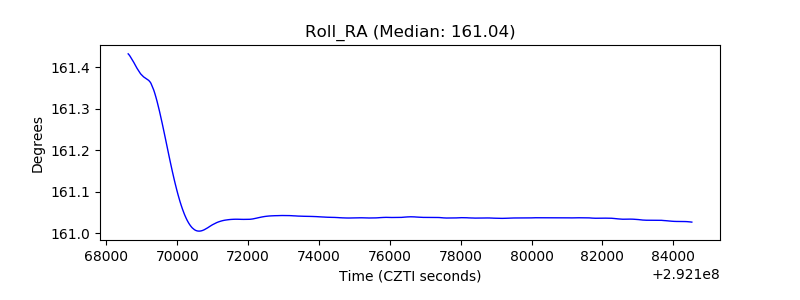 |
| Veto Counter | 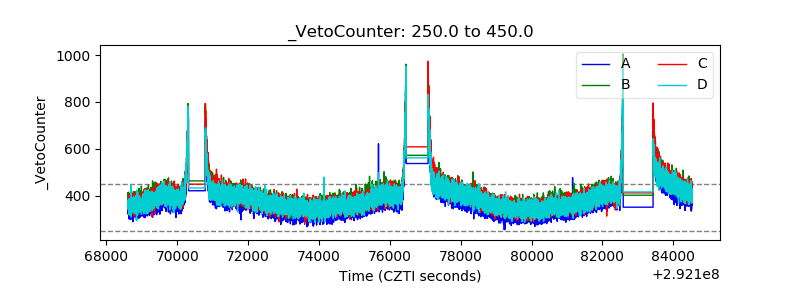 |