| Param | Original file | Final file |
|---|---|---|
| Filename | modeM0/AS1A05_022T03_9000002832_19029cztM0_level2.evt | modeM0/AS1A05_022T03_9000002832_19029cztM0_level2_quad_clean.evt |
| Size (bytes) | 436,132,800 | 86,253,120 |
| Size | 415.9 MB | 82.3 MB |
| Events in quadrant A | 2,999,420 | 551,740 |
| Events in quadrant B | 3,639,923 | 553,877 |
| Events in quadrant C | 3,051,578 | 533,016 |
| Events in quadrant D | 3,081,502 | 526,071 |
| Mode M0 | |||
|---|---|---|---|
| Quadrant | BADHDUFLAG | Total packets | Discarded packets |
| A | 0 | 13113 | 1 |
| B | 0 | 14867 | 1 |
| C | 0 | 13154 | 1 |
| D | 0 | 13511 | 1 |
| Mode M9 | |||
|---|---|---|---|
| Quadrant | BADHDUFLAG | Total packets | Discarded packets |
| A | 0 | 9 | 0 |
| B | 0 | 9 | 0 |
| C | 0 | 9 | 0 |
| D | 0 | 9 | 0 |
| Mode SS | |||
|---|---|---|---|
| Quadrant | BADHDUFLAG | Total packets | Discarded packets |
| A | 0 | 130 | 0 |
| B | 0 | 130 | 0 |
| C | 0 | 130 | 0 |
| D | 0 | 130 | 0 |
| Quadrant | Total seconds | Saturated seconds | Saturation percentage |
|---|---|---|---|
| A | 6411 | 42 | 0.655124% |
| B | 6412 | 151 | 2.354959% |
| C | 6412 | 60 | 0.935745% |
| D | 6412 | 42 | 0.655022% |
Noise dominated data is calculated using 1-second bins in cleaned event files. If a bin has >2000 counts, and if more than 50% of those come from <1% of pixels, then it is considered to be noise-dominated and hence unusable.
| Quadrant | # 1 sec bins | Bins with >0 counts | Bins with >2000 counts | High rate bins dominated by noise | Noise dominated (total time) | Noise dominated (detector-on time) | Marked lightcurve |
|---|---|---|---|---|---|---|---|
| A | 7256 | 6412 | 0 | 0 | 0.00% | 0.00% | 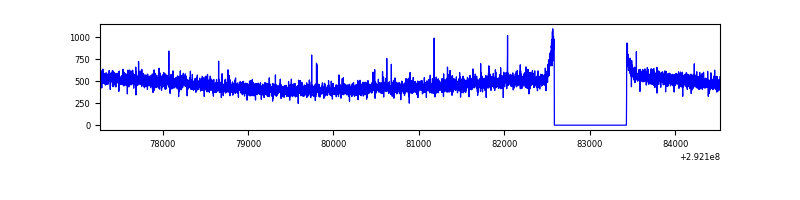 |
| B | 7257 | 6413 | 46 | 46 | 0.63% | 0.72% | 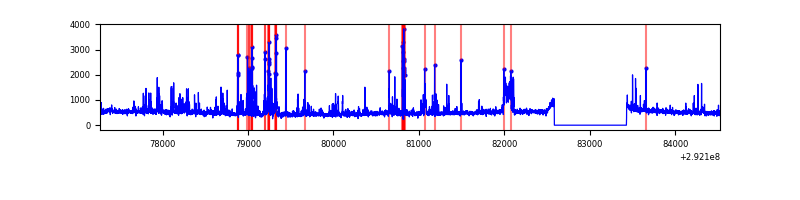 |
| C | 7257 | 6413 | 0 | 0 | 0.00% | 0.00% | 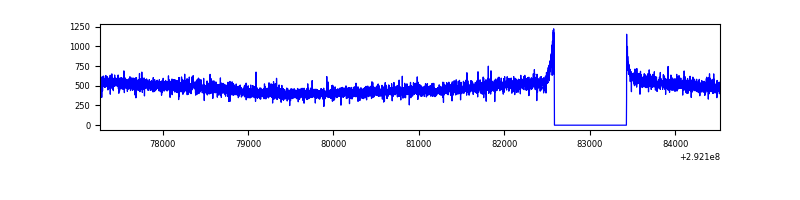 |
| D | 7257 | 6413 | 7 | 7 | 0.10% | 0.11% | 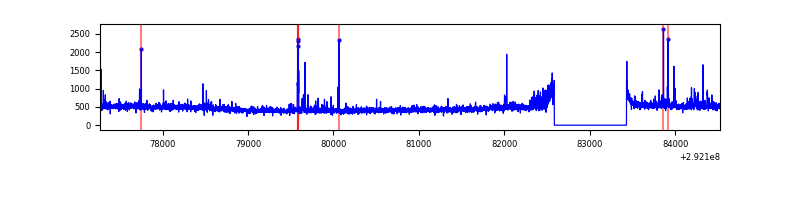 |
Top three noisy pixels from each quadrant. If the there are fewer than three noisy pixels in the level2.evt file, extra rows are filled as -1
| Pixel properties | Quadrant properties | ||||||
|---|---|---|---|---|---|---|---|
| Quadrant | DetID | PixID | Counts | Sigma | Mean | Median | Sigma |
| A | 14 | 235 | 8461 | 48.7 | 777 | 759 | 158.2 |
| A | 0 | 226 | 6818 | 38.31 | 777 | 759 | 158.2 |
| A | 3 | 137 | 6098 | 33.76 | 777 | 759 | 158.2 |
| B | 3 | 112 | 555288 | 3679.18 | 768 | 746 | 150.7 |
| B | 0 | 190 | 27358 | 176.56 | 768 | 746 | 150.7 |
| B | 0 | 229 | 20298 | 129.72 | 768 | 746 | 150.7 |
| C | 14 | 238 | 113699 | 640.78 | 744 | 749 | 176.3 |
| C | 3 | 233 | 38860 | 216.21 | 744 | 749 | 176.3 |
| C | 13 | 61 | 5274 | 25.67 | 744 | 749 | 176.3 |
| D | 1 | 52 | 85707 | 455.24 | 759 | 739 | 186.6 |
| D | 7 | 238 | 75845 | 402.4 | 759 | 739 | 186.6 |
| D | 2 | 234 | 29260 | 152.81 | 759 | 739 | 186.6 |
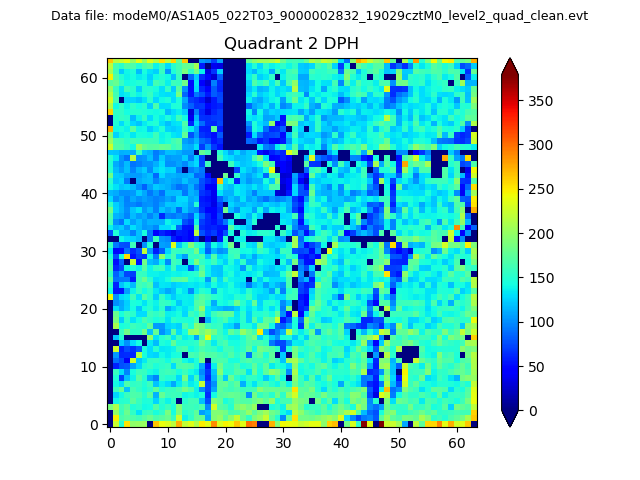
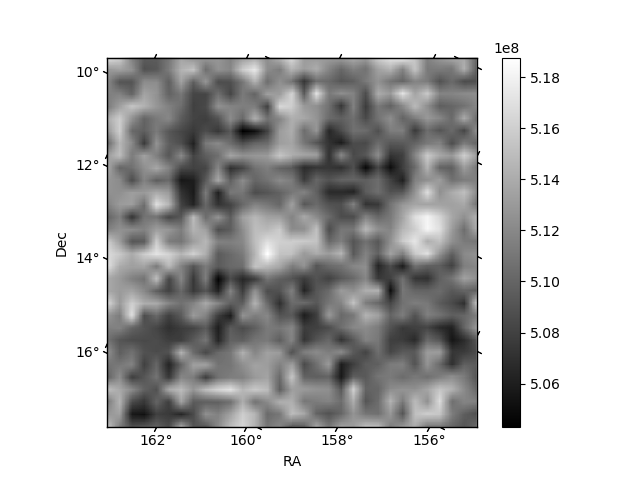
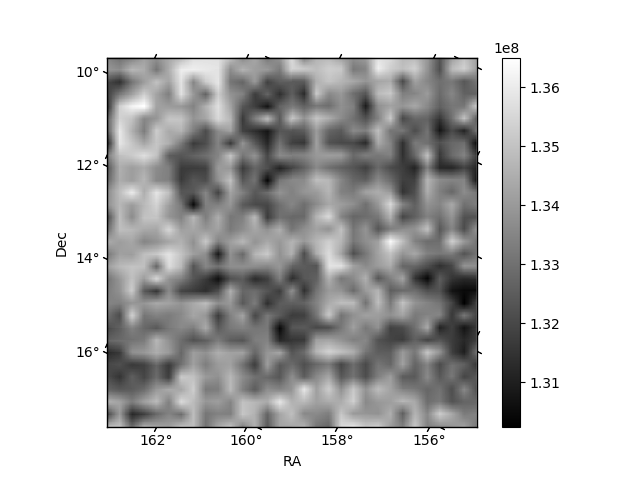
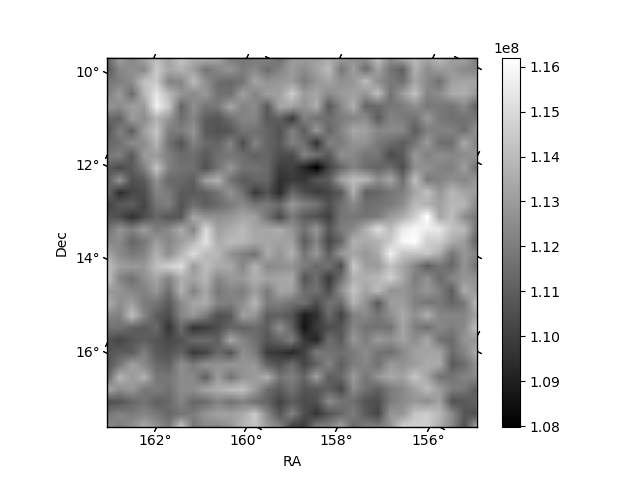
Histogram calculated using DETX and DETY for each event in the final _common_clean file
| Quadrant A | 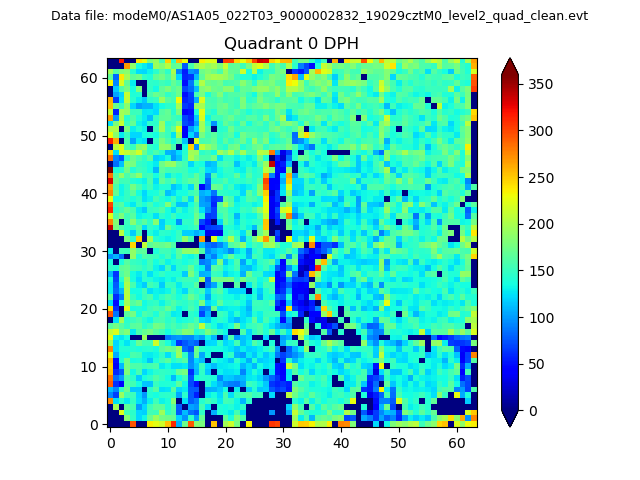 |
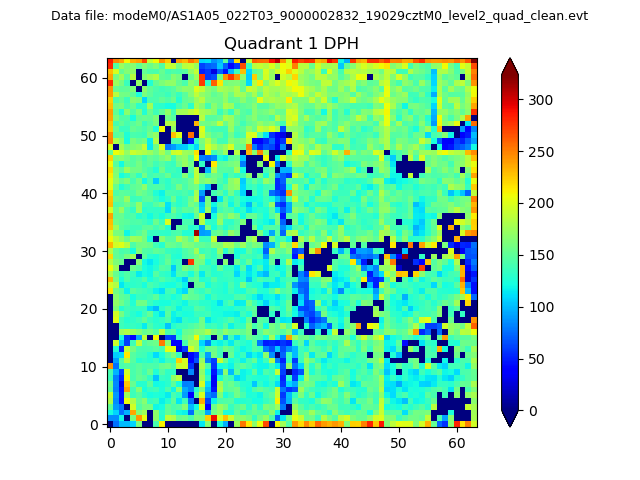 |
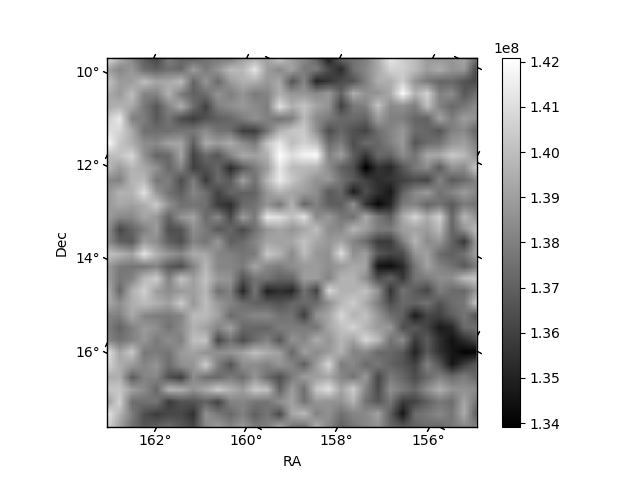
Quadrant B |
|---|---|---|---|
| Quadrant D | 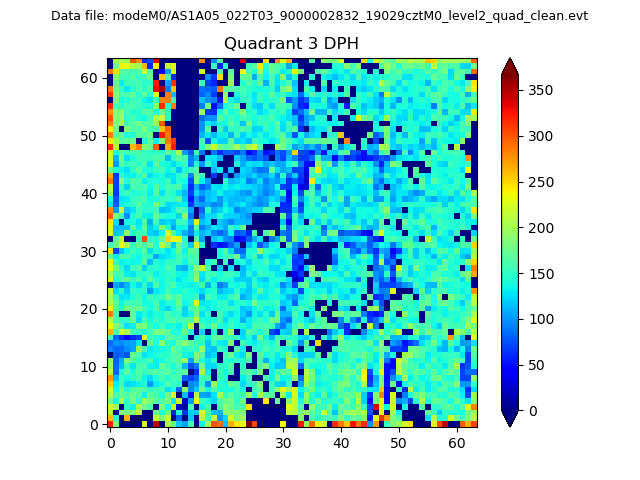 |
 |
Quadrant C |
| Plot type | Count rate plots | Images |
|---|---|---|
| Comparison with Poisson distribution Blue bars denote a histogram of data divided into 1 sec bins. Red curve is a Poisson curve with rate = median count rate of data. |
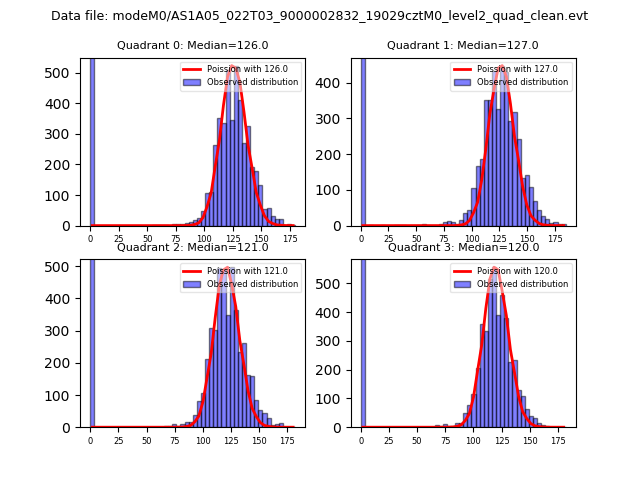 |
 |
| Quadrant-wise count rates Data is divided into 100 sec bins |
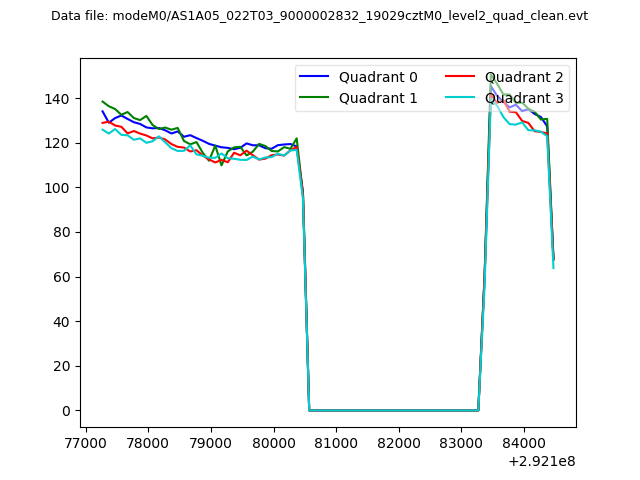 |
|
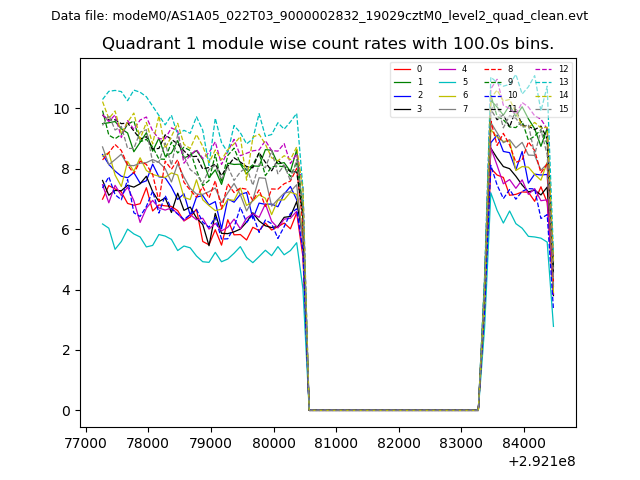
| Module-wise count rates for Quadrant A Data is divided into 100 sec bins |
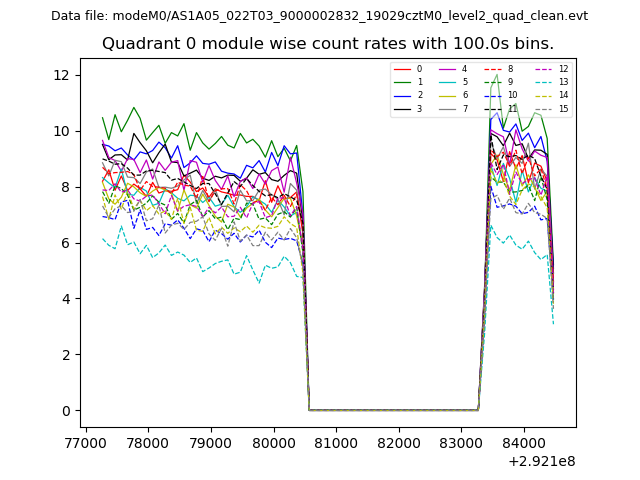 |
 |
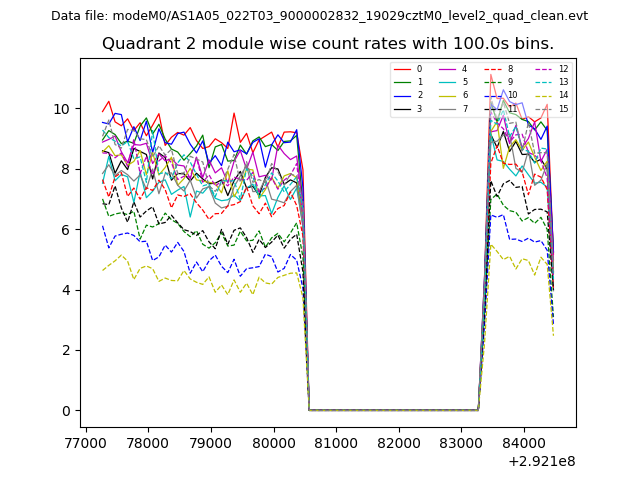
| Module-wise count rates for Quadrant B Data is divided into 100 sec bins |
 |
 |
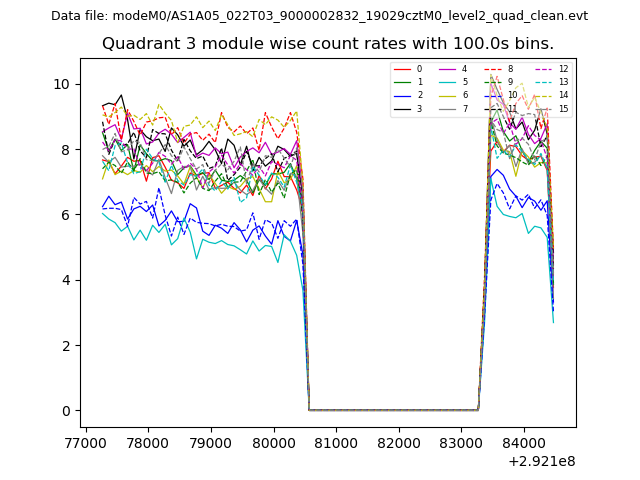
| Module-wise count rates for Quadrant C Data is divided into 100 sec bins |
 |
 |
| Module-wise count rates for Quadrant D Data is divided into 100 sec bins |
 |
 |
| Parameter | Plot |
|---|---|
| CZT HV Monitor | 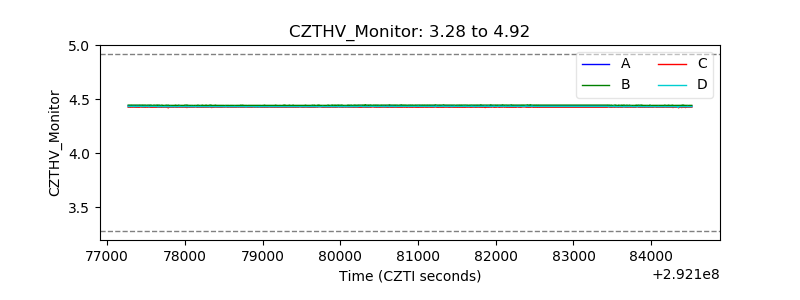 |
| D_VDD | 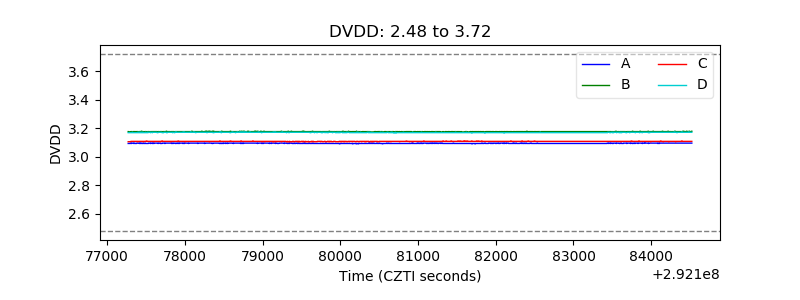 |
| Temperature 1 | 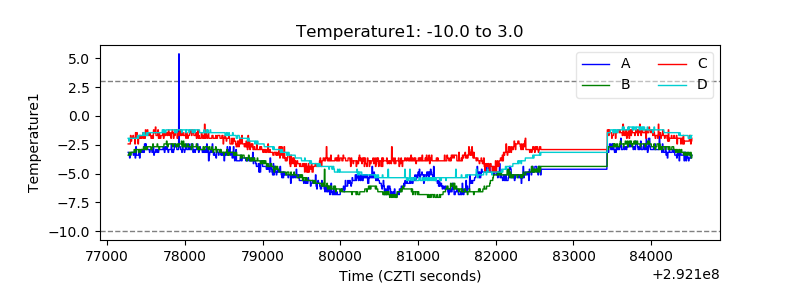 |
| Veto HV Monitor |  |
| Veto LLD | 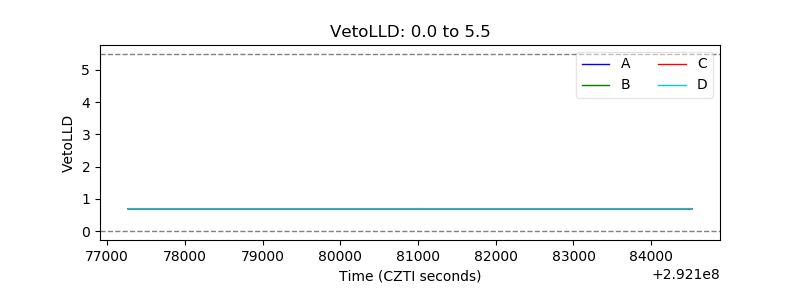 |
| Alpha Counter | 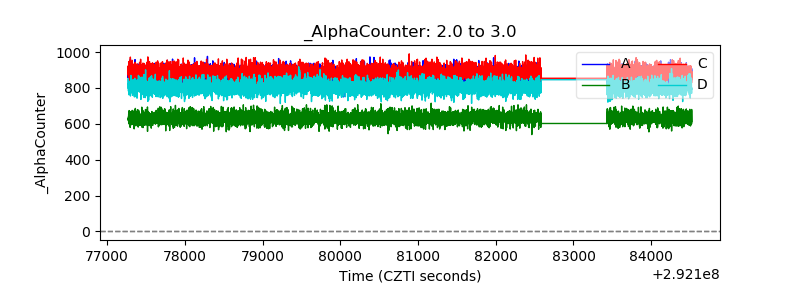 |
| _CPM_Rate | 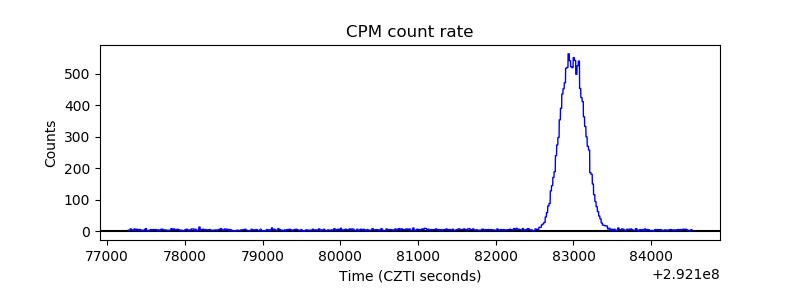 |
| CZT Counter | 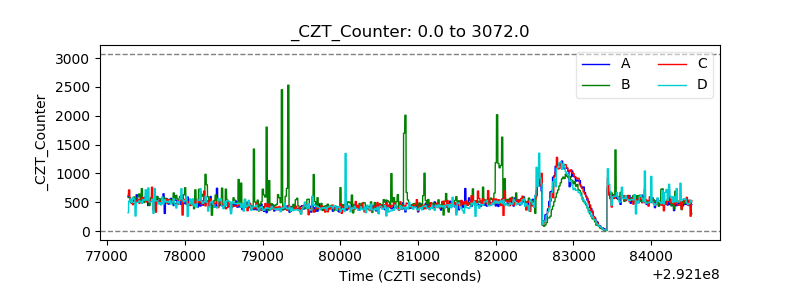 |
| +2.5 Volts monitor |  |
| +5 Volts monitor |  |
| _ROLL_ROT | 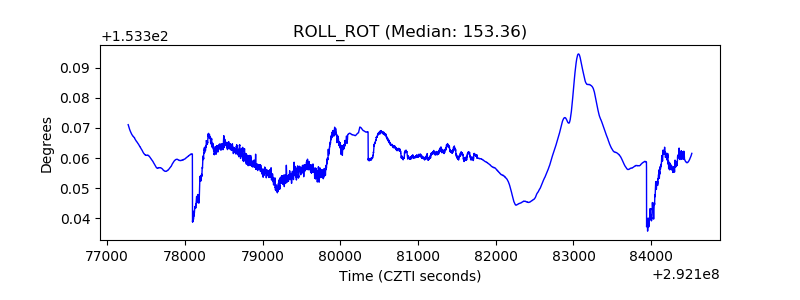 |
| _Roll_DEC | 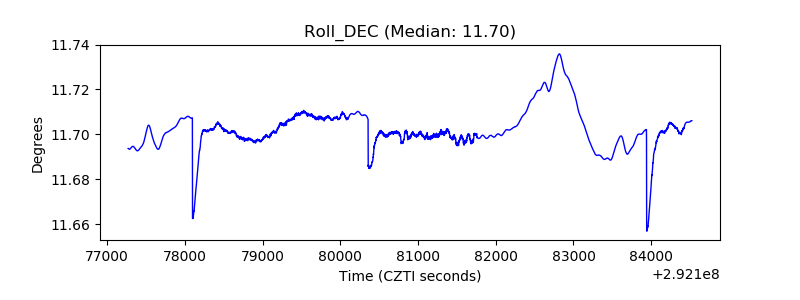 |
| _Roll_RA | 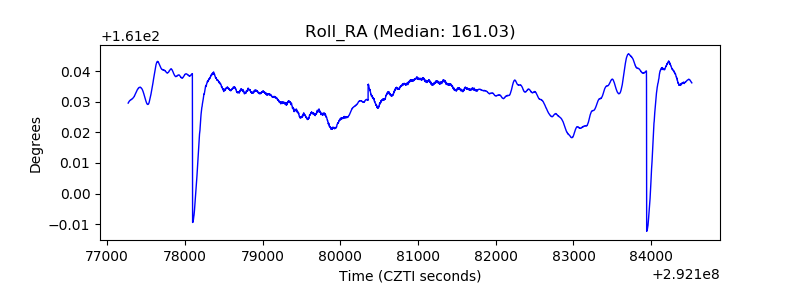 |
| Veto Counter | 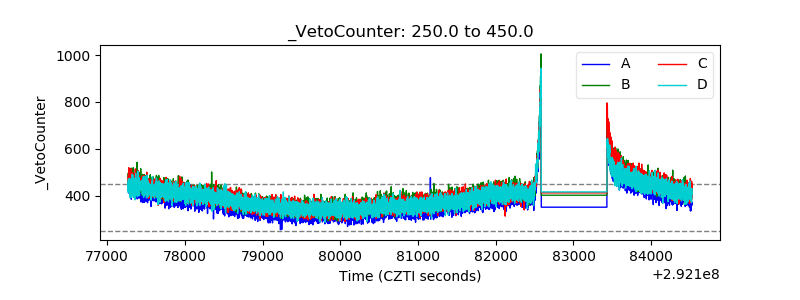 |