| Param | Original file | Final file |
|---|---|---|
| Filename | modeM0/AS1A05_046T01_9000002834cztM0_level2.fits | modeM0/AS1A05_046T01_9000002834cztM0_level2_quad_clean.evt |
| Size (bytes) | 3,028,207,680 | 2,730,772,800 |
| Size | 2.8 GB | 2.5 GB |
| Events in quadrant A | 18,731,124 | 16,218,921 |
| Events in quadrant B | 18,031,270 | 16,321,004 |
| Events in quadrant C | 18,442,192 | 15,651,347 |
| Events in quadrant D | 15,146,618 | 13,169,751 |
| Mode SS | |||
|---|---|---|---|
| Quadrant | BADHDUFLAG | Total packets | Discarded packets |
| A | 0 | 6396 | 0 |
| B | 0 | 6370 | 0 |
| C | 0 | 6378 | 0 |
| D | 0 | 6372 | 0 |
| Mode M0 | |||
|---|---|---|---|
| Quadrant | BADHDUFLAG | Total packets | Discarded packets |
| A | 0 | 647143 | 0 |
| B | 0 | 703235 | 0 |
| C | 0 | 677041 | 0 |
| D | 0 | 979856 | 0 |
| Mode M9 | |||
|---|---|---|---|
| Quadrant | BADHDUFLAG | Total packets | Discarded packets |
| A | 0 | 512 | 0 |
| B | 0 | 512 | 0 |
| C | 0 | 512 | 0 |
| D | 0 | 511 | 0 |
| Quadrant | Total seconds | Saturated seconds | Saturation percentage |
|---|---|---|---|
| A | 311740 | 3815 | 1.223776% |
| B | 311536 | 7455 | 2.392982% |
| C | 311700 | 6901 | 2.213988% |
| D | 311111 | 35318 | 11.352218% |
Noise dominated data is calculated using 1-second bins in cleaned event files. If a bin has >2000 counts, and if more than 50% of those come from <1% of pixels, then it is considered to be noise-dominated and hence unusable.
| Quadrant | # 1 sec bins | Bins with >0 counts | Bins with >2000 counts | High rate bins dominated by noise | Noise dominated (total time) | Noise dominated (detector-on time) | Marked lightcurve |
|---|---|---|---|---|---|---|---|
| A | 371256 | 312728 | 0 | 0 | 0.00% | 0.00% |  |
| B | 371256 | 312458 | 0 | 0 | 0.00% | 0.00% |  |
| C | 371256 | 312663 | 0 | 0 | 0.00% | 0.00% |  |
| D | 371256 | 311814 | 0 | 0 | 0.00% | 0.00% |  |
Top three noisy pixels from each quadrant. If the there are fewer than three noisy pixels in the level2.evt file, extra rows are filled as -1
| Pixel properties | Quadrant properties | ||||||
|---|---|---|---|---|---|---|---|
| Quadrant | DetID | PixID | Counts | Sigma | Mean | Median | Sigma |
| A | 0 | 29 | 18116 | 11.4 | 4875 | 4567 | 1188.9 |
| A | 7 | 110 | 15155 | 8.91 | 4875 | 4567 | 1188.9 |
| A | 9 | 19 | 13888 | 7.84 | 4875 | 4567 | 1188.9 |
| B | 2 | 9 | 14740 | 11.11 | 4756 | 4525 | 919.1 |
| B | 2 | 8 | 12337 | 8.5 | 4756 | 4525 | 919.1 |
| B | 3 | 17 | 11913 | 8.04 | 4756 | 4525 | 919.1 |
| C | 12 | 241 | 12916 | 6.69 | 4872 | 4542 | 1250.9 |
| C | 12 | 250 | 12507 | 6.37 | 4872 | 4542 | 1250.9 |
| C | 3 | 126 | 12456 | 6.33 | 4872 | 4542 | 1250.9 |
| D | 10 | 190 | 11400 | 6.56 | 4332 | 3955 | 1134.8 |
| D | 3 | 14 | 10772 | 6.01 | 4332 | 3955 | 1134.8 |
| D | 7 | 3 | 10734 | 5.97 | 4332 | 3955 | 1134.8 |
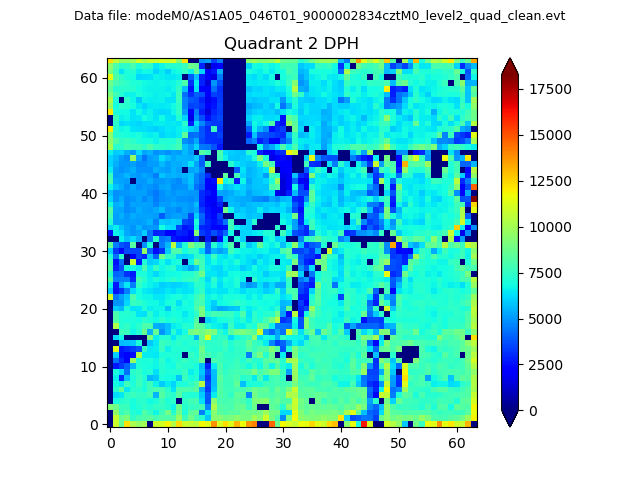
Histogram calculated using DETX and DETY for each event in the final _common_clean file
| Quadrant A |  |
 |
Quadrant B |
|---|---|---|---|
| Quadrant D | 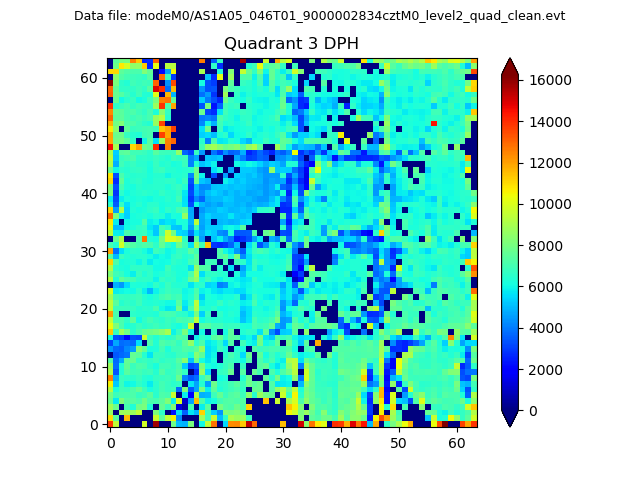 |
 |
Quadrant C |
| Plot type | Count rate plots | Images |
|---|---|---|
| Comparison with Poisson distribution Blue bars denote a histogram of data divided into 1 sec bins. Red curve is a Poisson curve with rate = median count rate of data. |
 |
 |
| Quadrant-wise count rates Data is divided into 100 sec bins |
 |
|
| Module-wise count rates for Quadrant A Data is divided into 100 sec bins |
 |
 |
| Module-wise count rates for Quadrant B Data is divided into 100 sec bins |
 |
 |
| Module-wise count rates for Quadrant C Data is divided into 100 sec bins |
 |
 |
| Module-wise count rates for Quadrant D Data is divided into 100 sec bins |
 |
 |
| Parameter | Plot |
|---|---|
| CZT HV Monitor |  |
| D_VDD |  |
| Temperature 1 |  |
| Veto HV Monitor |  |
| Veto LLD |  |
| Alpha Counter |  |
| _CPM_Rate |  |
| CZT Counter |  |
| +2.5 Volts monitor |  |
| +5 Volts monitor |  |
| _ROLL_ROT |  |
| _Roll_DEC |  |
| _Roll_RA |  |
| Veto Counter |  |