| Param | Original file | Final file |
|---|---|---|
| Filename | modeM0/AS1A05_046T01_9000002834_19029cztM0_level2.evt | modeM0/AS1A05_046T01_9000002834_19029cztM0_level2_quad_clean.evt |
| Size (bytes) | 298,054,080 | 57,320,640 |
| Size | 284.2 MB | 54.7 MB |
| Events in quadrant A | 1,981,345 | 366,464 |
| Events in quadrant B | 2,265,921 | 373,581 |
| Events in quadrant C | 2,014,269 | 360,902 |
| Events in quadrant D | 2,486,840 | 347,141 |
| Mode SS | |||
|---|---|---|---|
| Quadrant | BADHDUFLAG | Total packets | Discarded packets |
| A | 0 | 84 | 0 |
| B | 0 | 84 | 0 |
| C | 0 | 84 | 0 |
| D | 0 | 84 | 0 |
| Mode M0 | |||
|---|---|---|---|
| Quadrant | BADHDUFLAG | Total packets | Discarded packets |
| A | 0 | 8484 | 1 |
| B | 0 | 9414 | 2 |
| C | 0 | 8506 | 1 |
| D | 0 | 10211 | 1 |
| Mode M9 | |||
|---|---|---|---|
| Quadrant | BADHDUFLAG | Total packets | Discarded packets |
| A | 0 | 10 | 0 |
| B | 0 | 10 | 0 |
| C | 0 | 10 | 0 |
| D | 0 | 10 | 0 |
| Quadrant | Total seconds | Saturated seconds | Saturation percentage |
|---|---|---|---|
| A | 4075 | 24 | 0.588957% |
| B | 4074 | 104 | 2.552774% |
| C | 4074 | 40 | 0.981836% |
| D | 4074 | 125 | 3.068238% |
Noise dominated data is calculated using 1-second bins in cleaned event files. If a bin has >2000 counts, and if more than 50% of those come from <1% of pixels, then it is considered to be noise-dominated and hence unusable.
| Quadrant | # 1 sec bins | Bins with >0 counts | Bins with >2000 counts | High rate bins dominated by noise | Noise dominated (total time) | Noise dominated (detector-on time) | Marked lightcurve |
|---|---|---|---|---|---|---|---|
| A | 5100 | 4076 | 0 | 0 | 0.00% | 0.00% |  |
| B | 5099 | 4075 | 26 | 26 | 0.51% | 0.64% |  |
| C | 5099 | 4075 | 0 | 0 | 0.00% | 0.00% |  |
| D | 5099 | 4075 | 82 | 82 | 1.61% | 2.01% |  |
Top three noisy pixels from each quadrant. If the there are fewer than three noisy pixels in the level2.evt file, extra rows are filled as -1
| Pixel properties | Quadrant properties | ||||||
|---|---|---|---|---|---|---|---|
| Quadrant | DetID | PixID | Counts | Sigma | Mean | Median | Sigma |
| A | 14 | 235 | 17179 | 159.5 | 509 | 497 | 104.6 |
| A | 0 | 226 | 4397 | 37.29 | 509 | 497 | 104.6 |
| A | 3 | 137 | 3929 | 32.81 | 509 | 497 | 104.6 |
| B | 3 | 112 | 208067 | 2090.24 | 507 | 494 | 99.3 |
| B | 7 | 220 | 37132 | 368.94 | 507 | 494 | 99.3 |
| B | 0 | 198 | 13561 | 131.58 | 507 | 494 | 99.3 |
| C | 14 | 238 | 77329 | 658.0 | 492 | 496 | 116.8 |
| C | 3 | 233 | 15869 | 131.66 | 492 | 496 | 116.8 |
| C | 13 | 61 | 3424 | 25.08 | 492 | 496 | 116.8 |
| D | 7 | 238 | 423000 | 3525.8 | 491 | 476 | 119.8 |
| D | 1 | 52 | 193730 | 1612.63 | 491 | 476 | 119.8 |
| D | 2 | 234 | 17678 | 143.54 | 491 | 476 | 119.8 |
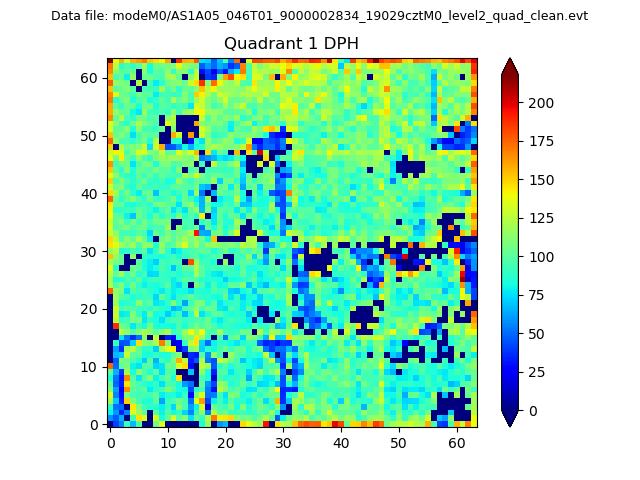
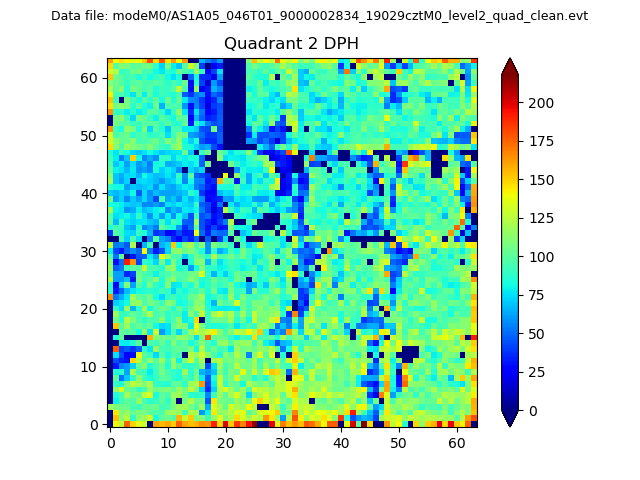
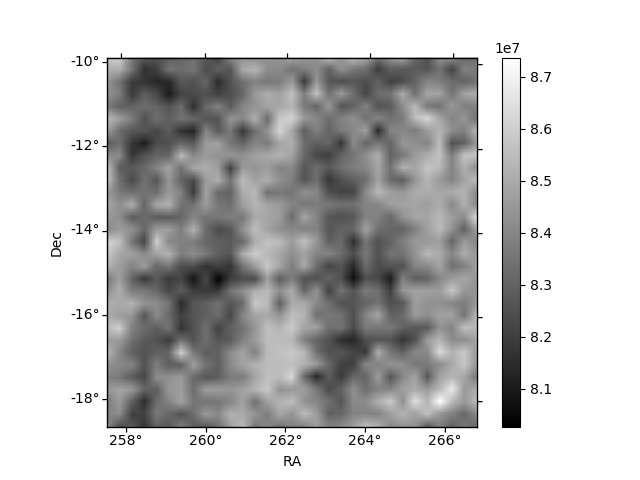
Histogram calculated using DETX and DETY for each event in the final _common_clean file
| Quadrant A |  |
 |
Quadrant B |
|---|---|---|---|
| Quadrant D | 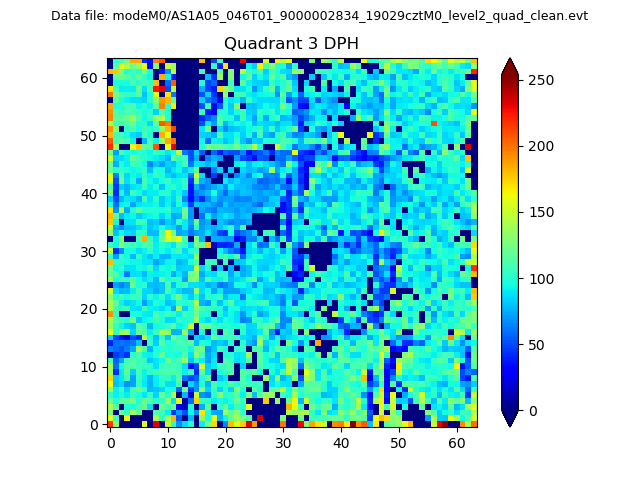 |
 |
Quadrant C |
| Plot type | Count rate plots | Images |
|---|---|---|
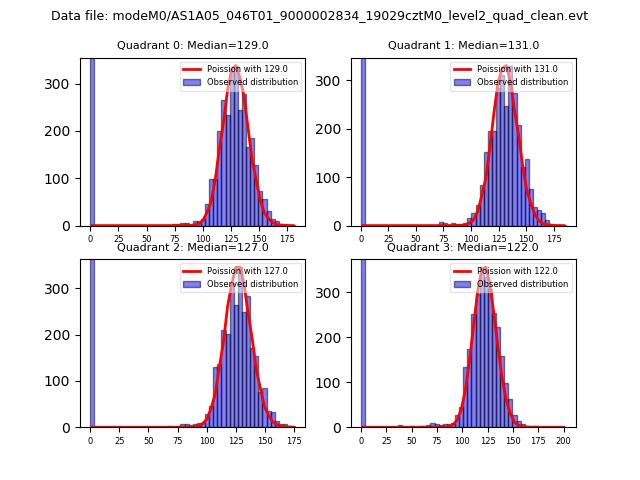
| Comparison with Poisson distribution Blue bars denote a histogram of data divided into 1 sec bins. Red curve is a Poisson curve with rate = median count rate of data. |
 |
 |
| Quadrant-wise count rates Data is divided into 100 sec bins |
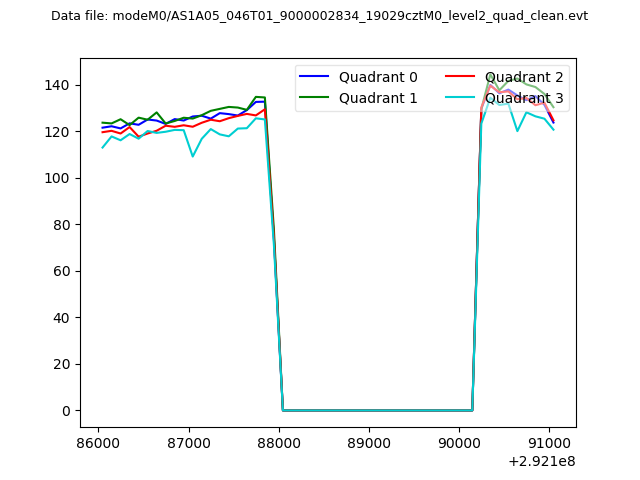 |
|
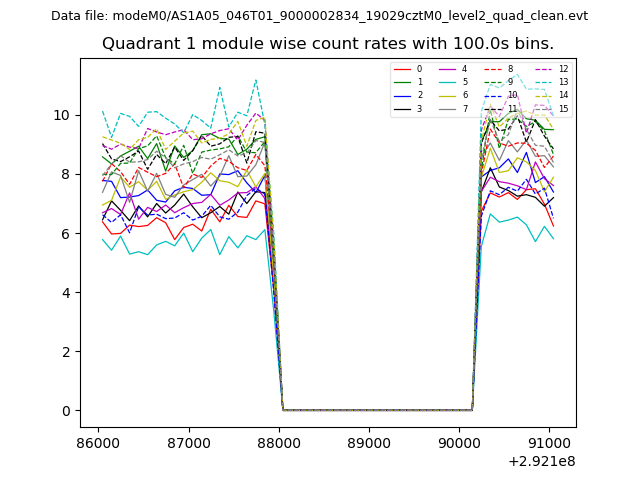
| Module-wise count rates for Quadrant A Data is divided into 100 sec bins |
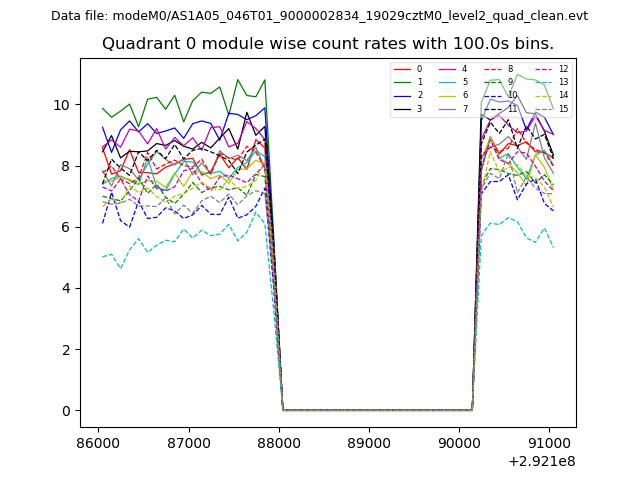 |
 |
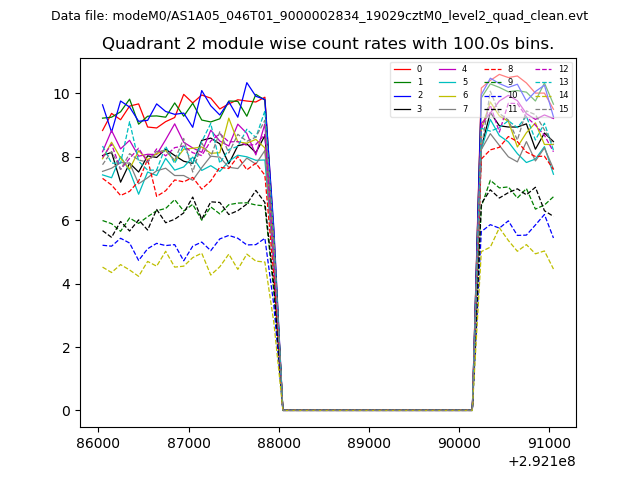
| Module-wise count rates for Quadrant B Data is divided into 100 sec bins |
 |
 |
| Module-wise count rates for Quadrant C Data is divided into 100 sec bins |
 |
 |
| Module-wise count rates for Quadrant D Data is divided into 100 sec bins |
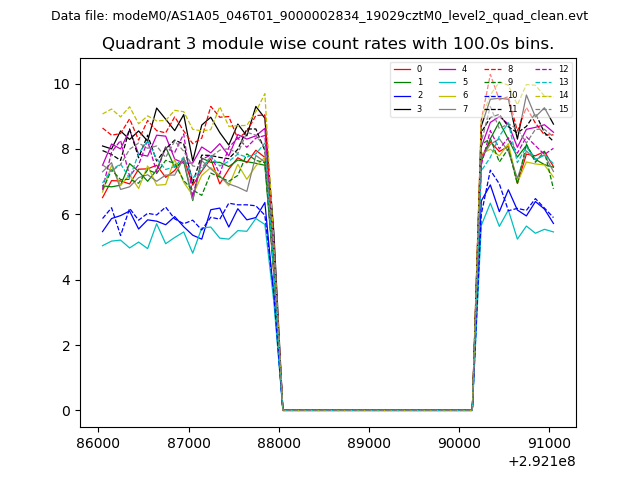 |
 |
| Parameter | Plot |
|---|---|
| CZT HV Monitor | 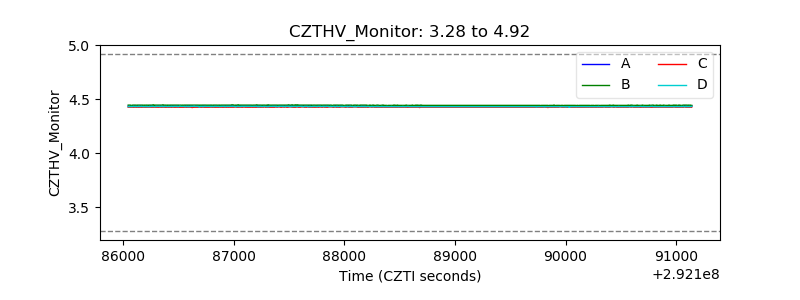 |
| D_VDD | 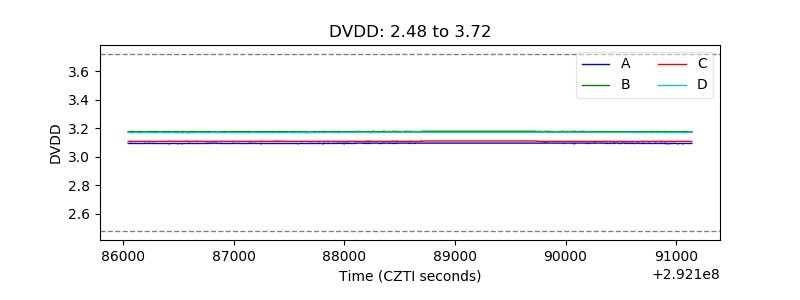 |
| Temperature 1 | 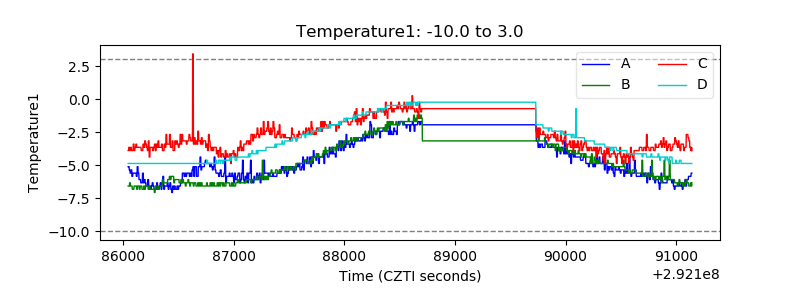 |
| Veto HV Monitor |  |
| Veto LLD | 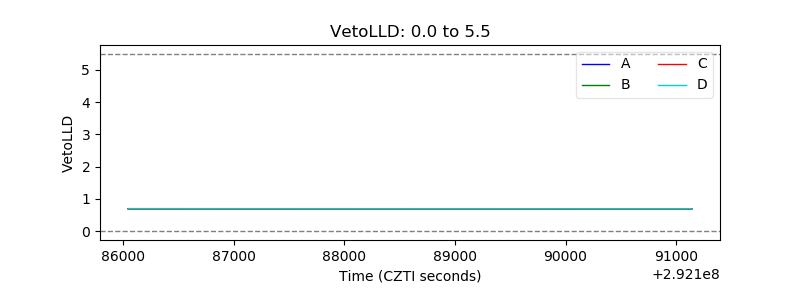 |
| Alpha Counter | 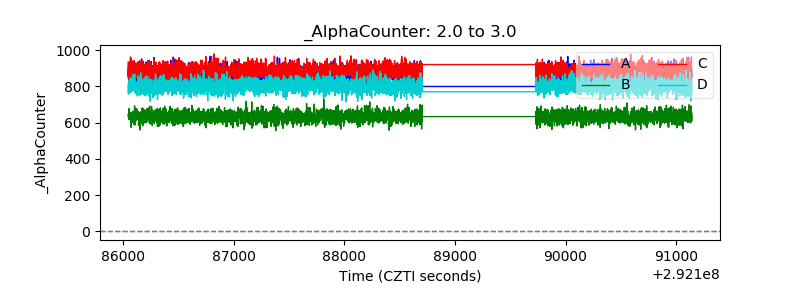 |
| _CPM_Rate |  |
| CZT Counter | 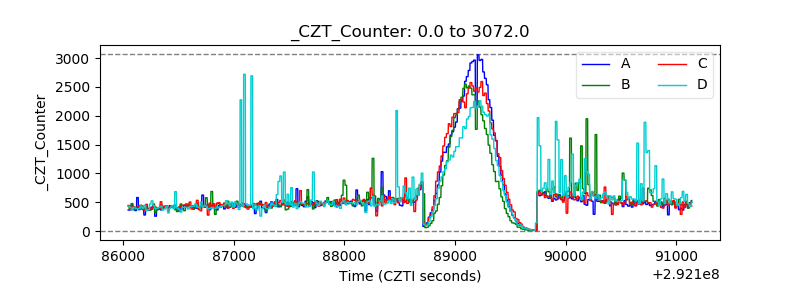 |
| +2.5 Volts monitor | 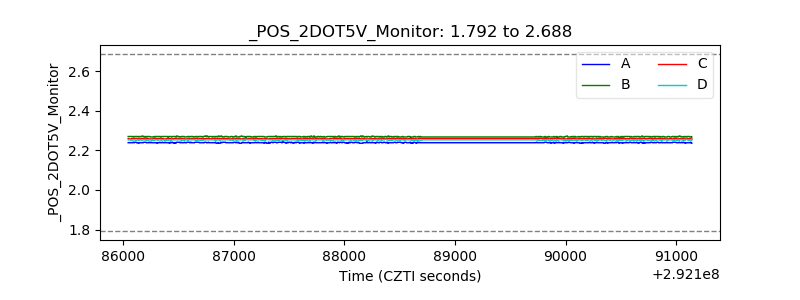 |
| +5 Volts monitor |  |
| _ROLL_ROT | 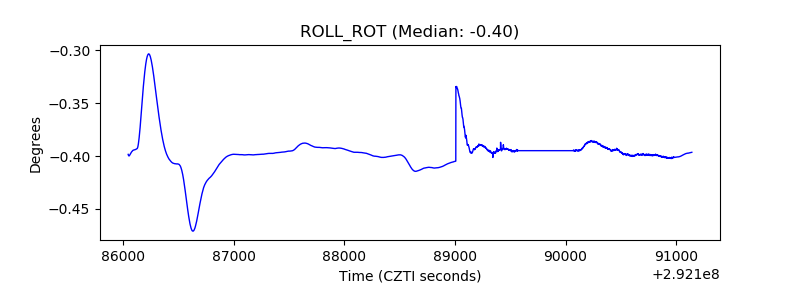 |
| _Roll_DEC | 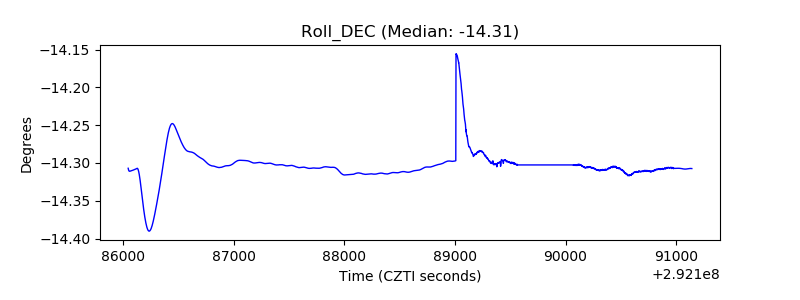 |
| _Roll_RA | 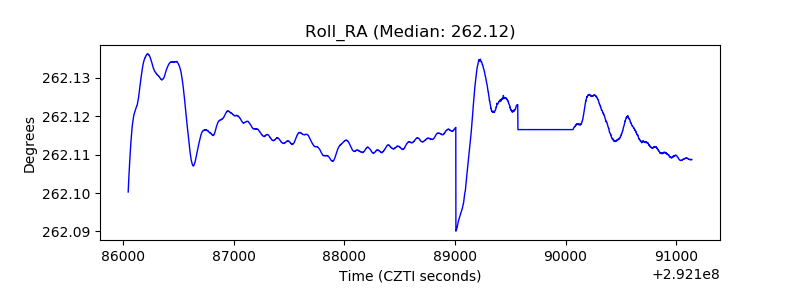 |
| Veto Counter | 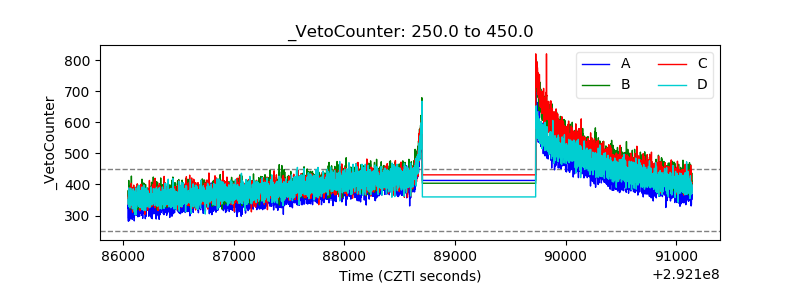 |