| Param | Original file | Final file |
|---|---|---|
| Filename | modeM0/AS1A05_046T01_9000002834_19031cztM0_level2.evt | modeM0/AS1A05_046T01_9000002834_19031cztM0_level2_quad_clean.evt |
| Size (bytes) | 524,018,880 | 96,353,280 |
| Size | 499.7 MB | 91.9 MB |
| Events in quadrant A | 3,122,797 | 630,202 |
| Events in quadrant B | 3,460,518 | 648,335 |
| Events in quadrant C | 3,206,130 | 624,995 |
| Events in quadrant D | 5,651,090 | 572,703 |
| Mode SS | |||
|---|---|---|---|
| Quadrant | BADHDUFLAG | Total packets | Discarded packets |
| A | 0 | 128 | 0 |
| B | 0 | 128 | 0 |
| C | 0 | 128 | 0 |
| D | 0 | 128 | 0 |
| Mode M0 | |||
|---|---|---|---|
| Quadrant | BADHDUFLAG | Total packets | Discarded packets |
| A | 0 | 13340 | 3 |
| B | 0 | 14415 | 2 |
| C | 0 | 13438 | 2 |
| D | 0 | 21124 | 2 |
| Mode M9 | |||
|---|---|---|---|
| Quadrant | BADHDUFLAG | Total packets | Discarded packets |
| A | 0 | 14 | 0 |
| B | 0 | 14 | 0 |
| C | 0 | 14 | 0 |
| D | 0 | 15 | 0 |
| Quadrant | Total seconds | Saturated seconds | Saturation percentage |
|---|---|---|---|
| A | 6330 | 31 | 0.489731% |
| B | 6330 | 125 | 1.974724% |
| C | 6330 | 65 | 1.026856% |
| D | 6330 | 753 | 11.895735% |
Noise dominated data is calculated using 1-second bins in cleaned event files. If a bin has >2000 counts, and if more than 50% of those come from <1% of pixels, then it is considered to be noise-dominated and hence unusable.
| Quadrant | # 1 sec bins | Bins with >0 counts | Bins with >2000 counts | High rate bins dominated by noise | Noise dominated (total time) | Noise dominated (detector-on time) | Marked lightcurve |
|---|---|---|---|---|---|---|---|
| A | 7475 | 6331 | 3 | 3 | 0.04% | 0.05% | 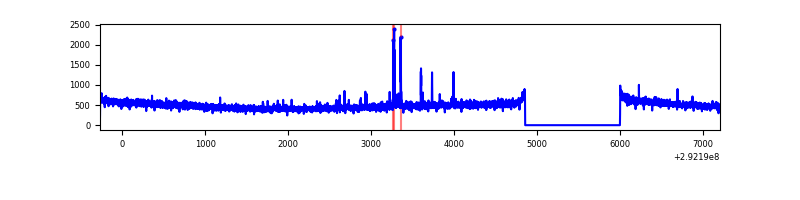 |
| B | 7475 | 6331 | 32 | 32 | 0.43% | 0.51% | 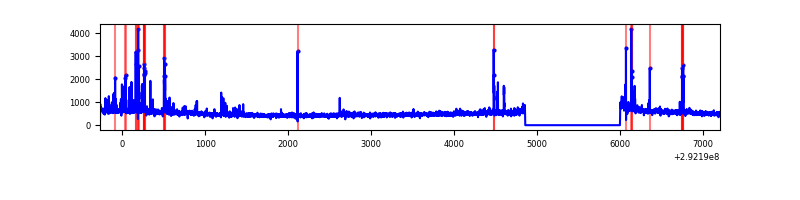 |
| C | 7475 | 6331 | 0 | 0 | 0.00% | 0.00% | 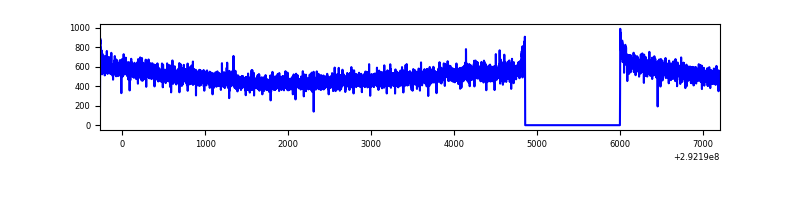 |
| D | 7475 | 6331 | 473 | 473 | 6.33% | 7.47% | 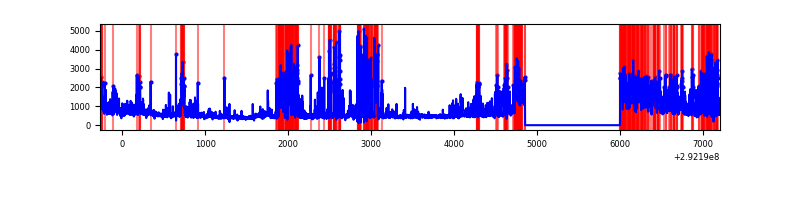 |
Top three noisy pixels from each quadrant. If the there are fewer than three noisy pixels in the level2.evt file, extra rows are filled as -1
| Pixel properties | Quadrant properties | ||||||
|---|---|---|---|---|---|---|---|
| Quadrant | DetID | PixID | Counts | Sigma | Mean | Median | Sigma |
| A | 14 | 235 | 56899 | 348.61 | 796 | 780 | 161.0 |
| A | 0 | 226 | 6944 | 38.29 | 796 | 780 | 161.0 |
| A | 13 | 254 | 6688 | 36.7 | 796 | 780 | 161.0 |
| B | 3 | 112 | 157078 | 1014.08 | 801 | 780 | 154.1 |
| B | 7 | 220 | 82751 | 531.84 | 801 | 780 | 154.1 |
| B | 4 | 171 | 31772 | 201.08 | 801 | 780 | 154.1 |
| C | 14 | 238 | 121374 | 666.14 | 773 | 778 | 181.0 |
| C | 3 | 233 | 69197 | 377.93 | 773 | 778 | 181.0 |
| C | 13 | 61 | 5429 | 25.69 | 773 | 778 | 181.0 |
| D | 7 | 238 | 1581806 | 8766.54 | 742 | 721 | 180.4 |
| D | 1 | 52 | 861979 | 4775.36 | 742 | 721 | 180.4 |
| D | 9 | 68 | 323707 | 1790.84 | 742 | 721 | 180.4 |
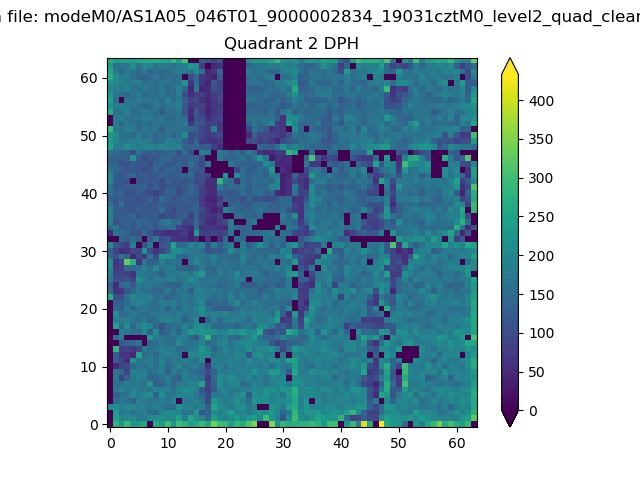
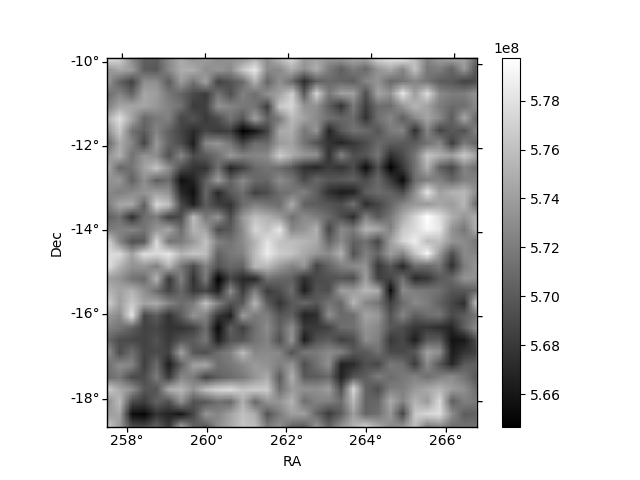
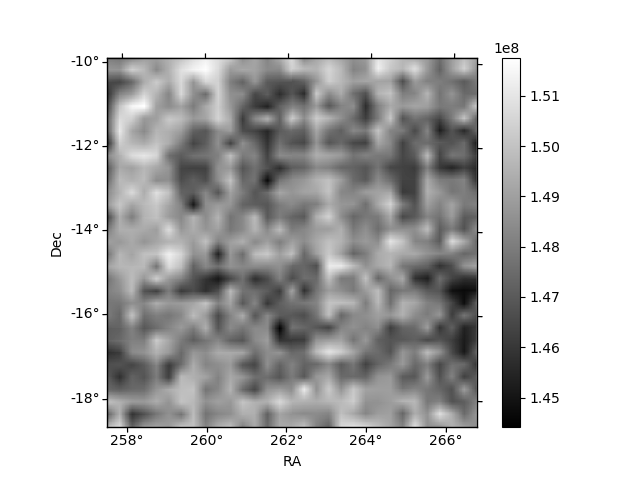
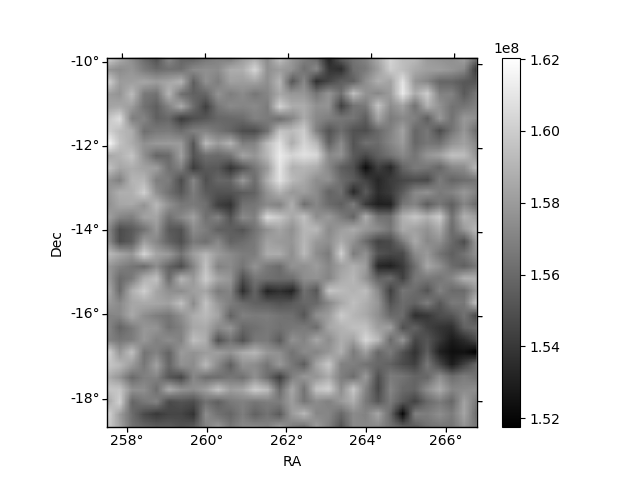
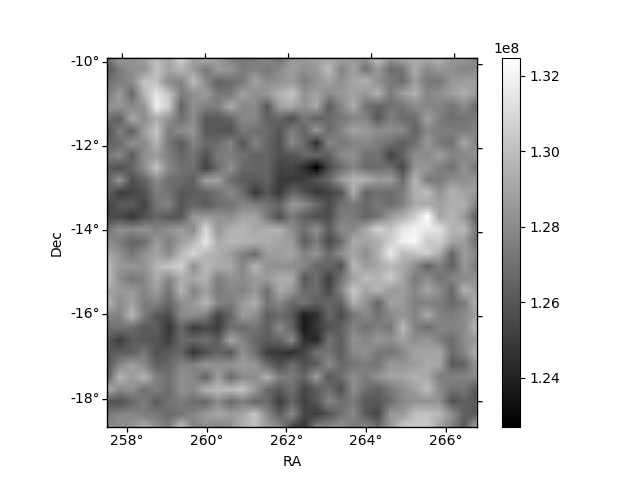
Histogram calculated using DETX and DETY for each event in the final _common_clean file
| Quadrant A | 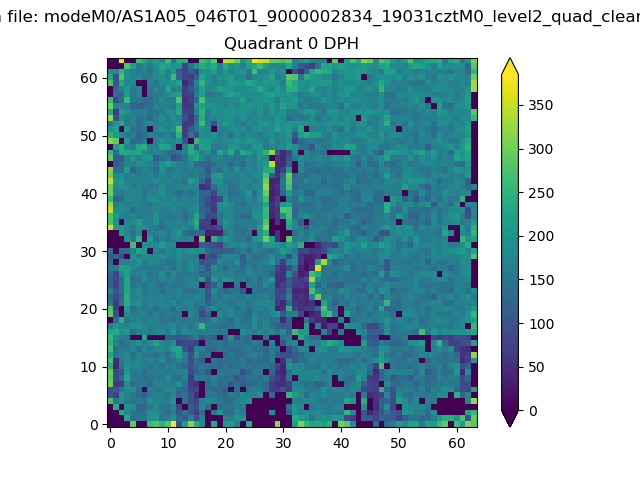 |
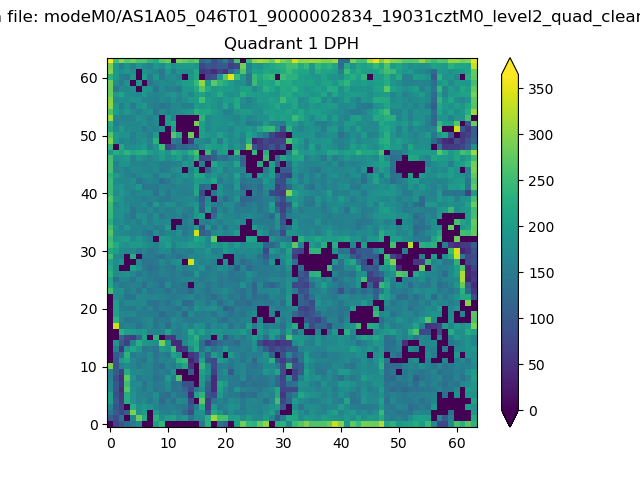 |
Quadrant B |
|---|---|---|---|
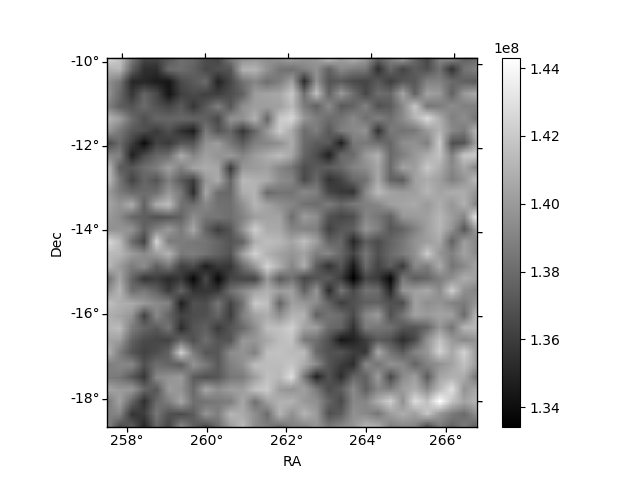
| Quadrant D | 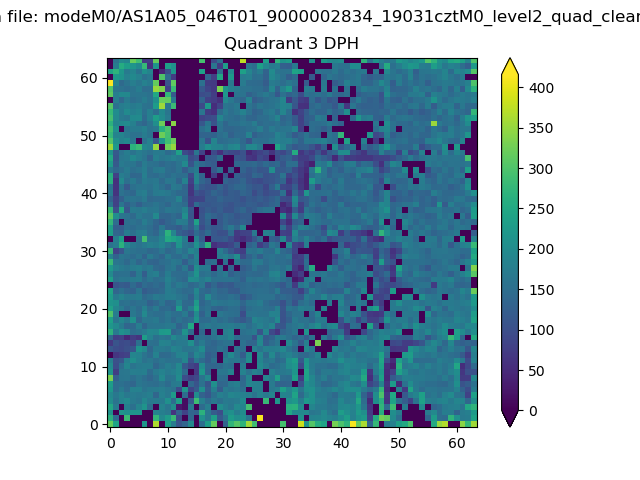 |
 |
Quadrant C |
| Plot type | Count rate plots | Images |
|---|---|---|
| Comparison with Poisson distribution Blue bars denote a histogram of data divided into 1 sec bins. Red curve is a Poisson curve with rate = median count rate of data. |
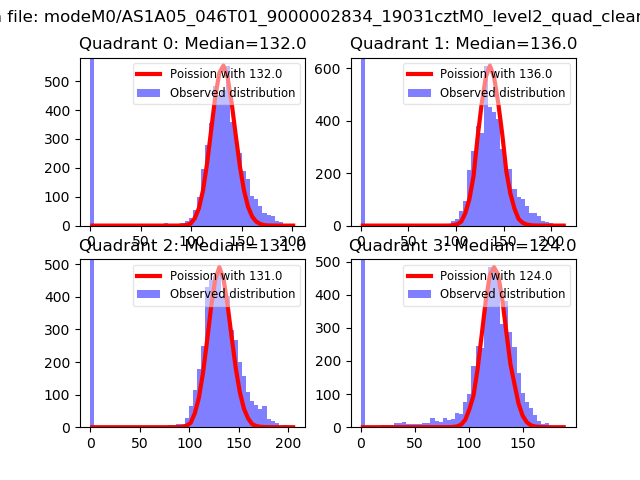 |
 |
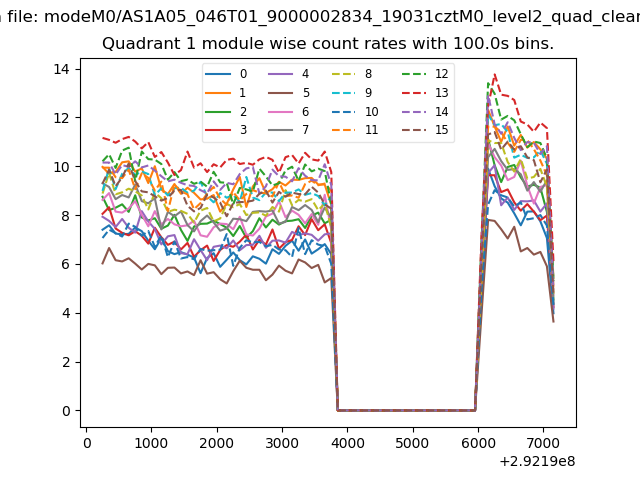
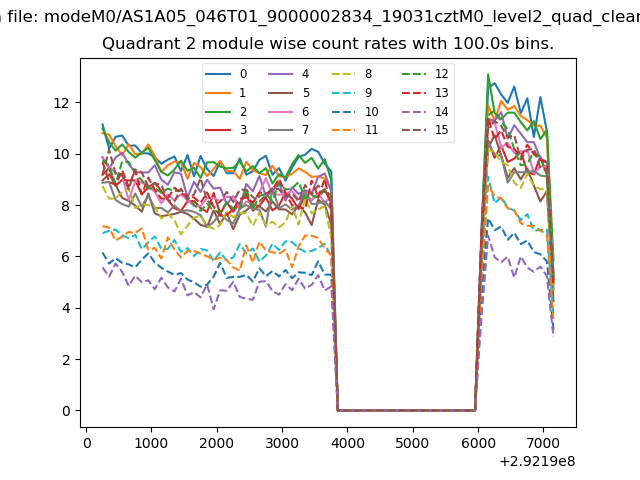
| Quadrant-wise count rates Data is divided into 100 sec bins |
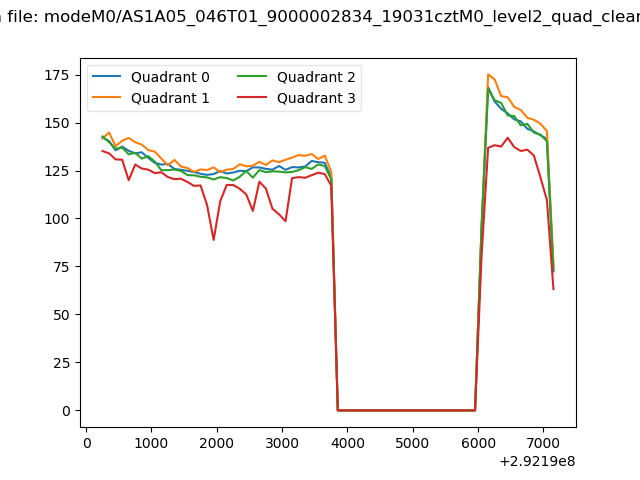 |
|
| Module-wise count rates for Quadrant A Data is divided into 100 sec bins |
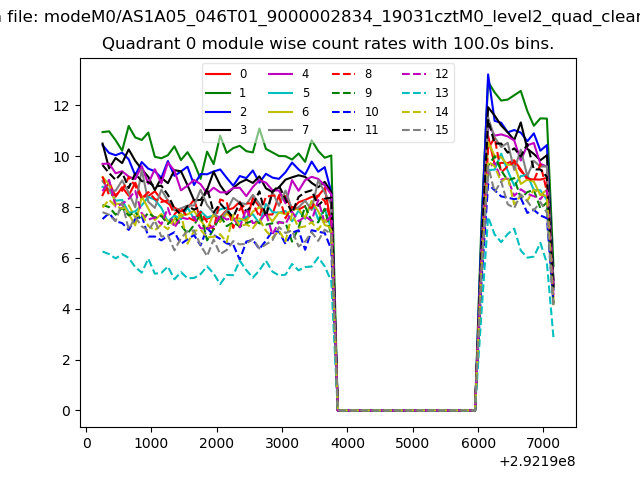 |
 |
| Module-wise count rates for Quadrant B Data is divided into 100 sec bins |
 |
 |
| Module-wise count rates for Quadrant C Data is divided into 100 sec bins |
 |
 |
| Module-wise count rates for Quadrant D Data is divided into 100 sec bins |
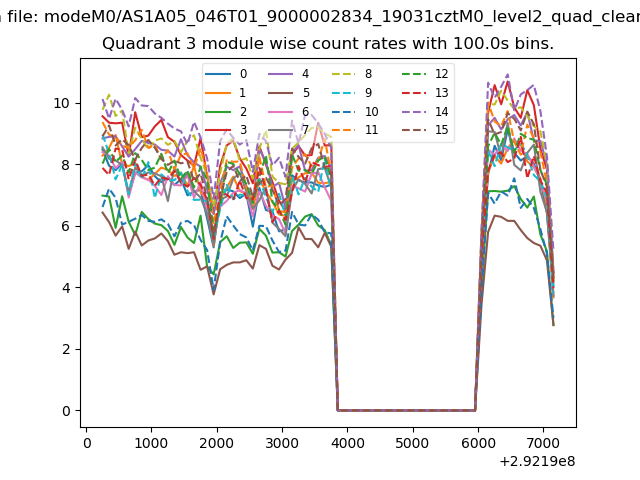 |
 |
| Parameter | Plot |
|---|---|
| CZT HV Monitor | 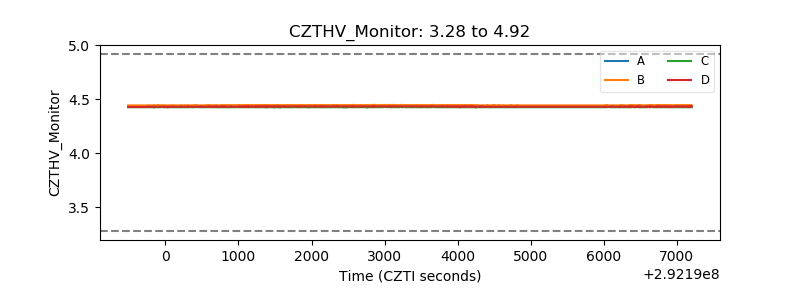 |
| D_VDD | 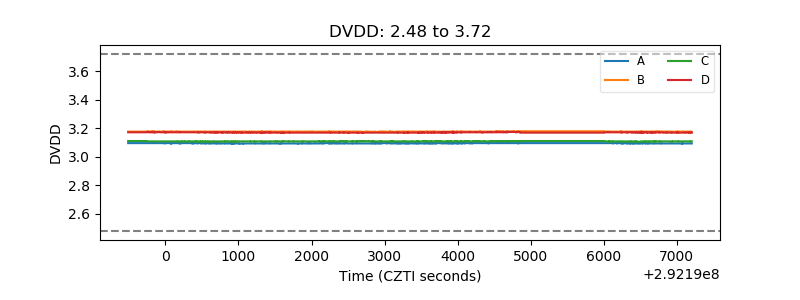 |
| Temperature 1 | 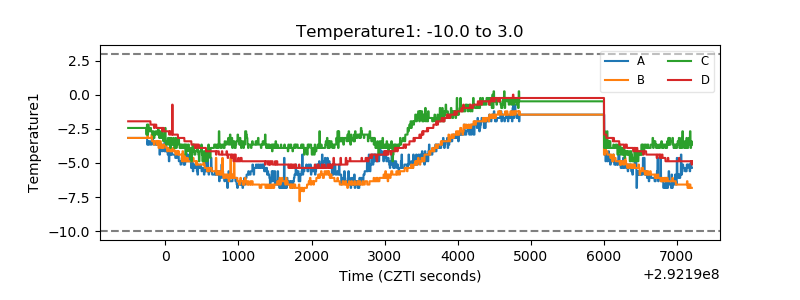 |
| Veto HV Monitor | 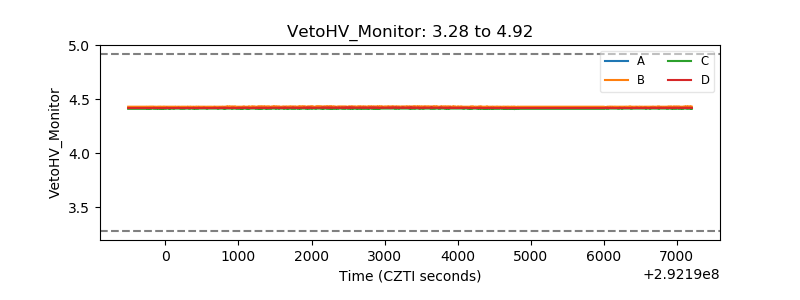 |
| Veto LLD | 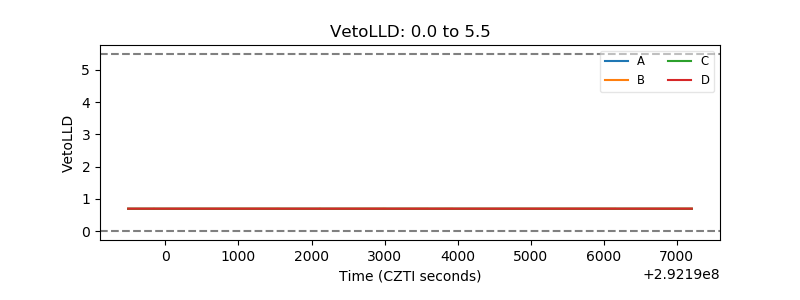 |
| Alpha Counter | 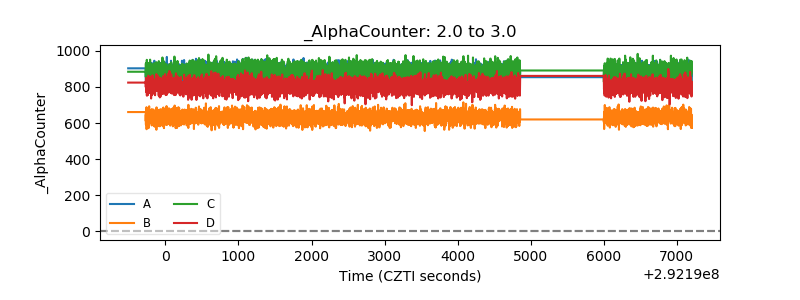 |
| _CPM_Rate | 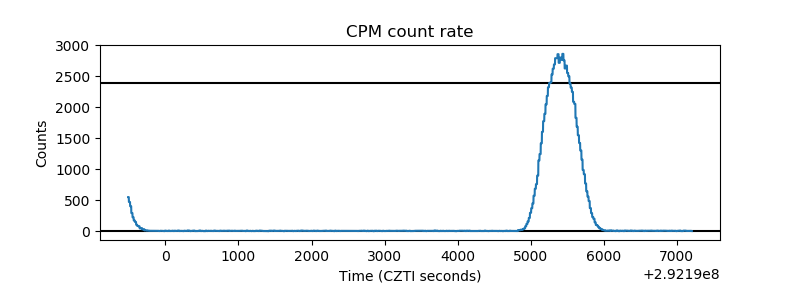 |
| CZT Counter | 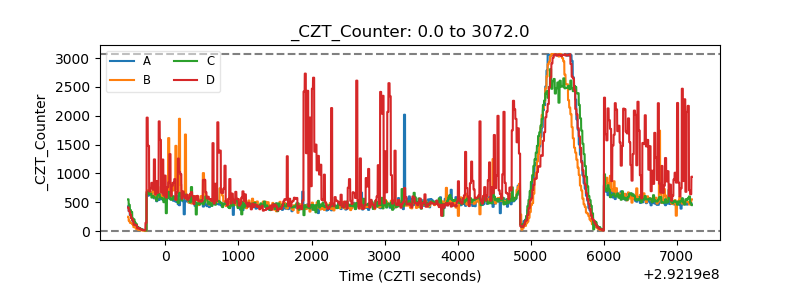 |
| +2.5 Volts monitor |  |
| +5 Volts monitor |  |
| _ROLL_ROT | 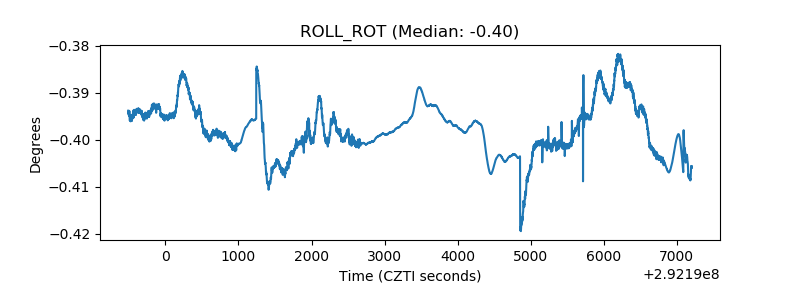 |
| _Roll_DEC |  |
| _Roll_RA | 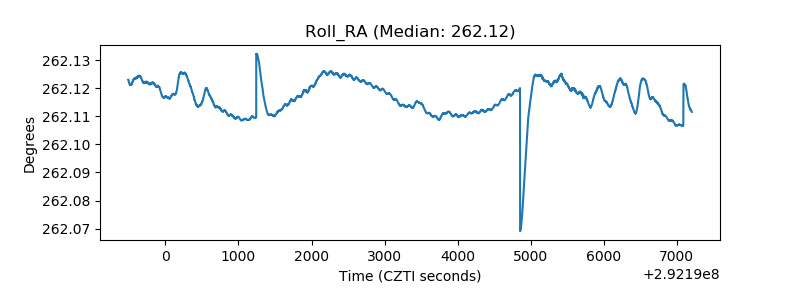 |
| Veto Counter | 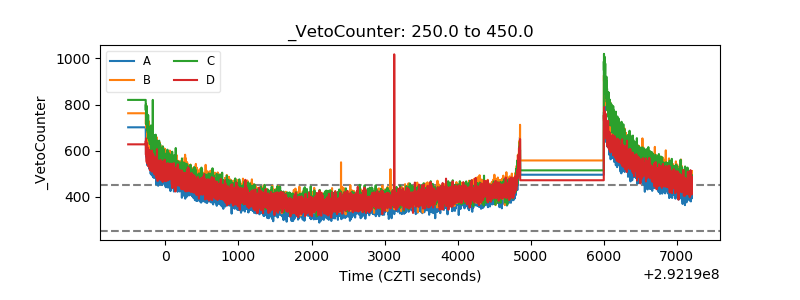 |