| Param | Original file | Final file |
|---|---|---|
| Filename | modeM0/AS1A05_046T01_9000002834_19032cztM0_level2.evt | modeM0/AS1A05_046T01_9000002834_19032cztM0_level2_quad_clean.evt |
| Size (bytes) | 492,416,640 | 107,510,400 |
| Size | 469.6 MB | 102.5 MB |
| Events in quadrant A | 3,177,558 | 708,923 |
| Events in quadrant B | 3,544,749 | 737,545 |
| Events in quadrant C | 3,299,762 | 705,618 |
| Events in quadrant D | 4,461,215 | 662,088 |
| Mode SS | |||
|---|---|---|---|
| Quadrant | BADHDUFLAG | Total packets | Discarded packets |
| A | 0 | 130 | 0 |
| B | 0 | 130 | 0 |
| C | 0 | 130 | 0 |
| D | 0 | 130 | 0 |
| Mode M0 | |||
|---|---|---|---|
| Quadrant | BADHDUFLAG | Total packets | Discarded packets |
| A | 0 | 13438 | 2 |
| B | 0 | 14640 | 2 |
| C | 0 | 13669 | 2 |
| D | 0 | 17434 | 2 |
| Mode M9 | |||
|---|---|---|---|
| Quadrant | BADHDUFLAG | Total packets | Discarded packets |
| A | 0 | 16 | 0 |
| B | 0 | 17 | 0 |
| C | 0 | 17 | 0 |
| D | 0 | 17 | 0 |
| Quadrant | Total seconds | Saturated seconds | Saturation percentage |
|---|---|---|---|
| A | 6325 | 28 | 0.442688% |
| B | 6325 | 90 | 1.422925% |
| C | 6325 | 53 | 0.837945% |
| D | 6325 | 342 | 5.407115% |
Noise dominated data is calculated using 1-second bins in cleaned event files. If a bin has >2000 counts, and if more than 50% of those come from <1% of pixels, then it is considered to be noise-dominated and hence unusable.
| Quadrant | # 1 sec bins | Bins with >0 counts | Bins with >2000 counts | High rate bins dominated by noise | Noise dominated (total time) | Noise dominated (detector-on time) | Marked lightcurve |
|---|---|---|---|---|---|---|---|
| A | 7595 | 6326 | 8 | 8 | 0.11% | 0.13% | 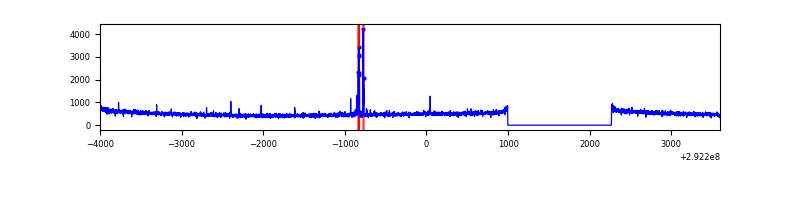 |
| B | 7595 | 6326 | 30 | 30 | 0.39% | 0.47% | 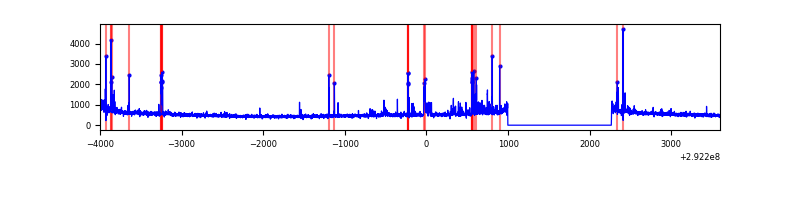 |
| C | 7595 | 6326 | 1 | 1 | 0.01% | 0.02% | 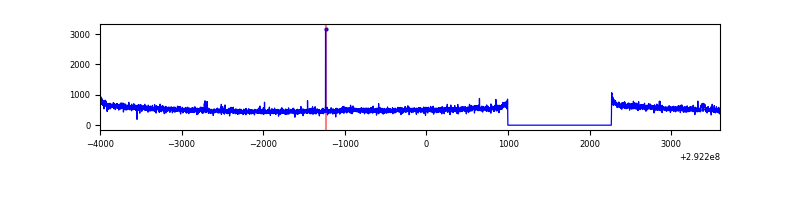 |
| D | 7595 | 6326 | 183 | 183 | 2.41% | 2.89% | 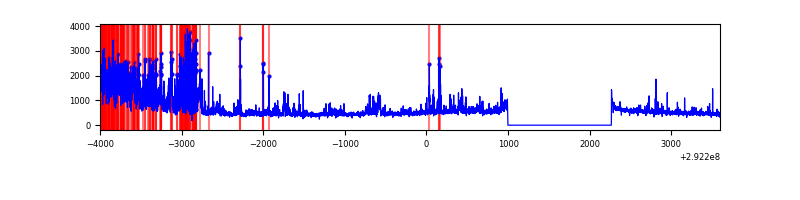 |
Top three noisy pixels from each quadrant. If the there are fewer than three noisy pixels in the level2.evt file, extra rows are filled as -1
| Pixel properties | Quadrant properties | ||||||
|---|---|---|---|---|---|---|---|
| Quadrant | DetID | PixID | Counts | Sigma | Mean | Median | Sigma |
| A | 14 | 235 | 52726 | 319.32 | 811 | 796 | 162.6 |
| A | 0 | 226 | 7065 | 38.55 | 811 | 796 | 162.6 |
| A | 13 | 254 | 6104 | 32.64 | 811 | 796 | 162.6 |
| B | 3 | 112 | 137286 | 891.17 | 820 | 802 | 153.2 |
| B | 7 | 220 | 108952 | 706.16 | 820 | 802 | 153.2 |
| B | 4 | 171 | 32014 | 203.8 | 820 | 802 | 153.2 |
| C | 14 | 238 | 124414 | 663.46 | 794 | 802 | 186.3 |
| C | 9 | 15 | 43813 | 230.85 | 794 | 802 | 186.3 |
| C | 3 | 233 | 30216 | 157.87 | 794 | 802 | 186.3 |
| D | 7 | 238 | 741081 | 3951.99 | 777 | 755 | 187.3 |
| D | 1 | 52 | 706006 | 3764.75 | 777 | 755 | 187.3 |
| D | 2 | 234 | 27648 | 143.56 | 777 | 755 | 187.3 |
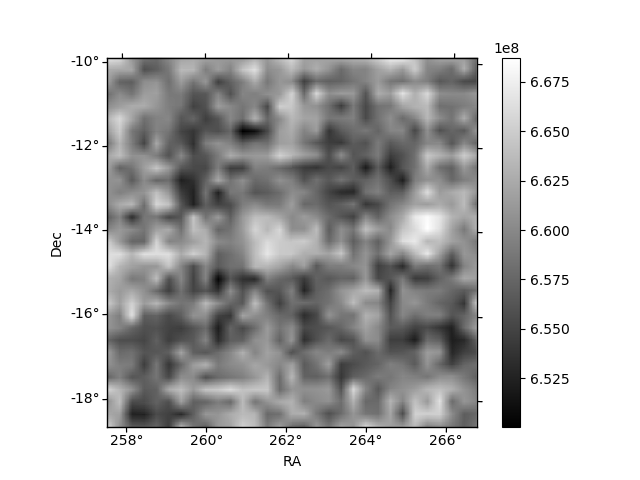
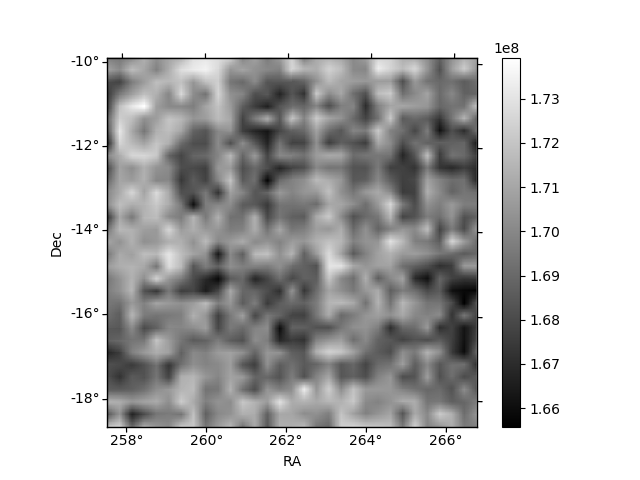
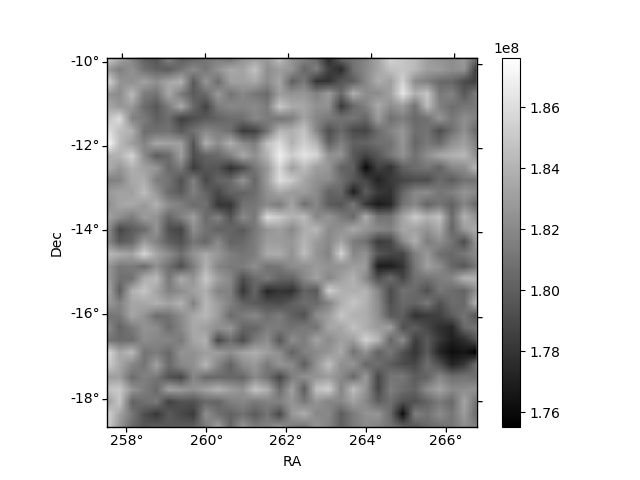
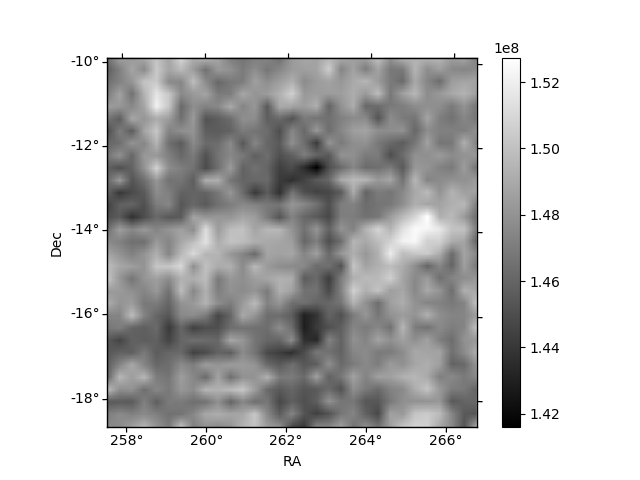
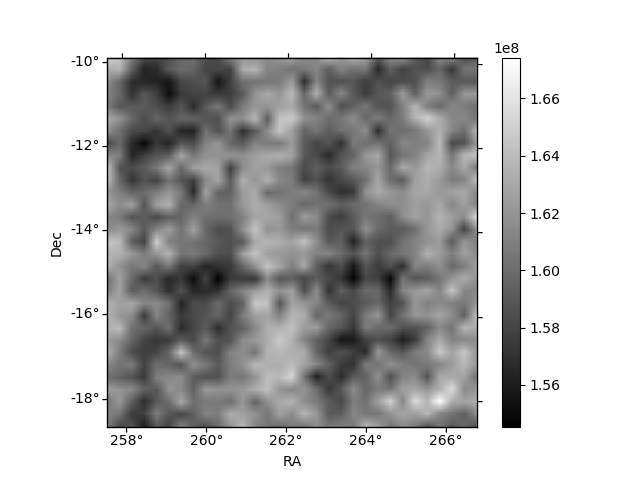
Histogram calculated using DETX and DETY for each event in the final _common_clean file
| Quadrant A | 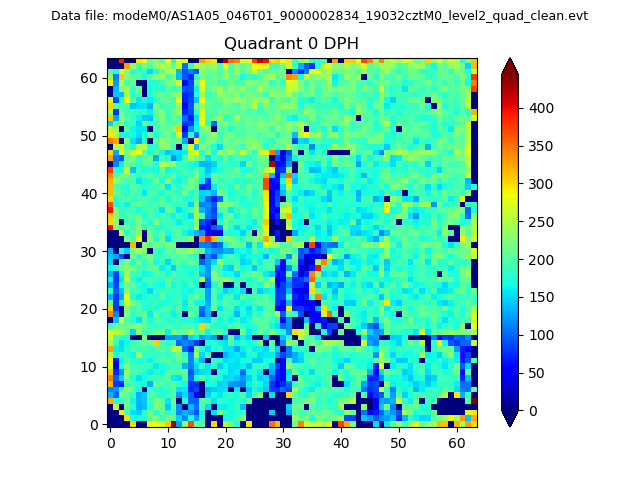 |
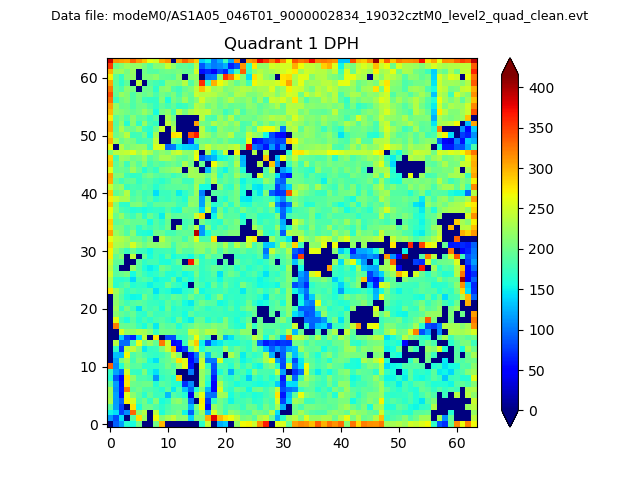 |
Quadrant B |
|---|---|---|---|
| Quadrant D |  |
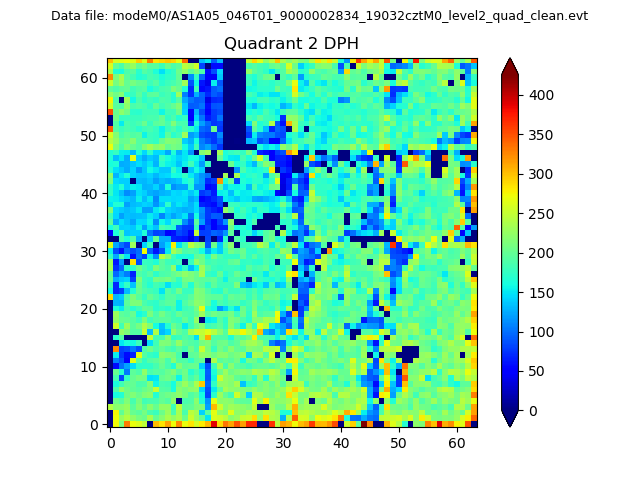 |
Quadrant C |
| Plot type | Count rate plots | Images |
|---|---|---|
| Comparison with Poisson distribution Blue bars denote a histogram of data divided into 1 sec bins. Red curve is a Poisson curve with rate = median count rate of data. |
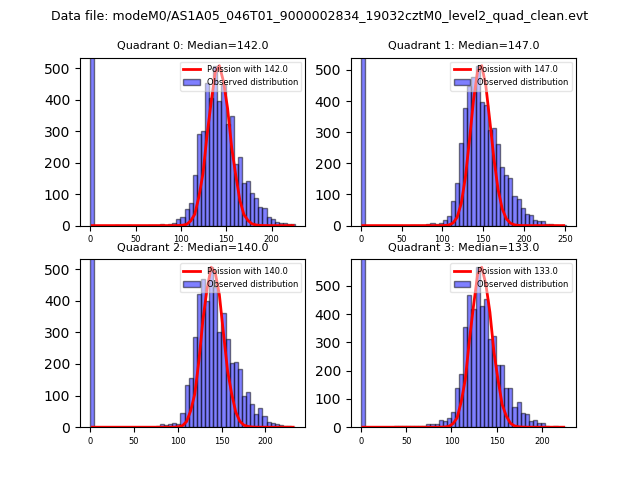 |
 |
| Quadrant-wise count rates Data is divided into 100 sec bins |
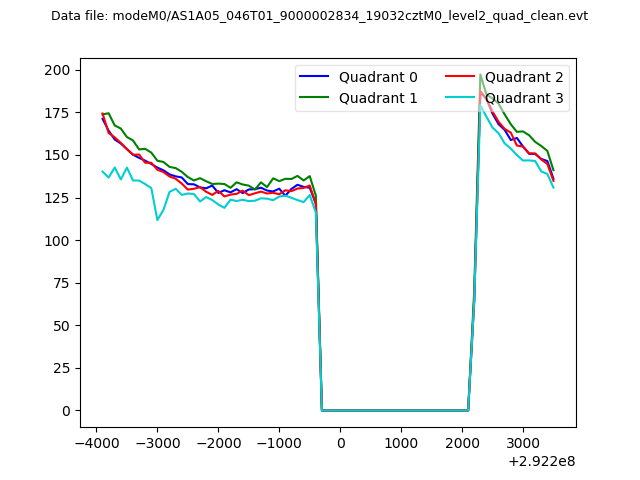 |
|
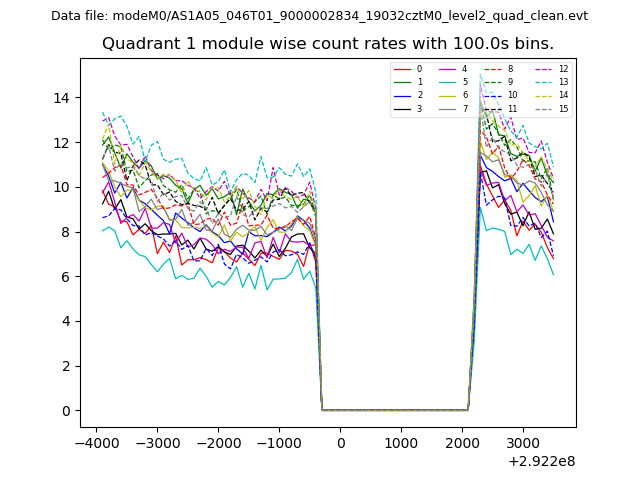
| Module-wise count rates for Quadrant A Data is divided into 100 sec bins |
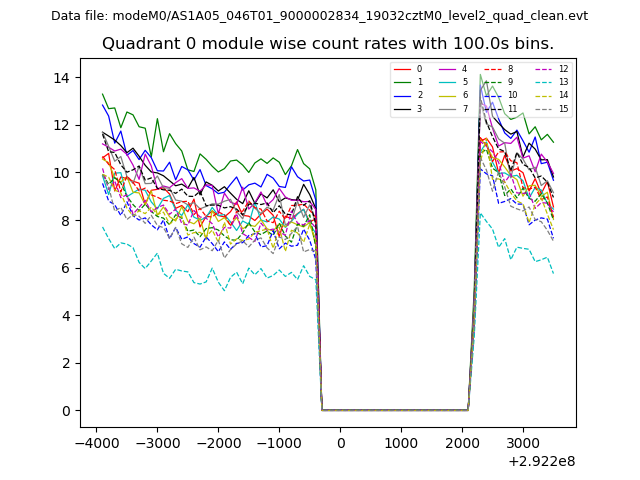 |
 |
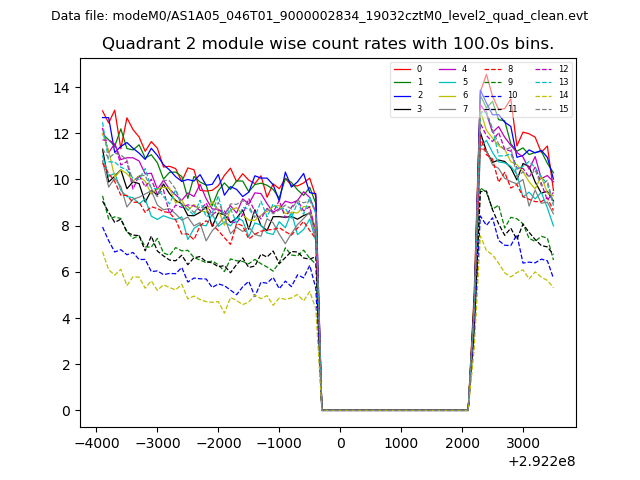
| Module-wise count rates for Quadrant B Data is divided into 100 sec bins |
 |
 |
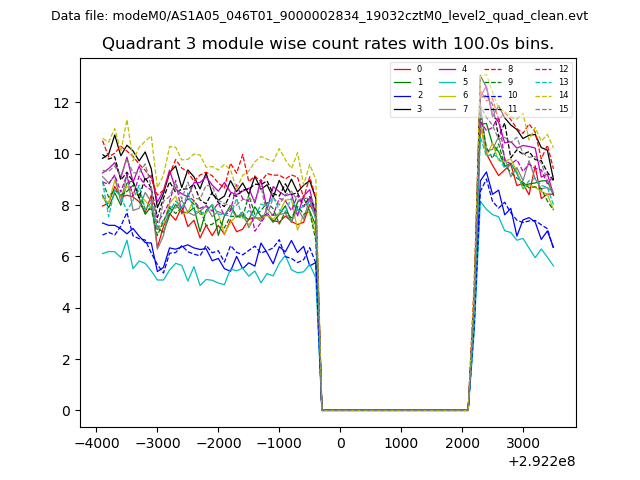
| Module-wise count rates for Quadrant C Data is divided into 100 sec bins |
 |
 |
| Module-wise count rates for Quadrant D Data is divided into 100 sec bins |
 |
 |
| Parameter | Plot |
|---|---|
| CZT HV Monitor | 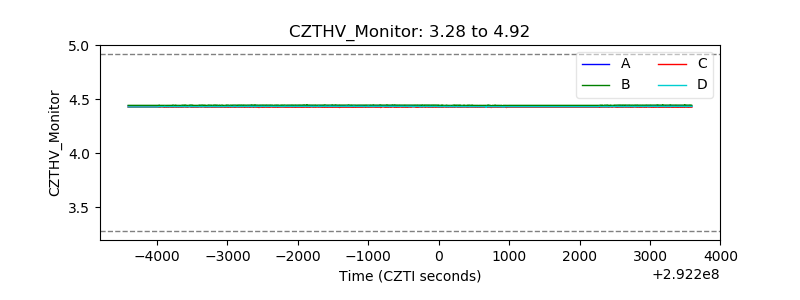 |
| D_VDD | 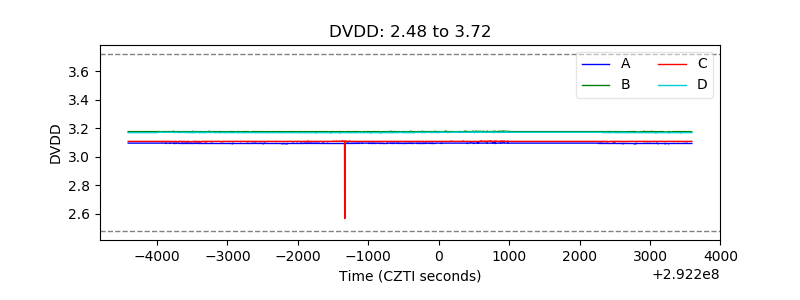 |
| Temperature 1 | 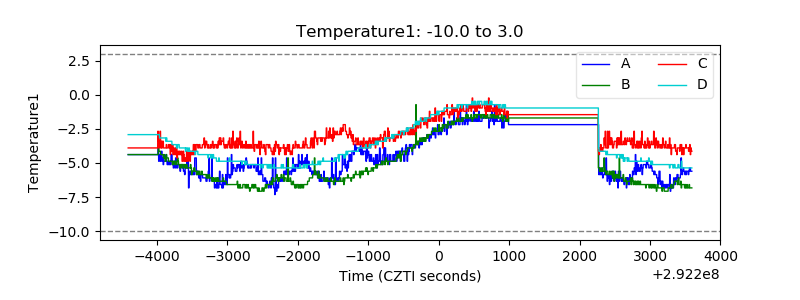 |
| Veto HV Monitor | 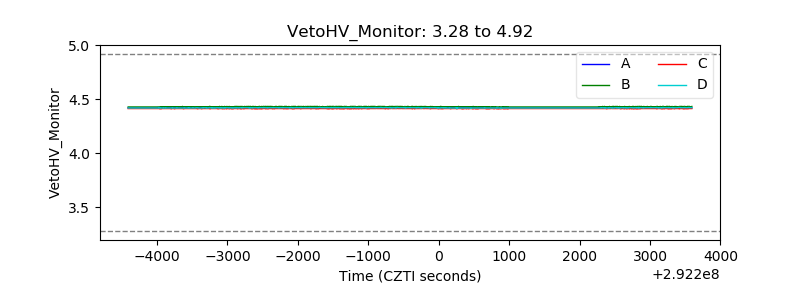 |
| Veto LLD | 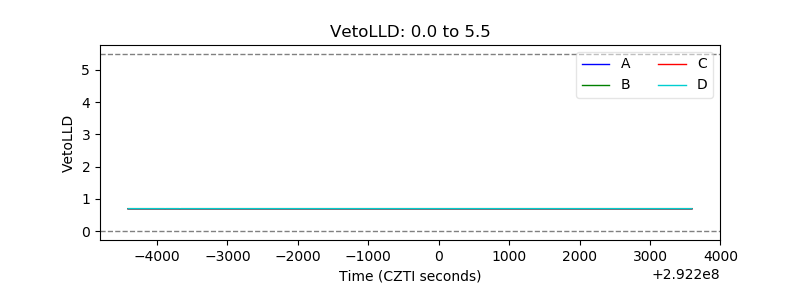 |
| Alpha Counter | 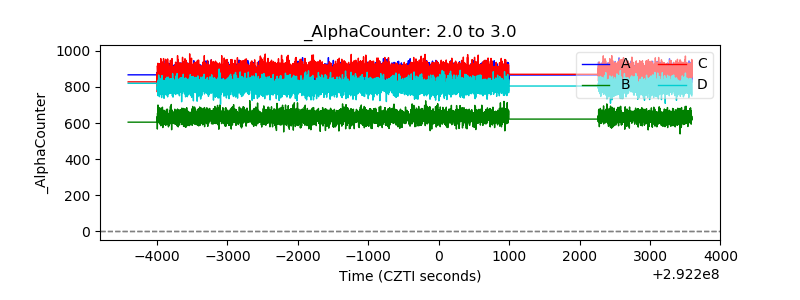 |
| _CPM_Rate |  |
| CZT Counter | 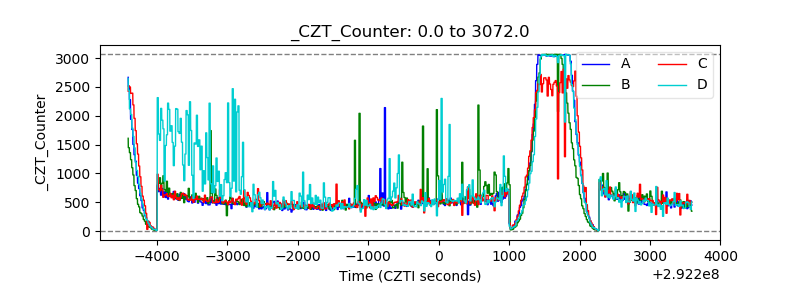 |
| +2.5 Volts monitor |  |
| +5 Volts monitor |  |
| _ROLL_ROT | 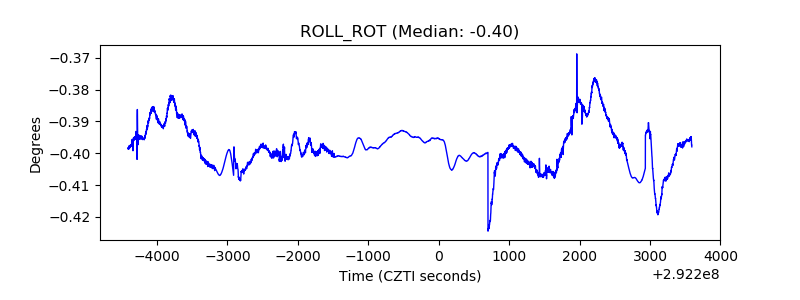 |
| _Roll_DEC | 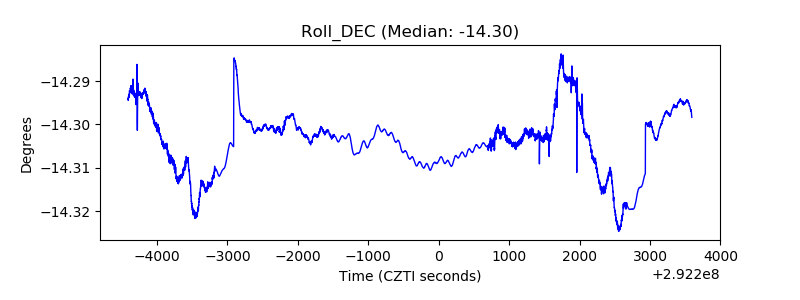 |
| _Roll_RA | 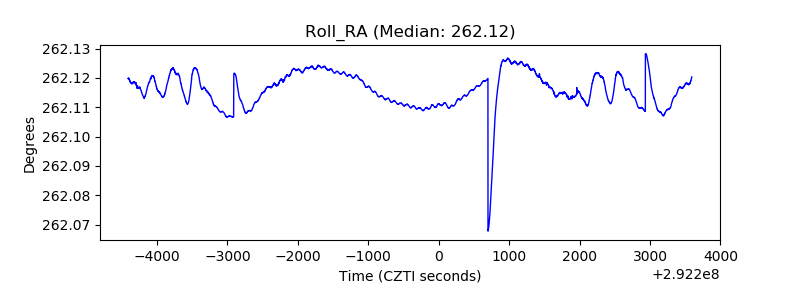 |
| Veto Counter | 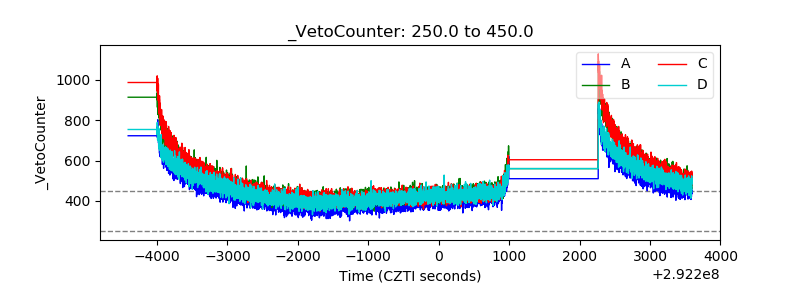 |