| Param | Original file | Final file |
|---|---|---|
| Filename | modeM0/AS1A05_046T01_9000002834_19034cztM0_level2.evt | modeM0/AS1A05_046T01_9000002834_19034cztM0_level2_quad_clean.evt |
| Size (bytes) | 504,420,480 | 104,480,640 |
| Size | 481.1 MB | 99.6 MB |
| Events in quadrant A | 3,305,252 | 686,388 |
| Events in quadrant B | 3,701,341 | 708,819 |
| Events in quadrant C | 3,442,439 | 675,878 |
| Events in quadrant D | 4,384,219 | 637,552 |
| Mode SS | |||
|---|---|---|---|
| Quadrant | BADHDUFLAG | Total packets | Discarded packets |
| A | 0 | 134 | 0 |
| B | 0 | 134 | 0 |
| C | 0 | 134 | 0 |
| D | 0 | 134 | 0 |
| Mode M0 | |||
|---|---|---|---|
| Quadrant | BADHDUFLAG | Total packets | Discarded packets |
| A | 0 | 13769 | 2 |
| B | 0 | 15090 | 2 |
| C | 0 | 13980 | 2 |
| D | 0 | 17303 | 2 |
| Mode M9 | |||
|---|---|---|---|
| Quadrant | BADHDUFLAG | Total packets | Discarded packets |
| A | 0 | 21 | 0 |
| B | 0 | 22 | 0 |
| C | 0 | 22 | 0 |
| D | 0 | 22 | 0 |
| Quadrant | Total seconds | Saturated seconds | Saturation percentage |
|---|---|---|---|
| A | 6528 | 39 | 0.597426% |
| B | 6528 | 109 | 1.669730% |
| C | 6528 | 65 | 0.995711% |
| D | 6528 | 270 | 4.136029% |
Noise dominated data is calculated using 1-second bins in cleaned event files. If a bin has >2000 counts, and if more than 50% of those come from <1% of pixels, then it is considered to be noise-dominated and hence unusable.
| Quadrant | # 1 sec bins | Bins with >0 counts | Bins with >2000 counts | High rate bins dominated by noise | Noise dominated (total time) | Noise dominated (detector-on time) | Marked lightcurve |
|---|---|---|---|---|---|---|---|
| A | 7878 | 6529 | 0 | 0 | 0.00% | 0.00% | 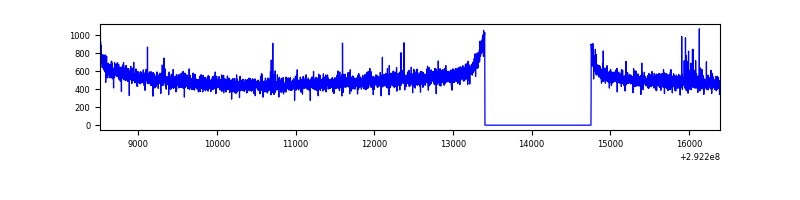 |
| B | 7878 | 6529 | 20 | 20 | 0.25% | 0.31% | 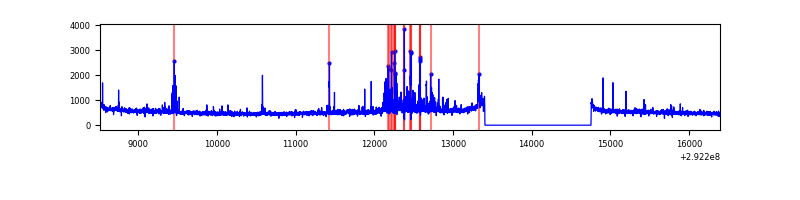 |
| C | 7878 | 6529 | 0 | 0 | 0.00% | 0.00% | 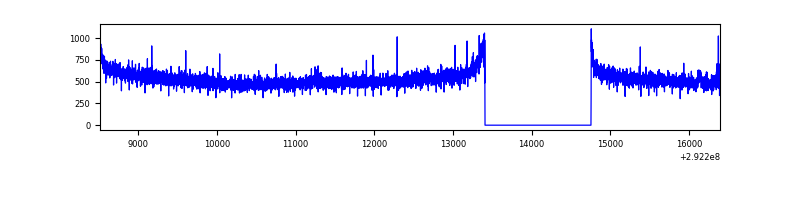 |
| D | 7878 | 6529 | 182 | 182 | 2.31% | 2.79% | 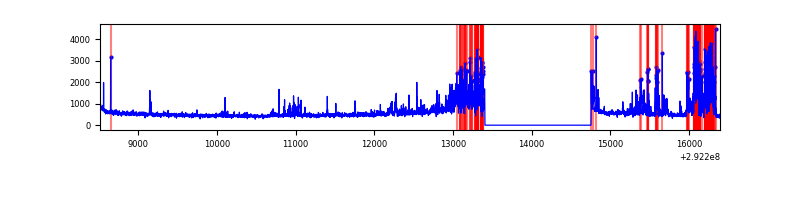 |
Top three noisy pixels from each quadrant. If the there are fewer than three noisy pixels in the level2.evt file, extra rows are filled as -1
| Pixel properties | Quadrant properties | ||||||
|---|---|---|---|---|---|---|---|
| Quadrant | DetID | PixID | Counts | Sigma | Mean | Median | Sigma |
| A | 8 | 6 | 8540 | 44.97 | 854 | 837 | 171.3 |
| A | 13 | 254 | 7754 | 40.38 | 854 | 837 | 171.3 |
| A | 0 | 226 | 7311 | 37.79 | 854 | 837 | 171.3 |
| B | 7 | 220 | 172247 | 1072.95 | 857 | 837 | 159.8 |
| B | 3 | 112 | 111208 | 690.88 | 857 | 837 | 159.8 |
| B | 0 | 189 | 38649 | 236.69 | 857 | 837 | 159.8 |
| C | 14 | 238 | 131617 | 676.96 | 832 | 839 | 193.2 |
| C | 3 | 233 | 41553 | 210.75 | 832 | 839 | 193.2 |
| C | 9 | 15 | 22544 | 112.35 | 832 | 839 | 193.2 |
| D | 7 | 238 | 1234044 | 6167.12 | 819 | 797 | 200.0 |
| D | 2 | 234 | 30821 | 150.14 | 819 | 797 | 200.0 |
| D | 1 | 52 | 18696 | 89.51 | 819 | 797 | 200.0 |
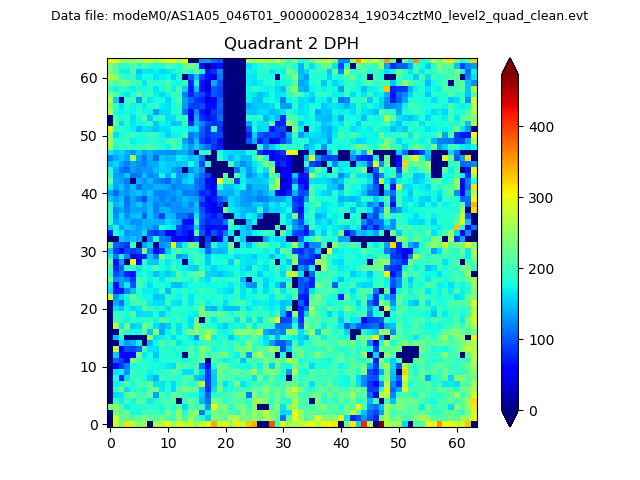
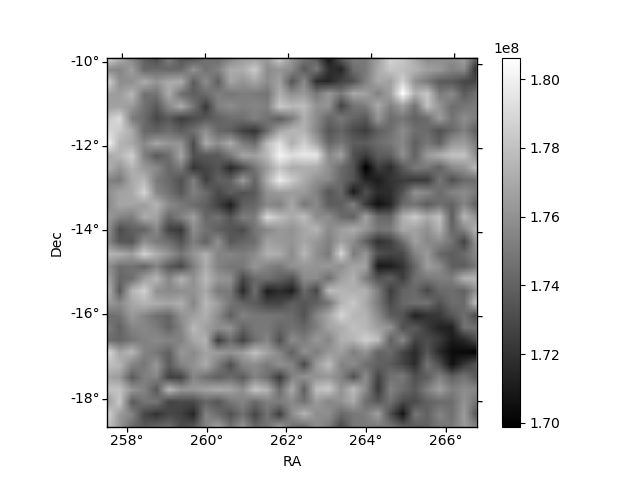
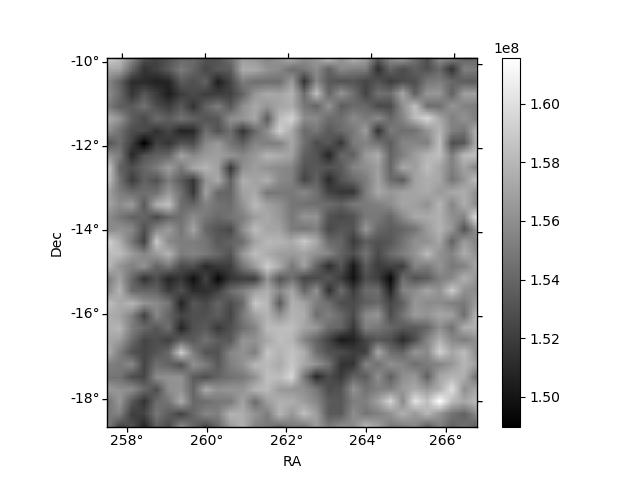
Histogram calculated using DETX and DETY for each event in the final _common_clean file
| Quadrant A | 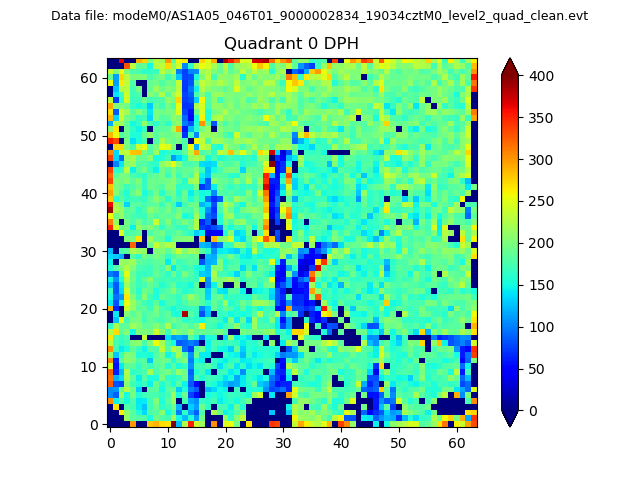 |
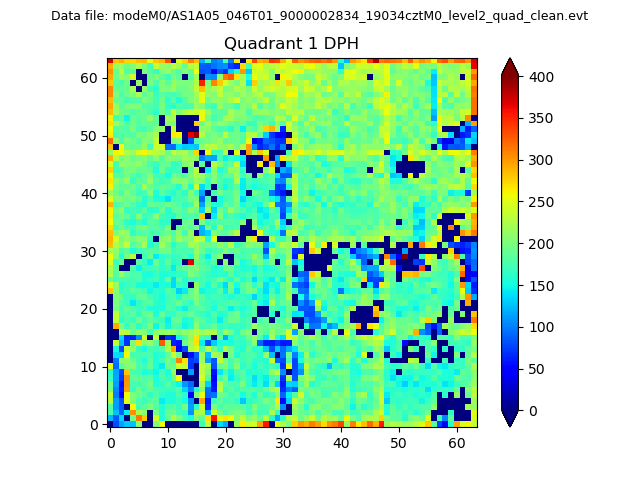 |
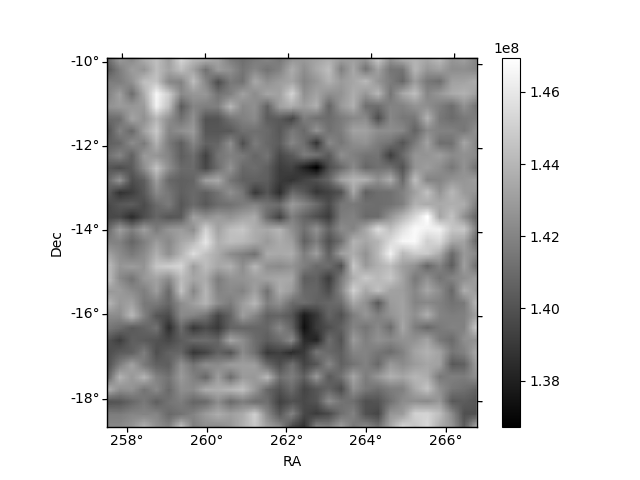
Quadrant B |
|---|---|---|---|
| Quadrant D | 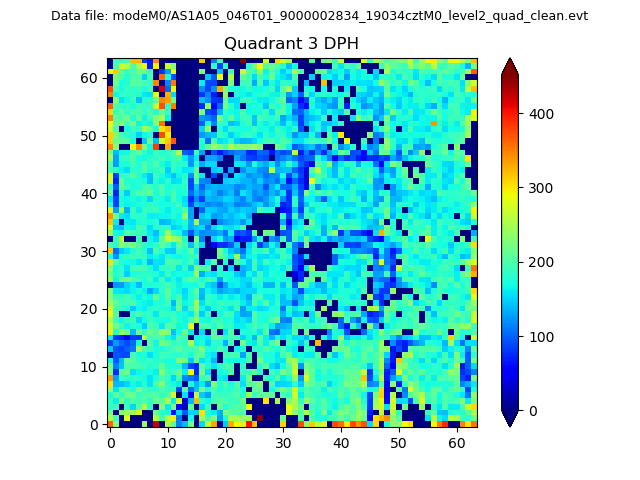 |
 |
Quadrant C |
| Plot type | Count rate plots | Images |
|---|---|---|
| Comparison with Poisson distribution Blue bars denote a histogram of data divided into 1 sec bins. Red curve is a Poisson curve with rate = median count rate of data. |
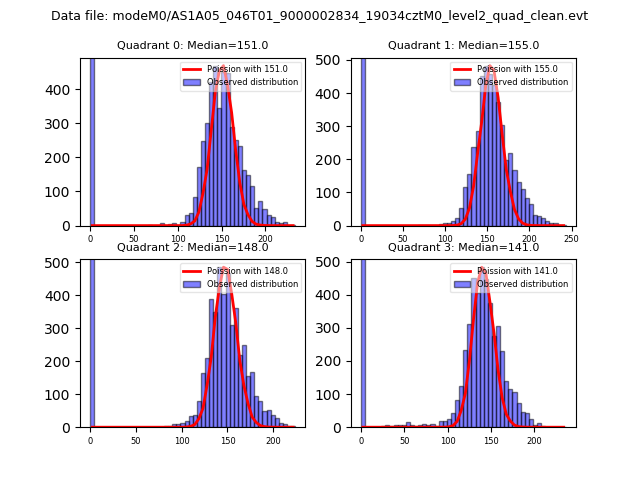 |
 |
| Quadrant-wise count rates Data is divided into 100 sec bins |
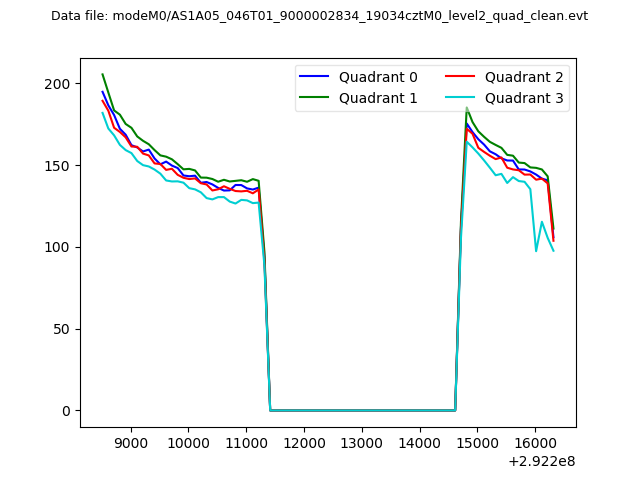 |
|
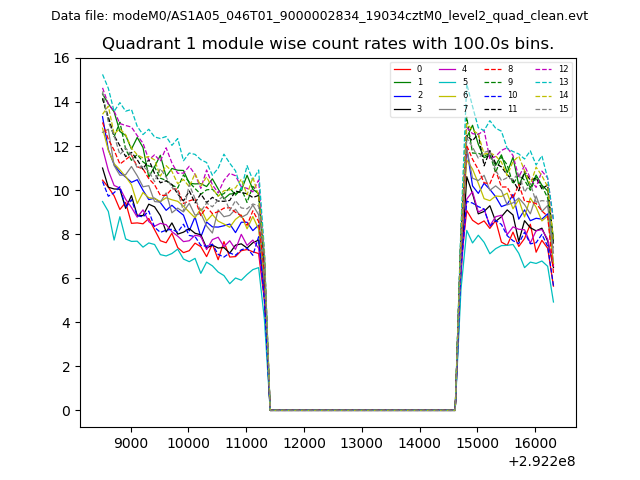
| Module-wise count rates for Quadrant A Data is divided into 100 sec bins |
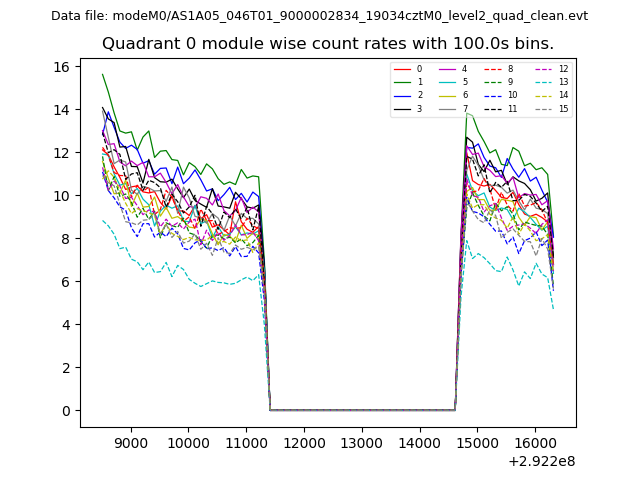 |
 |
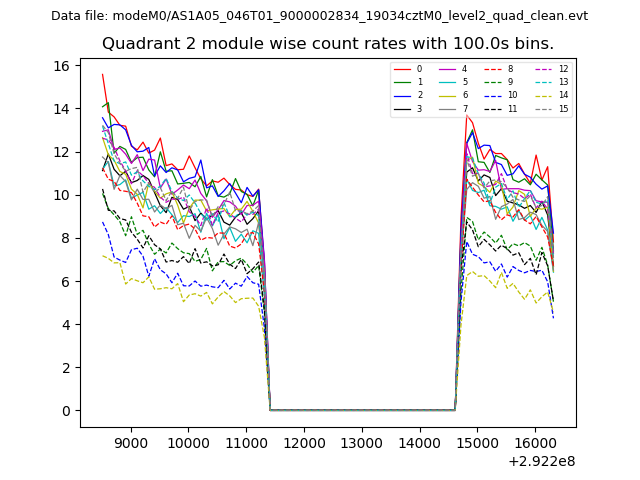
| Module-wise count rates for Quadrant B Data is divided into 100 sec bins |
 |
 |
| Module-wise count rates for Quadrant C Data is divided into 100 sec bins |
 |
 |
| Module-wise count rates for Quadrant D Data is divided into 100 sec bins |
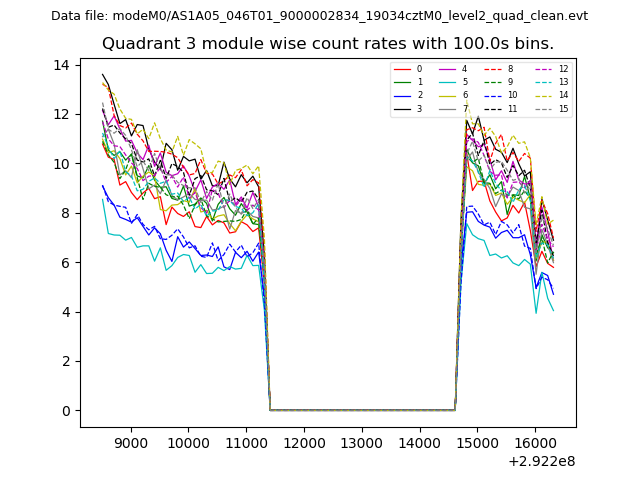 |
 |
| Parameter | Plot |
|---|---|
| CZT HV Monitor | 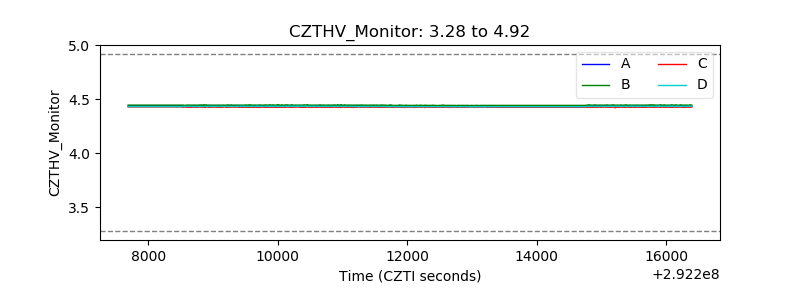 |
| D_VDD | 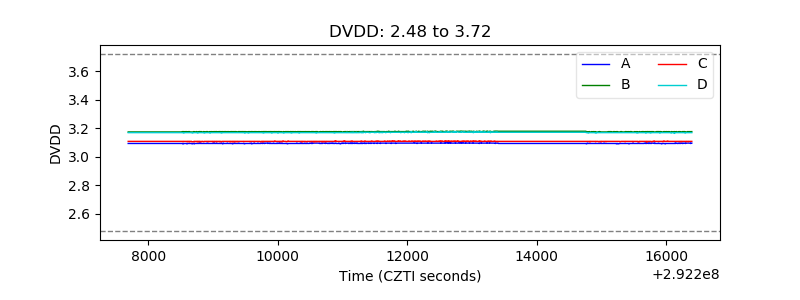 |
| Temperature 1 | 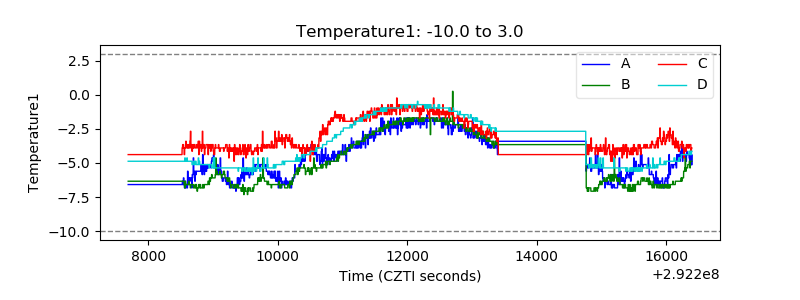 |
| Veto HV Monitor | 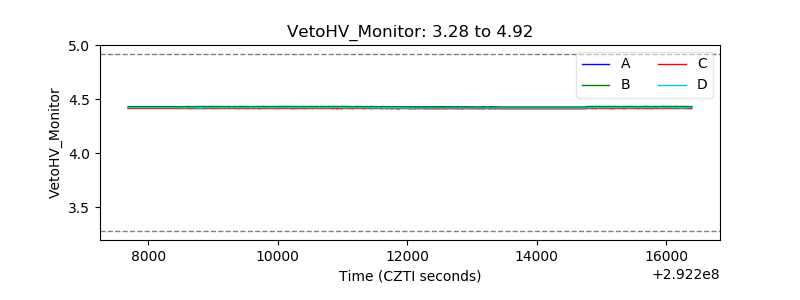 |
| Veto LLD | 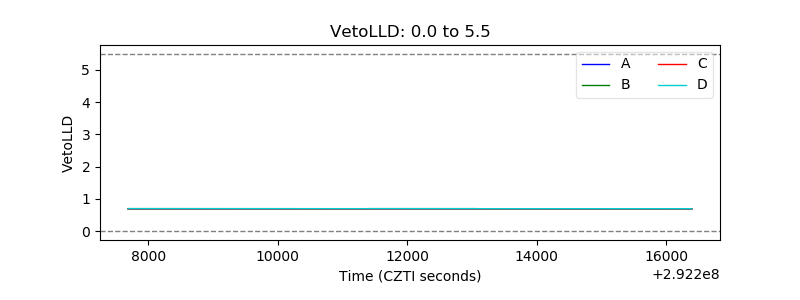 |
| Alpha Counter | 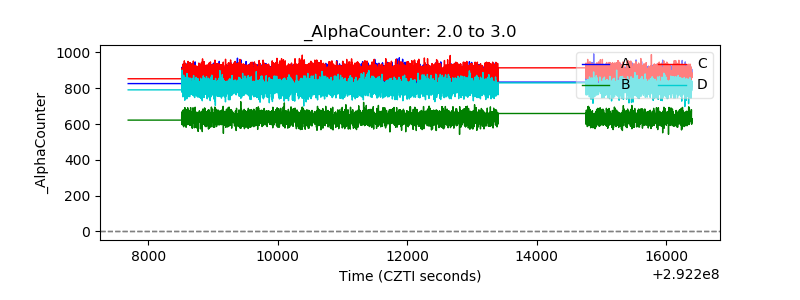 |
| _CPM_Rate | 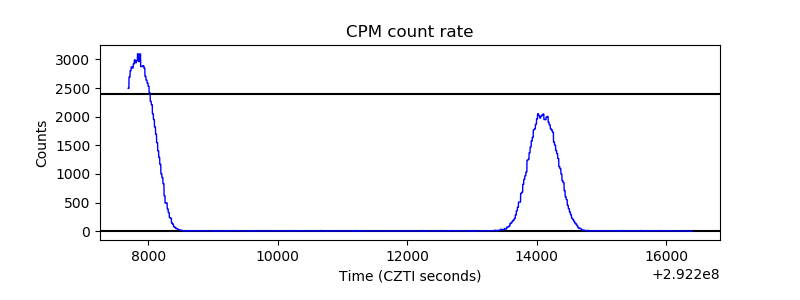 |
| CZT Counter | 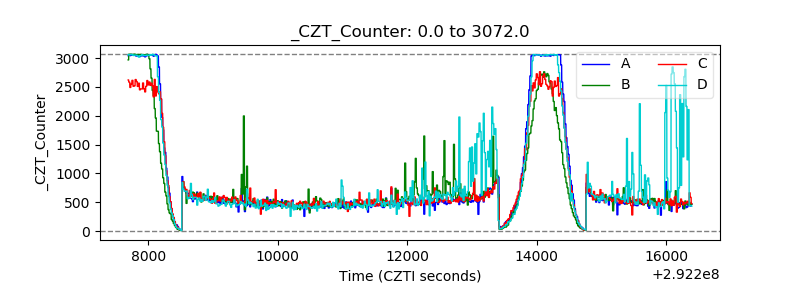 |
| +2.5 Volts monitor |  |
| +5 Volts monitor |  |
| _ROLL_ROT |  |
| _Roll_DEC |  |
| _Roll_RA | 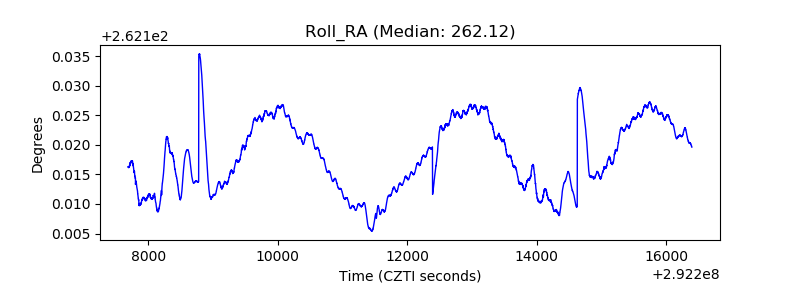 |
| Veto Counter |  |