| Param | Original file | Final file |
|---|---|---|
| Filename | modeM0/AS1A05_046T01_9000002834_19036cztM0_level2.evt | modeM0/AS1A05_046T01_9000002834_19036cztM0_level2_quad_clean.evt |
| Size (bytes) | 590,077,440 | 96,678,720 |
| Size | 562.7 MB | 92.2 MB |
| Events in quadrant A | 3,321,996 | 623,898 |
| Events in quadrant B | 3,555,191 | 640,374 |
| Events in quadrant C | 3,748,418 | 611,637 |
| Events in quadrant D | 6,778,939 | 572,235 |
| Mode SS | |||
|---|---|---|---|
| Quadrant | BADHDUFLAG | Total packets | Discarded packets |
| A | 0 | 140 | 0 |
| B | 0 | 140 | 0 |
| C | 0 | 140 | 0 |
| D | 0 | 140 | 0 |
| Mode M0 | |||
|---|---|---|---|
| Quadrant | BADHDUFLAG | Total packets | Discarded packets |
| A | 0 | 14136 | 1 |
| B | 0 | 14778 | 1 |
| C | 0 | 15148 | 1 |
| D | 0 | 24907 | 4 |
| Mode M9 | |||
|---|---|---|---|
| Quadrant | BADHDUFLAG | Total packets | Discarded packets |
| A | 0 | 10 | 0 |
| B | 0 | 10 | 0 |
| C | 0 | 10 | 0 |
| D | 0 | 10 | 0 |
| Quadrant | Total seconds | Saturated seconds | Saturation percentage |
|---|---|---|---|
| A | 6882 | 60 | 0.871840% |
| B | 6883 | 84 | 1.220398% |
| C | 6883 | 110 | 1.598140% |
| D | 6882 | 614 | 8.921825% |
Noise dominated data is calculated using 1-second bins in cleaned event files. If a bin has >2000 counts, and if more than 50% of those come from <1% of pixels, then it is considered to be noise-dominated and hence unusable.
| Quadrant | # 1 sec bins | Bins with >0 counts | Bins with >2000 counts | High rate bins dominated by noise | Noise dominated (total time) | Noise dominated (detector-on time) | Marked lightcurve |
|---|---|---|---|---|---|---|---|
| A | 7892 | 6883 | 0 | 0 | 0.00% | 0.00% | 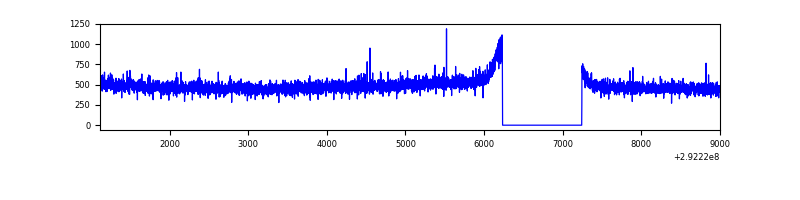 |
| B | 7893 | 6884 | 6 | 6 | 0.08% | 0.09% | 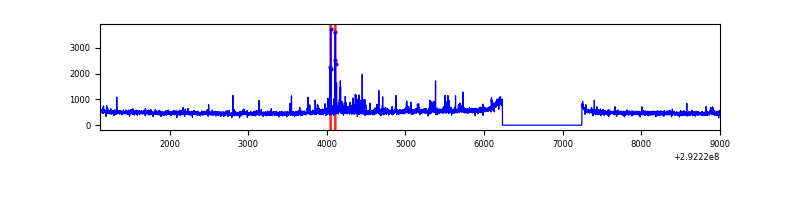 |
| C | 7893 | 6884 | 1 | 1 | 0.01% | 0.01% | 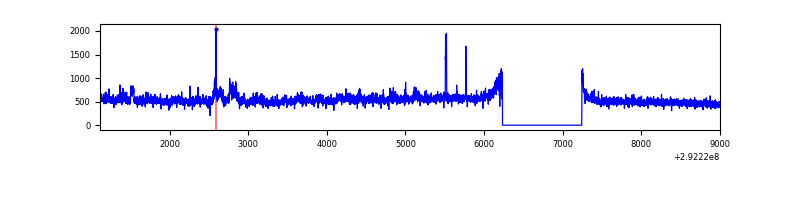 |
| D | 7892 | 6883 | 489 | 489 | 6.20% | 7.10% | 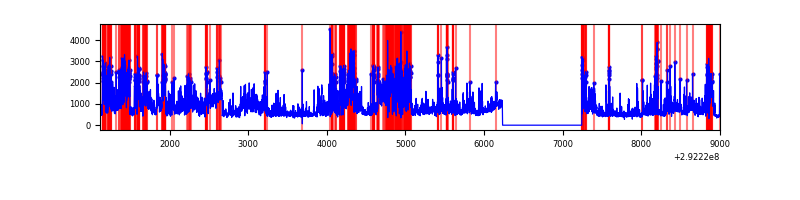 |
Top three noisy pixels from each quadrant. If the there are fewer than three noisy pixels in the level2.evt file, extra rows are filled as -1
| Pixel properties | Quadrant properties | ||||||
|---|---|---|---|---|---|---|---|
| Quadrant | DetID | PixID | Counts | Sigma | Mean | Median | Sigma |
| A | 13 | 254 | 8106 | 41.6 | 862 | 845 | 174.5 |
| A | 0 | 226 | 7587 | 38.63 | 862 | 845 | 174.5 |
| A | 3 | 137 | 6372 | 31.66 | 862 | 845 | 174.5 |
| B | 7 | 220 | 96944 | 583.27 | 858 | 835 | 164.8 |
| B | 3 | 112 | 35502 | 210.39 | 858 | 835 | 164.8 |
| B | 0 | 229 | 23159 | 135.48 | 858 | 835 | 164.8 |
| C | 3 | 233 | 324779 | 1655.33 | 831 | 839 | 195.7 |
| C | 14 | 238 | 128375 | 651.71 | 831 | 839 | 195.7 |
| C | 9 | 15 | 55412 | 278.87 | 831 | 839 | 195.7 |
| D | 7 | 238 | 3565516 | 17725.13 | 825 | 804 | 201.1 |
| D | 2 | 234 | 28682 | 138.62 | 825 | 804 | 201.1 |
| D | 1 | 31 | 25295 | 121.78 | 825 | 804 | 201.1 |
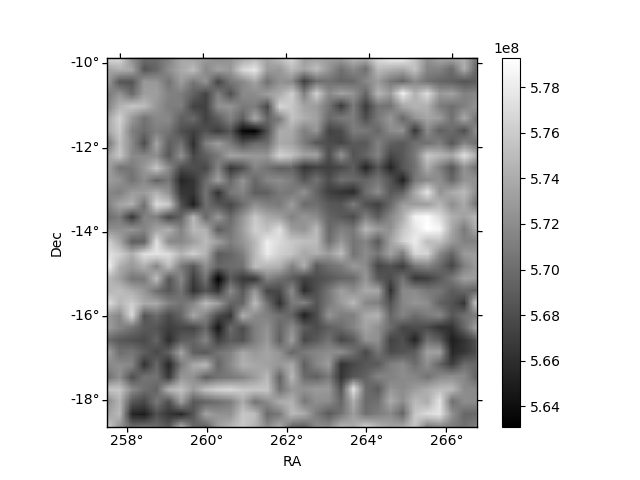
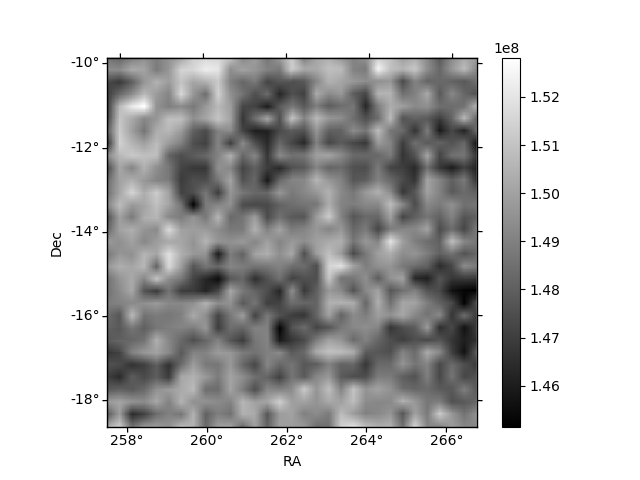
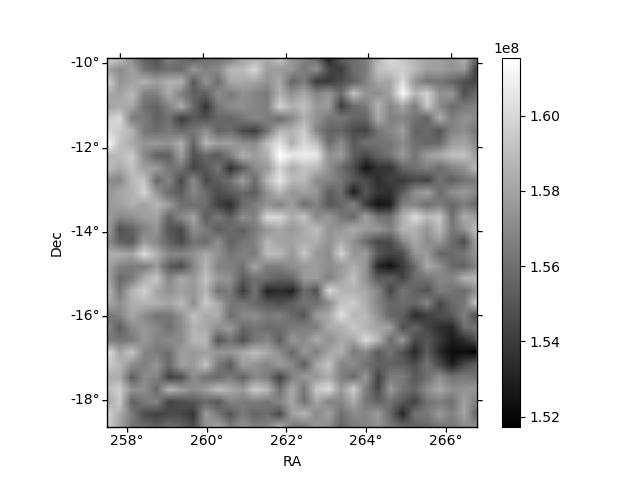
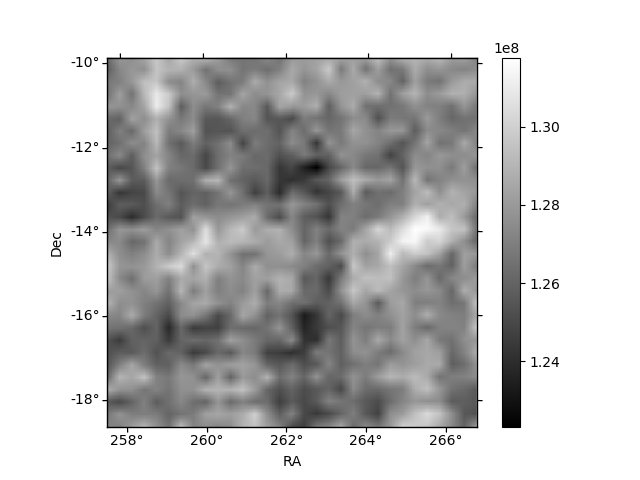
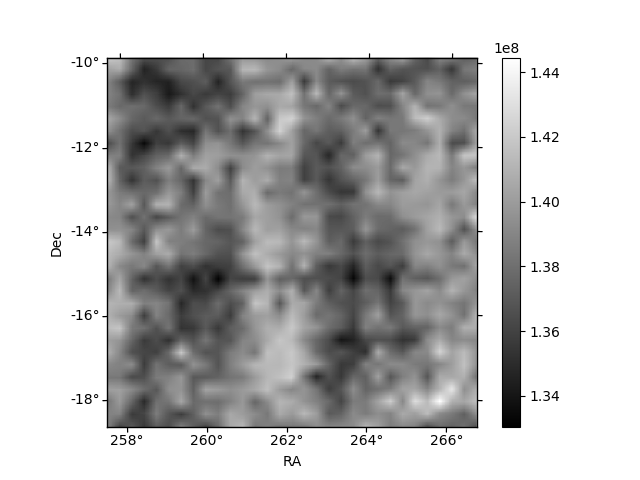
Histogram calculated using DETX and DETY for each event in the final _common_clean file
| Quadrant A | 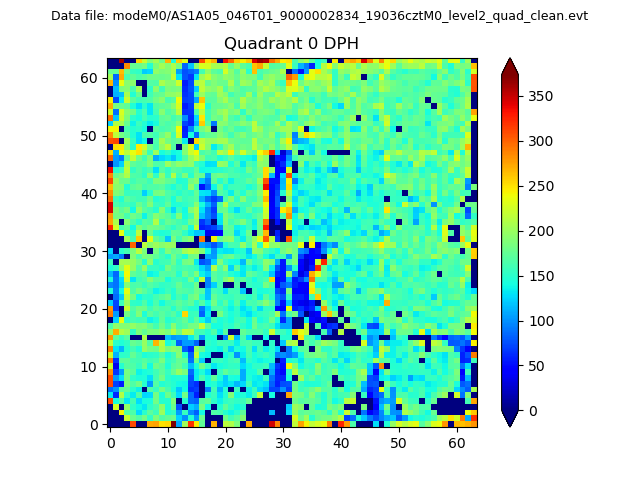 |
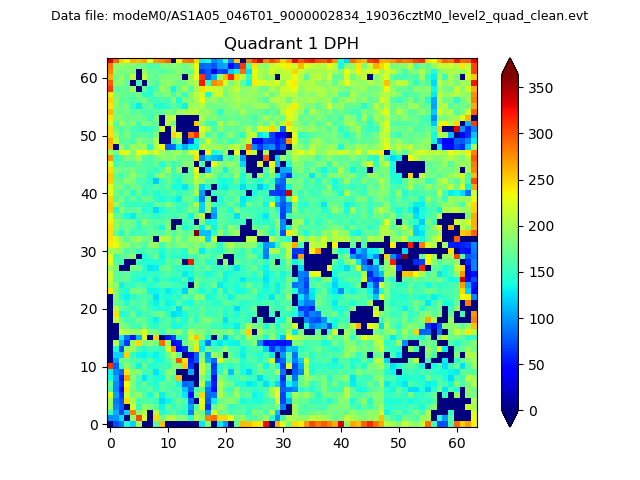 |
Quadrant B |
|---|---|---|---|
| Quadrant D |  |
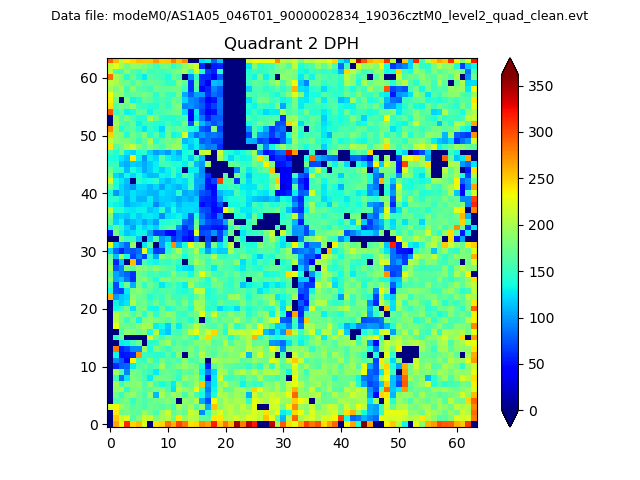 |
Quadrant C |
| Plot type | Count rate plots | Images |
|---|---|---|
| Comparison with Poisson distribution Blue bars denote a histogram of data divided into 1 sec bins. Red curve is a Poisson curve with rate = median count rate of data. |
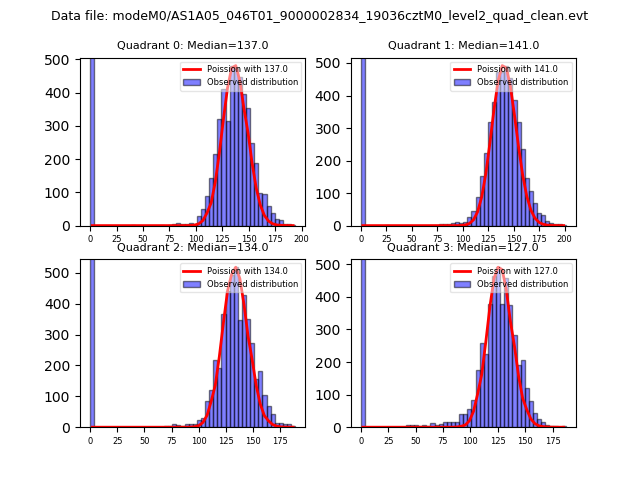 |
 |
| Quadrant-wise count rates Data is divided into 100 sec bins |
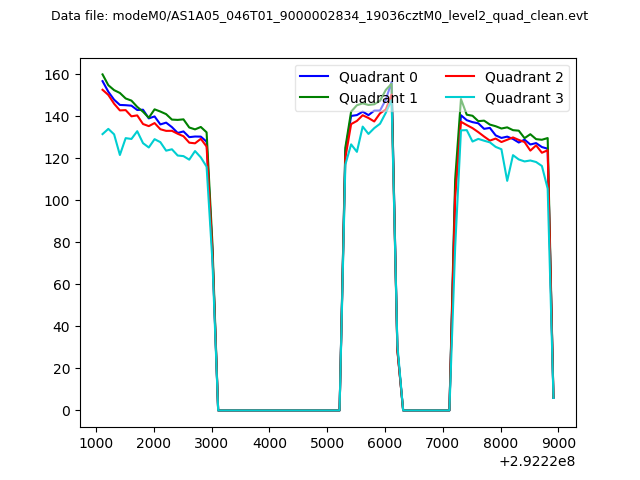 |
|
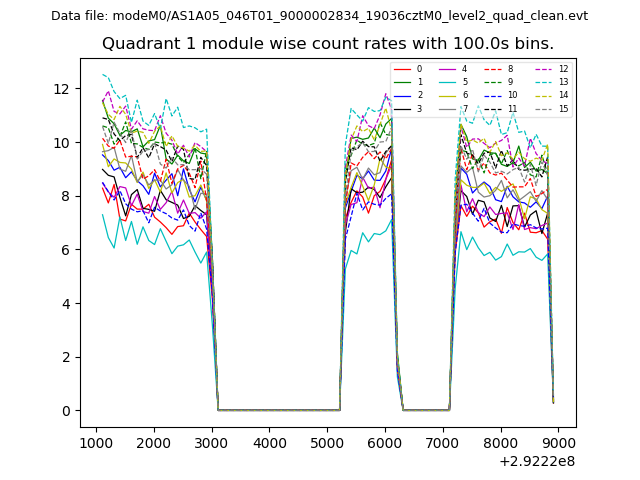
| Module-wise count rates for Quadrant A Data is divided into 100 sec bins |
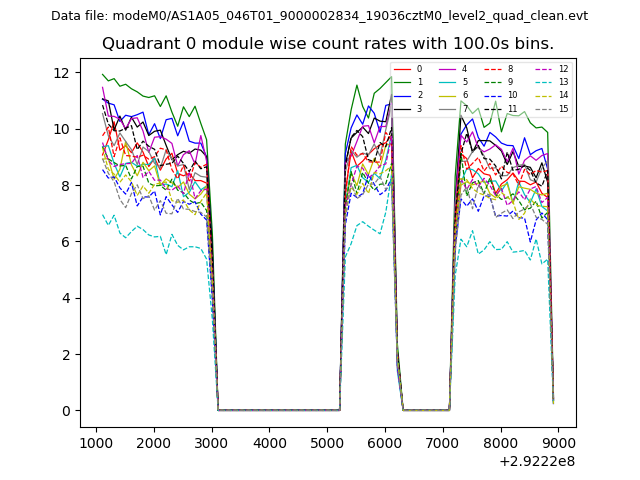 |
 |
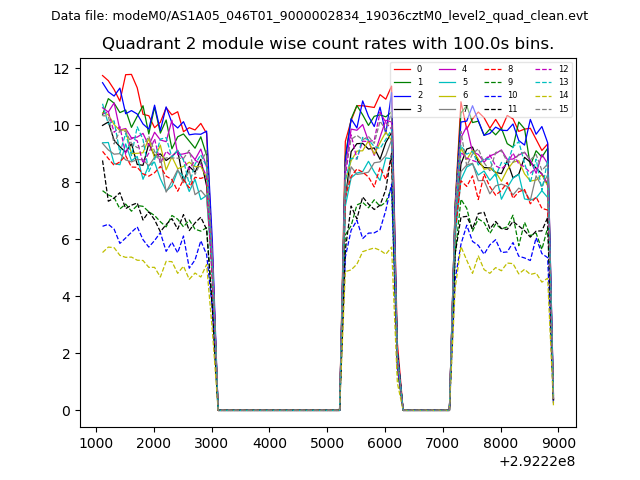
| Module-wise count rates for Quadrant B Data is divided into 100 sec bins |
 |
 |
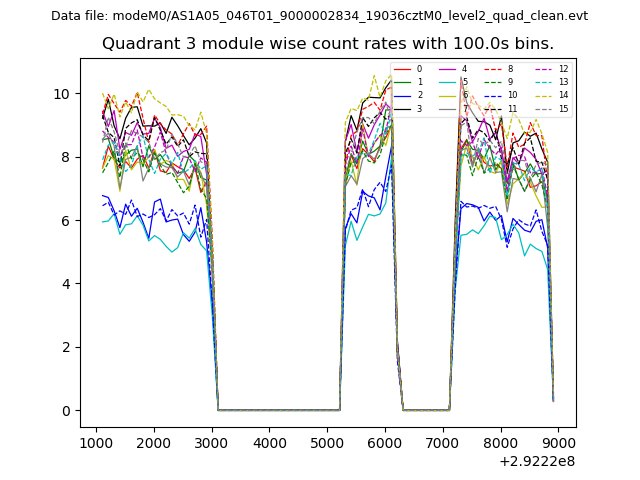
| Module-wise count rates for Quadrant C Data is divided into 100 sec bins |
 |
 |
| Module-wise count rates for Quadrant D Data is divided into 100 sec bins |
 |
 |
| Parameter | Plot |
|---|---|
| CZT HV Monitor | 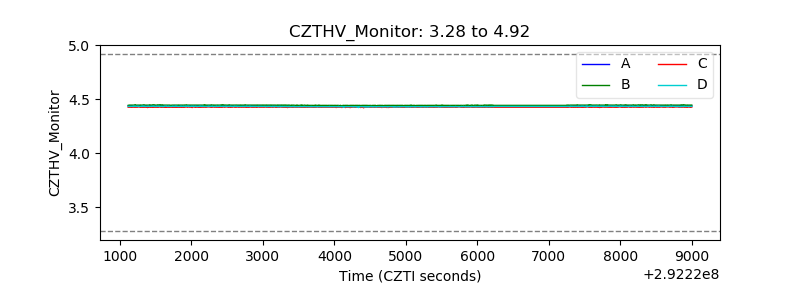 |
| D_VDD | 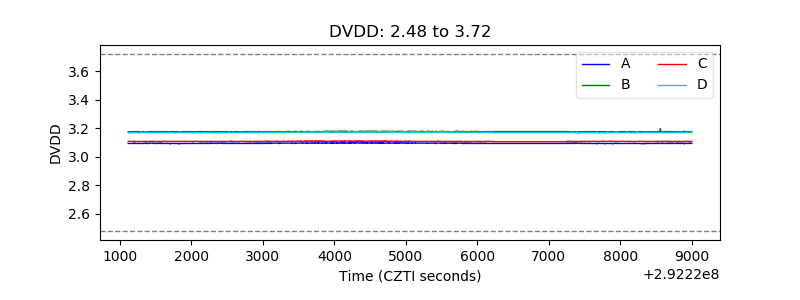 |
| Temperature 1 | 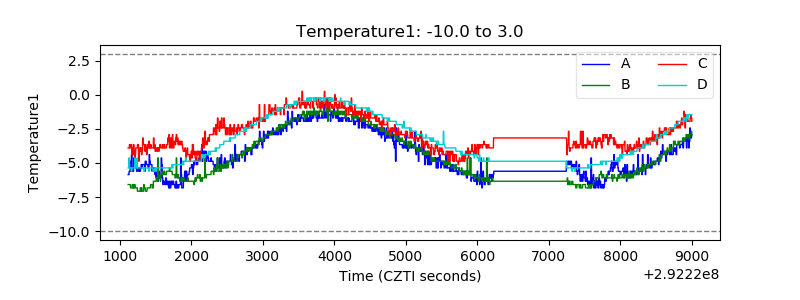 |
| Veto HV Monitor |  |
| Veto LLD | 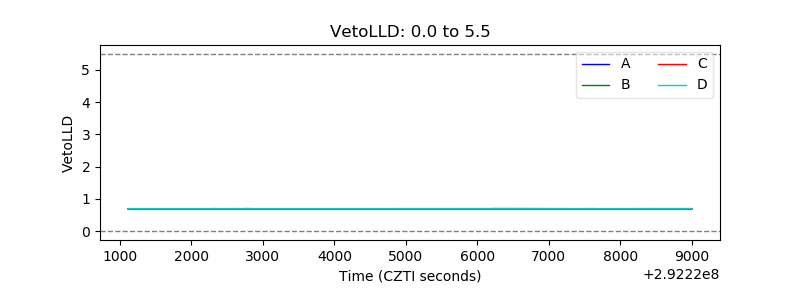 |
| Alpha Counter | 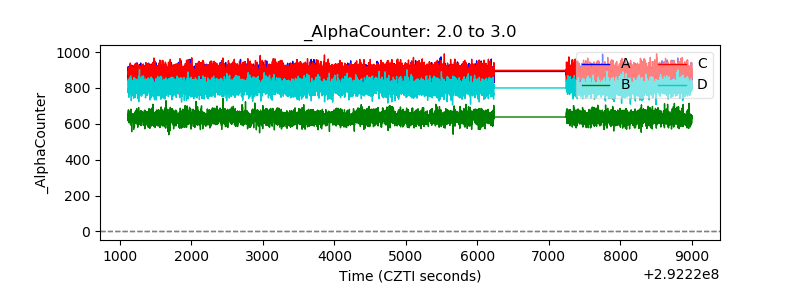 |
| _CPM_Rate | 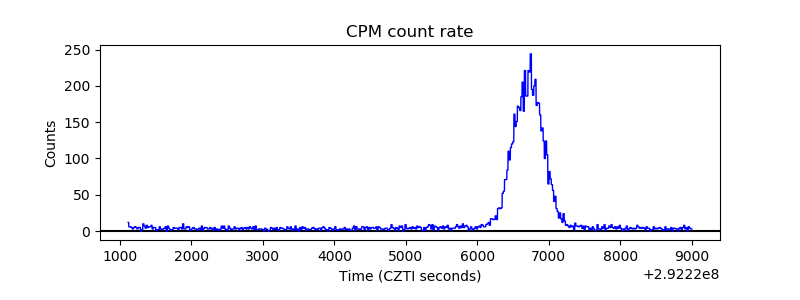 |
| CZT Counter |  |
| +2.5 Volts monitor |  |
| +5 Volts monitor |  |
| _ROLL_ROT | 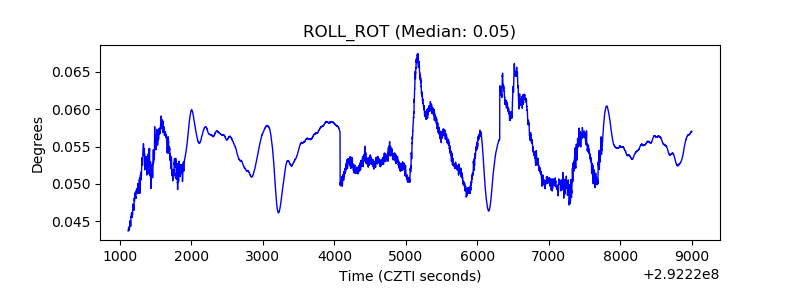 |
| _Roll_DEC | 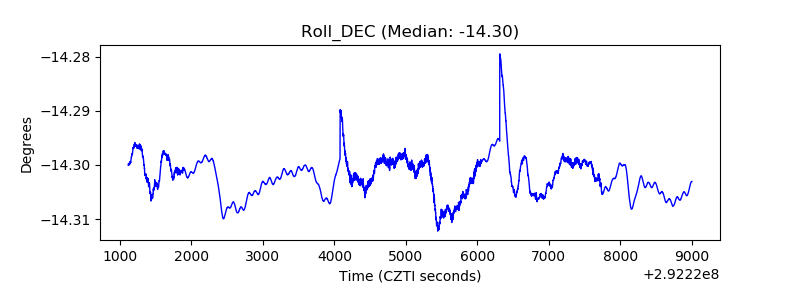 |
| _Roll_RA | 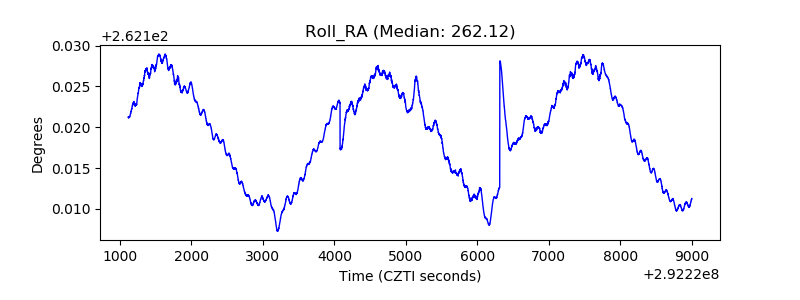 |
| Veto Counter | 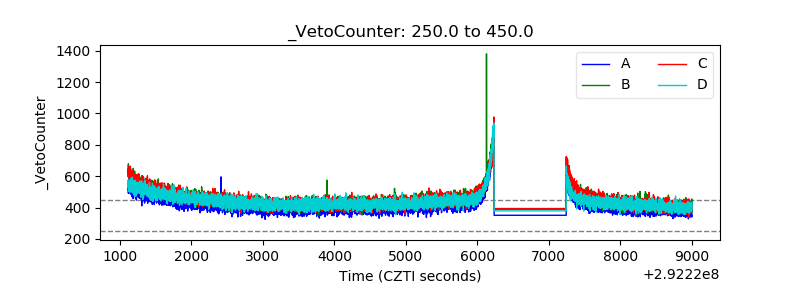 |