| Param | Original file | Final file |
|---|---|---|
| Filename | modeM0/AS1A05_046T01_9000002834_19037cztM0_level2.evt | modeM0/AS1A05_046T01_9000002834_19037cztM0_level2_quad_clean.evt |
| Size (bytes) | 737,089,920 | 87,589,440 |
| Size | 702.9 MB | 83.5 MB |
| Events in quadrant A | 3,290,269 | 596,312 |
| Events in quadrant B | 3,486,682 | 610,230 |
| Events in quadrant C | 4,027,888 | 577,815 |
| Events in quadrant D | 11,046,378 | 381,601 |
| Mode SS | |||
|---|---|---|---|
| Quadrant | BADHDUFLAG | Total packets | Discarded packets |
| A | 0 | 140 | 0 |
| B | 0 | 140 | 0 |
| C | 0 | 140 | 0 |
| D | 0 | 140 | 0 |
| Mode M0 | |||
|---|---|---|---|
| Quadrant | BADHDUFLAG | Total packets | Discarded packets |
| A | 0 | 14227 | 1 |
| B | 0 | 14672 | 1 |
| C | 0 | 16196 | 1 |
| D | 0 | 37587 | 5 |
| Mode M9 | |||
|---|---|---|---|
| Quadrant | BADHDUFLAG | Total packets | Discarded packets |
| A | 0 | 6 | 0 |
| B | 0 | 6 | 0 |
| C | 0 | 6 | 0 |
| D | 0 | 6 | 0 |
| Quadrant | Total seconds | Saturated seconds | Saturation percentage |
|---|---|---|---|
| A | 6971 | 114 | 1.635346% |
| B | 6971 | 142 | 2.037010% |
| C | 6972 | 306 | 4.388985% |
| D | 6971 | 3020 | 43.322335% |
Noise dominated data is calculated using 1-second bins in cleaned event files. If a bin has >2000 counts, and if more than 50% of those come from <1% of pixels, then it is considered to be noise-dominated and hence unusable.
| Quadrant | # 1 sec bins | Bins with >0 counts | Bins with >2000 counts | High rate bins dominated by noise | Noise dominated (total time) | Noise dominated (detector-on time) | Marked lightcurve |
|---|---|---|---|---|---|---|---|
| A | 7531 | 6972 | 0 | 0 | 0.00% | 0.00% | 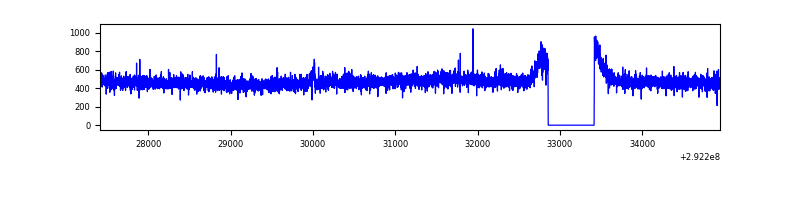 |
| B | 7531 | 6972 | 9 | 9 | 0.12% | 0.13% | 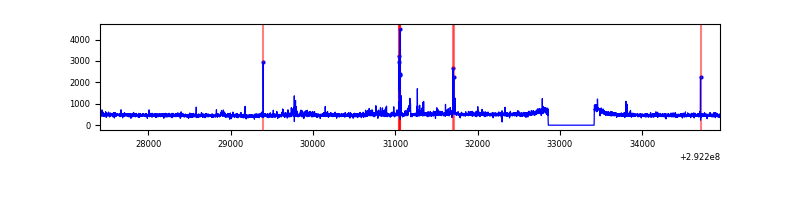 |
| C | 7532 | 6973 | 24 | 24 | 0.32% | 0.34% | 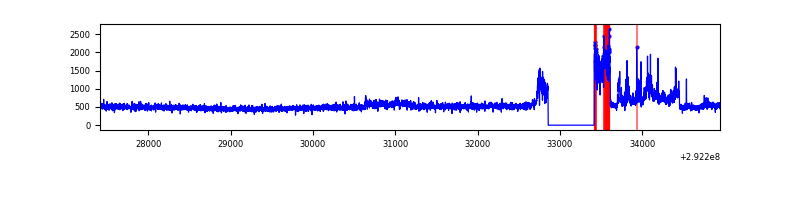 |
| D | 7531 | 6972 | 2498 | 2498 | 33.17% | 35.83% | 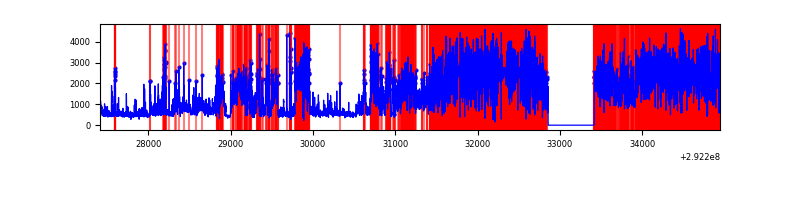 |
Top three noisy pixels from each quadrant. If the there are fewer than three noisy pixels in the level2.evt file, extra rows are filled as -1
| Pixel properties | Quadrant properties | ||||||
|---|---|---|---|---|---|---|---|
| Quadrant | DetID | PixID | Counts | Sigma | Mean | Median | Sigma |
| A | 13 | 254 | 8943 | 47.02 | 853 | 832 | 172.5 |
| A | 0 | 226 | 7478 | 38.53 | 853 | 832 | 172.5 |
| A | 3 | 137 | 6559 | 33.2 | 853 | 832 | 172.5 |
| B | 3 | 112 | 62078 | 375.77 | 850 | 828 | 163.0 |
| B | 10 | 245 | 44004 | 264.89 | 850 | 828 | 163.0 |
| B | 7 | 220 | 38066 | 228.46 | 850 | 828 | 163.0 |
| C | 3 | 233 | 679394 | 3533.71 | 814 | 821 | 192.0 |
| C | 14 | 238 | 125997 | 651.86 | 814 | 821 | 192.0 |
| C | 9 | 15 | 49685 | 254.46 | 814 | 821 | 192.0 |
| D | 7 | 238 | 8560841 | 54448.98 | 647 | 630 | 157.2 |
| D | 2 | 234 | 24180 | 149.79 | 647 | 630 | 157.2 |
| D | 10 | 50 | 10258 | 61.24 | 647 | 630 | 157.2 |
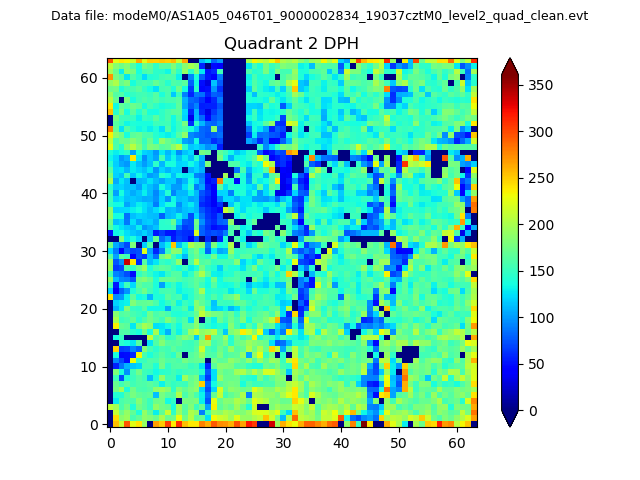
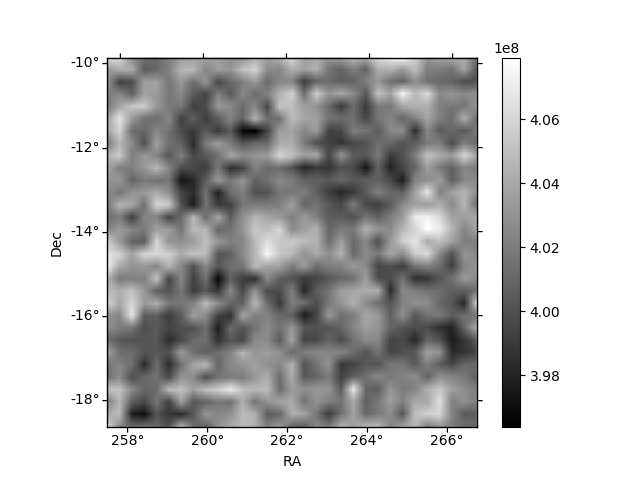
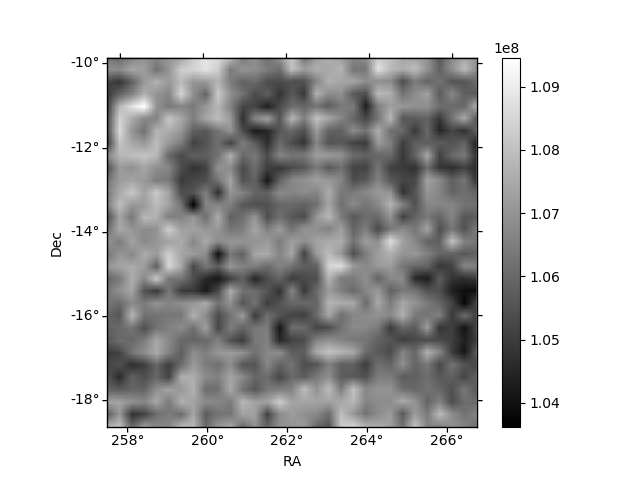
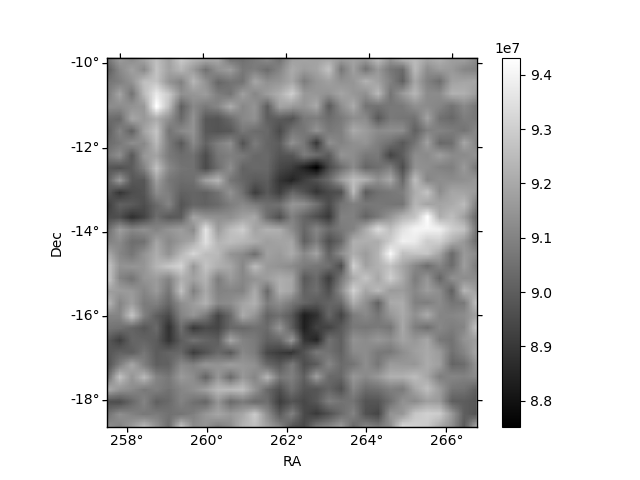
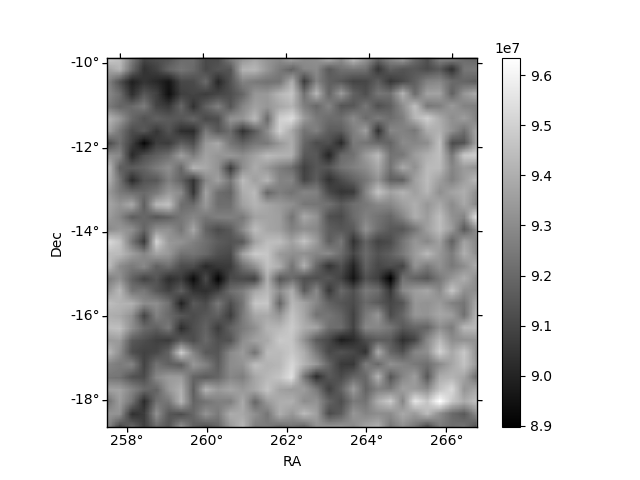
Histogram calculated using DETX and DETY for each event in the final _common_clean file
| Quadrant A | 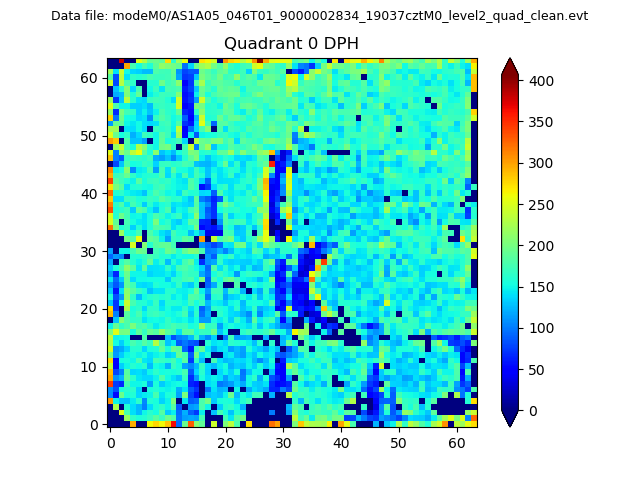 |
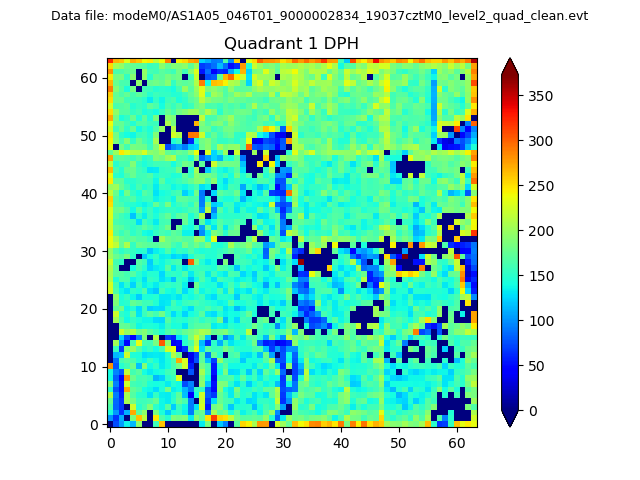 |
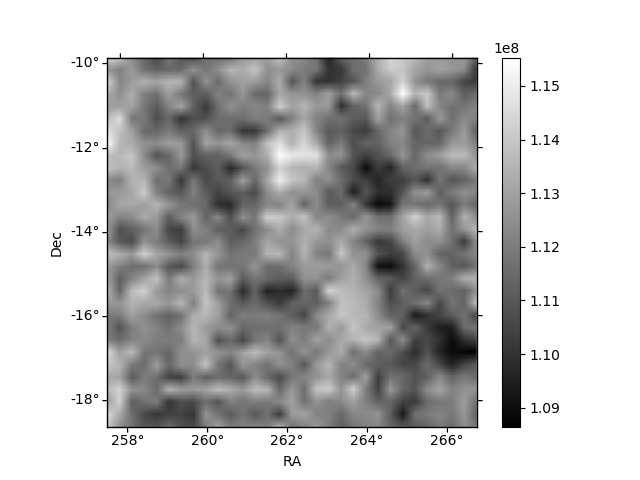
Quadrant B |
|---|---|---|---|
| Quadrant D | 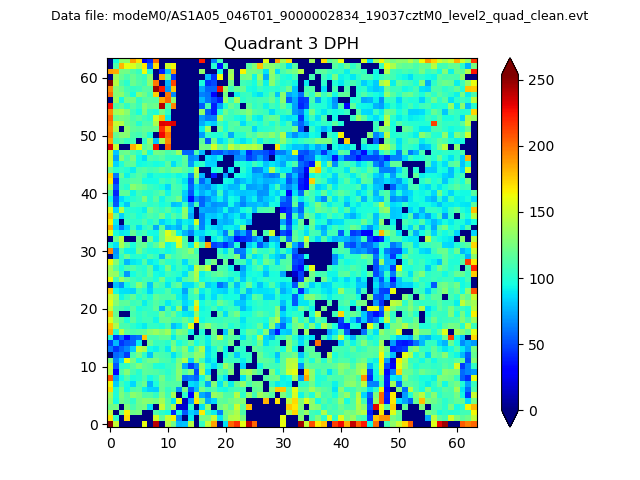 |
 |
Quadrant C |
| Plot type | Count rate plots | Images |
|---|---|---|
| Comparison with Poisson distribution Blue bars denote a histogram of data divided into 1 sec bins. Red curve is a Poisson curve with rate = median count rate of data. |
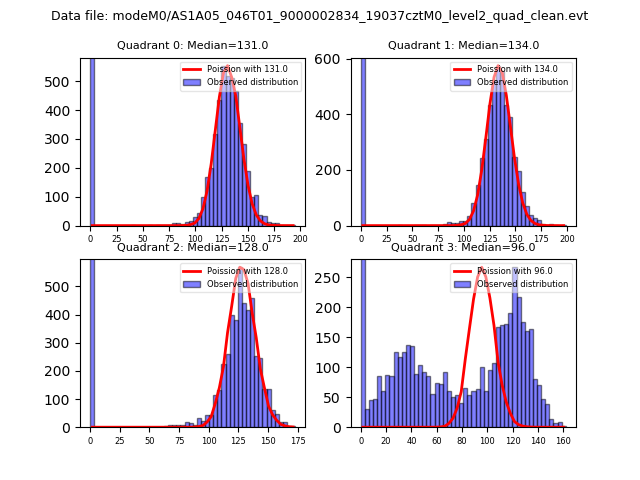 |
 |
| Quadrant-wise count rates Data is divided into 100 sec bins |
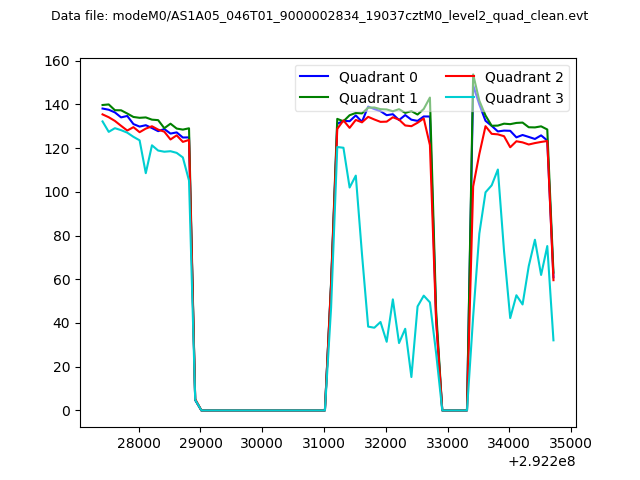 |
|
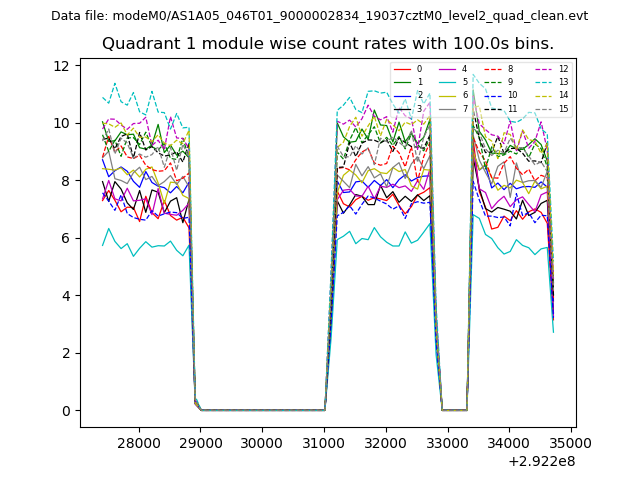
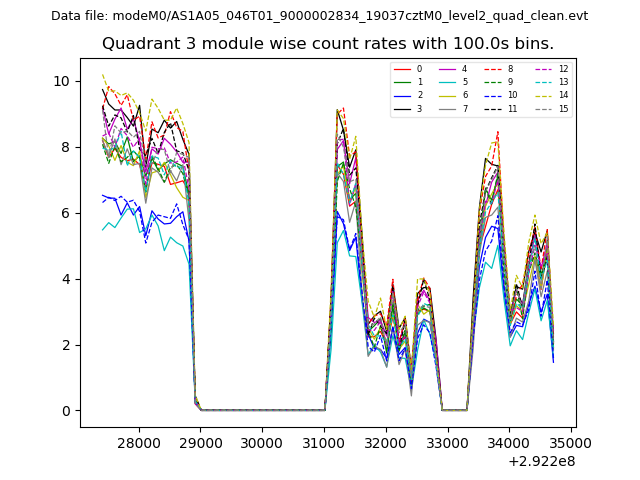
| Module-wise count rates for Quadrant A Data is divided into 100 sec bins |
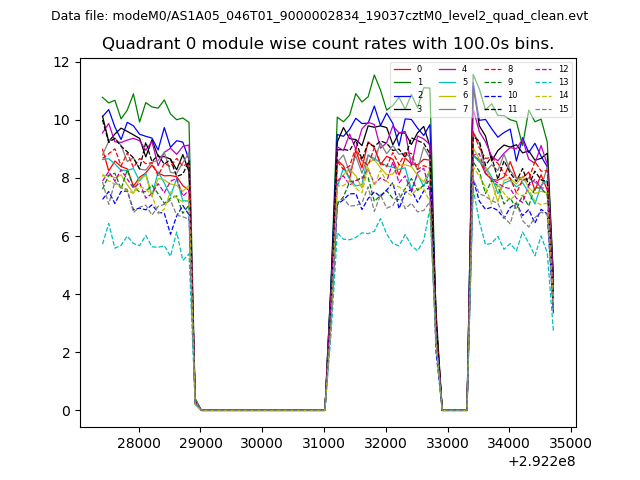 |
 |
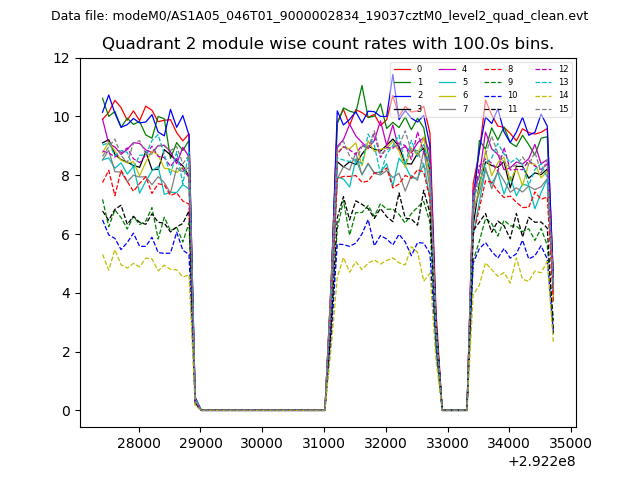
| Module-wise count rates for Quadrant B Data is divided into 100 sec bins |
 |
 |
| Module-wise count rates for Quadrant C Data is divided into 100 sec bins |
 |
 |
| Module-wise count rates for Quadrant D Data is divided into 100 sec bins |
 |
 |
| Parameter | Plot |
|---|---|
| CZT HV Monitor | 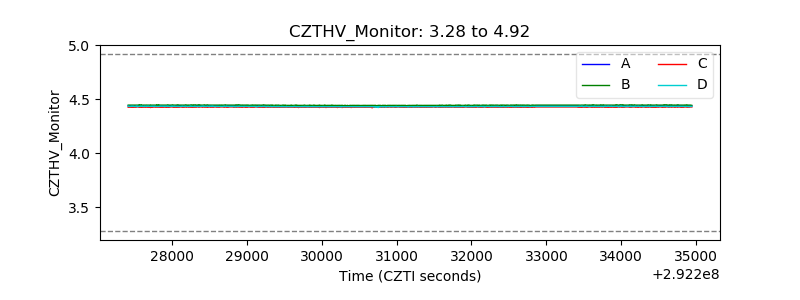 |
| D_VDD | 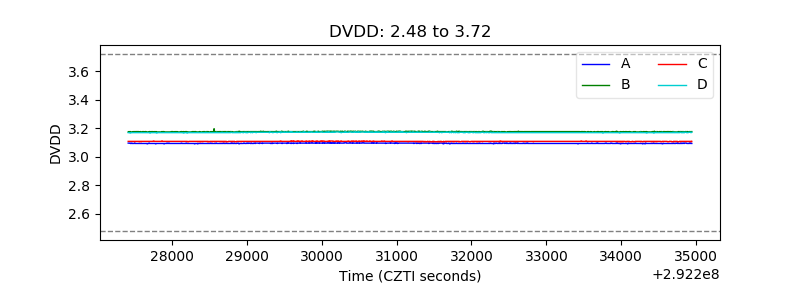 |
| Temperature 1 | 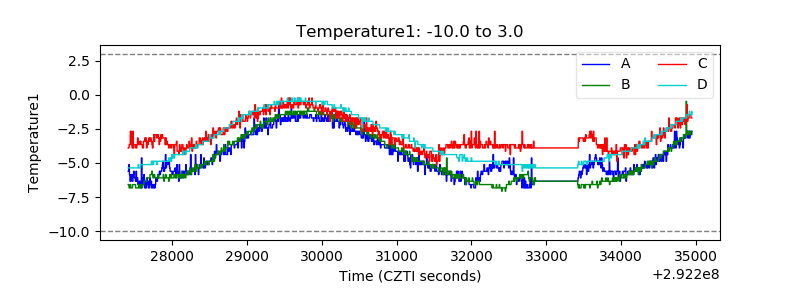 |
| Veto HV Monitor | 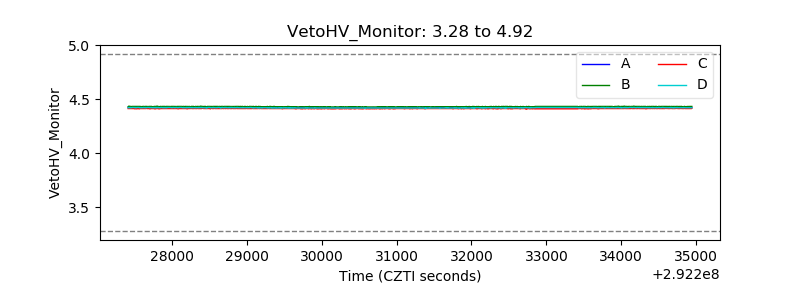 |
| Veto LLD | 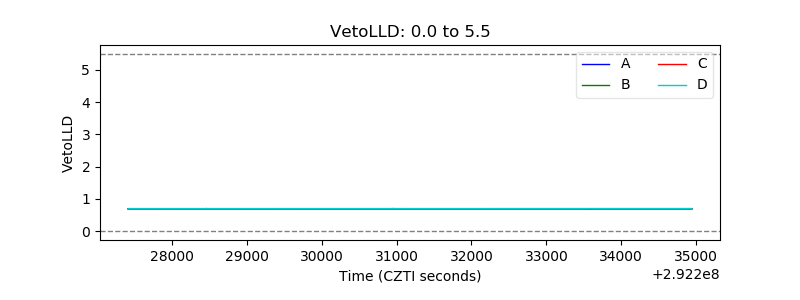 |
| Alpha Counter | 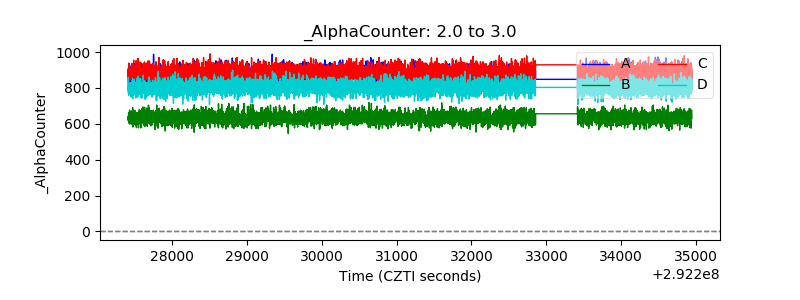 |
| _CPM_Rate | 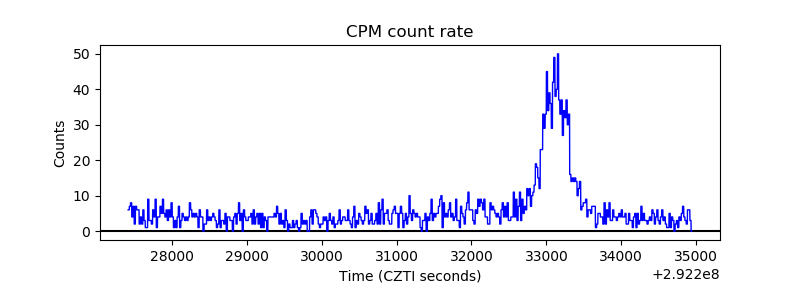 |
| CZT Counter | 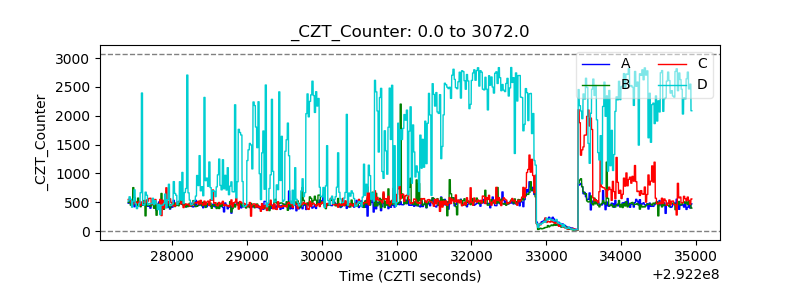 |
| +2.5 Volts monitor |  |
| +5 Volts monitor |  |
| _ROLL_ROT | 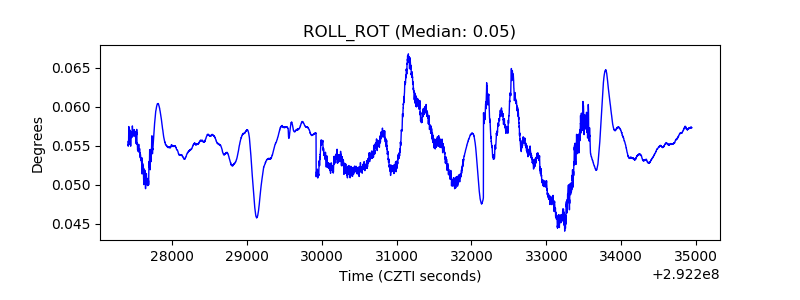 |
| _Roll_DEC | 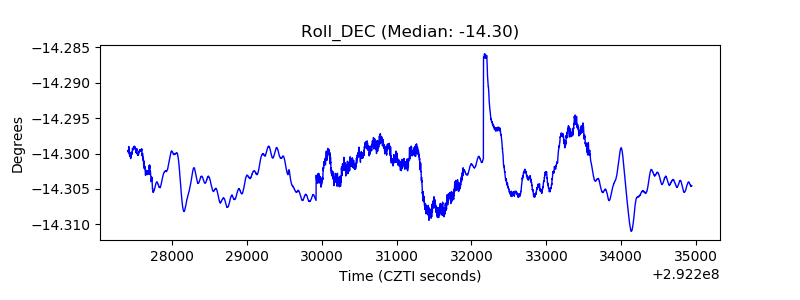 |
| _Roll_RA | 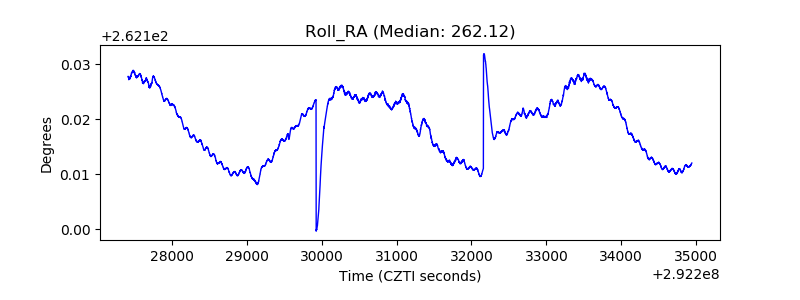 |
| Veto Counter | 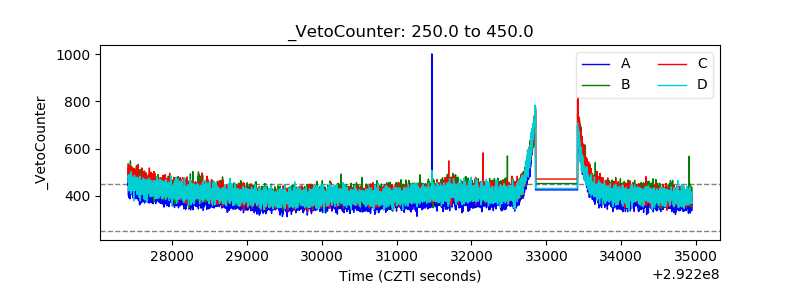 |